NIFTY 1D Time frame📍 Current Price Action
Trading around 25,005 – 25,010
Day change: about +0.4%
⚙ Technical Indicators
Moving Averages (5, 10, 20, 50, 100, 200 day): All showing buy signals → bullish structure
RSI (14): In bullish territory, not overbought → healthy momentum
Stochastic Oscillator: Near overbought zone → indicates strength, but chance of a short pullback
MACD: Positive crossover → supports upward momentum
📊 Support & Resistance
Immediate Resistance: 25,000 – 25,100 zone
Immediate Support: 24,800 – 24,900 zone
If price sustains above 25,100 → next upside levels can open higher (towards 25,200+)
If it breaks below 24,900 → downside could test 24,700 levels
🧠 Summary
Nifty 50 is in a bullish daily trend, currently consolidating near psychological resistance at 25,000. As long as it holds above 24,900, the bullish momentum is intact. A breakout above 25,100 could extend the rally further.
Do you also want me to give the weekly time frame (1W) view for a bigger picture trend?
ICICIBANK

SUNPHARMA 1D Time frame📈 1-Day Price Action
current: ₹1,610.50
Open: ₹1,592.50
High: ₹1,614.00
Low: ₹1,592.50
Close: ₹1,611.10
Volume: 1.14 million shares
🔧 Technical Indicators
Relative Strength Index (14): 65.29 — indicates bullish momentum
MACD: 6.80 — suggests upward trend
Moving Averages: 5-day MA: ₹1,608.84, 50-day MA: ₹1,586.46, 200-day MA: ₹1,610.12 — all signaling a buy
Pivot Point: ₹1,610.10 — aligns with current trading level
📊 Trend & Levels
Trend: Bullish
Support: ₹1,600
Resistance: ₹1,620
🧠 Market Sentiment
Analysts maintain a positive outlook on Sun Pharma, with JM Financial retaining a "Buy" rating and a revised target price of ₹2,025, reflecting confidence in the stock's potential for appreciation over the next year.

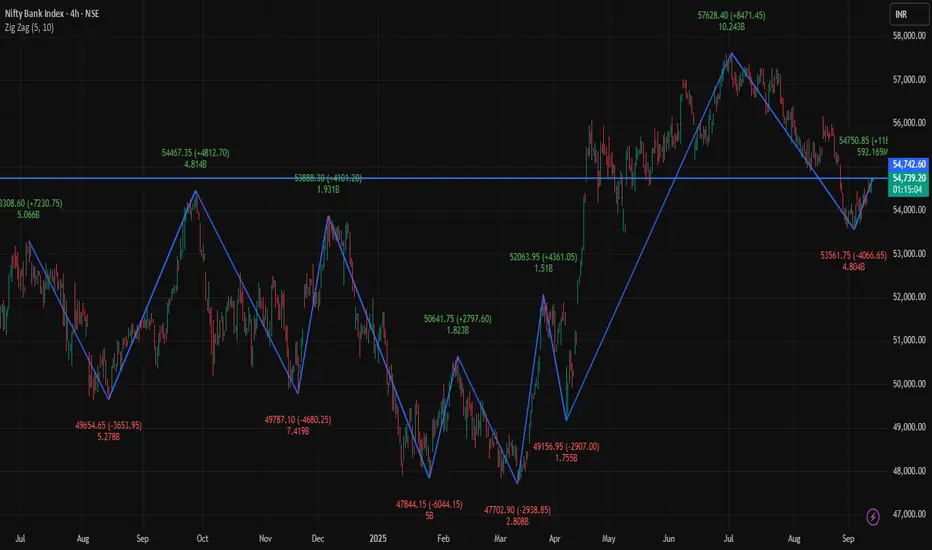
BANKNIFTY 4Hour Time frame📊 Current Snapshot
Current Price: ₹54,731
Day’s Range (4H): ₹54,600 – ₹54,800
Previous Close: ₹54,228
Opening Price (4H): ₹54,350
Volume: Moderate
🔑 Key Support & Resistance Levels
Immediate Support: ₹54,650
Next Support: ₹54,600
Immediate Resistance: ₹54,800
Next Resistance: ₹54,900
📈 Trend & Indicators
Trend: Mildly bullish; trading near short-term resistance.
RSI (14): ~64 – Neutral to slightly bullish.
MACD: Positive → indicates bullish momentum.
Moving Averages: Short-term averages indicate bullish bias.
🔮 Outlook
Bullish Scenario: Sustained move above ₹54,800 may push toward ₹54,900–₹55,000.
Bearish Scenario: Drop below ₹54,650 could lead to retracement toward ₹54,600.
Neutral Scenario: Consolidation between ₹54,650 – ₹54,800; breakout needed for directional move.
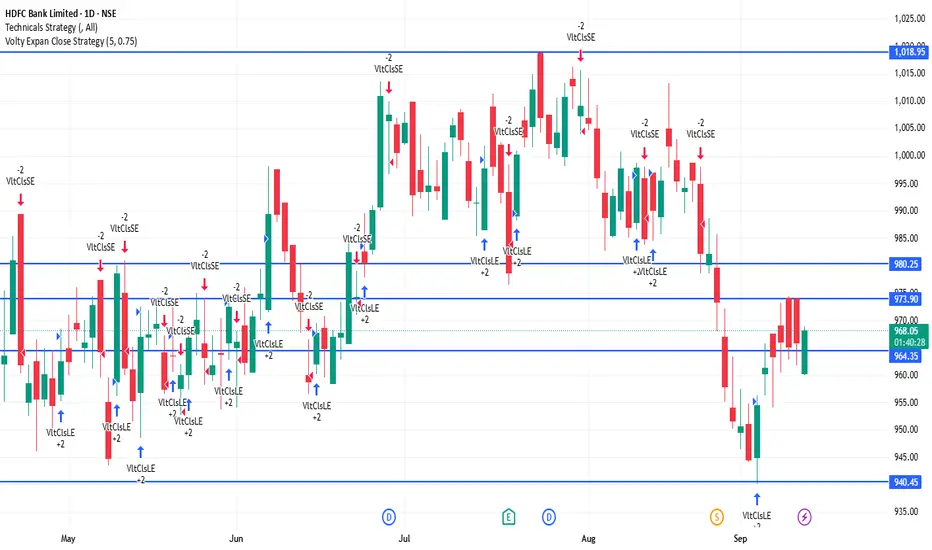
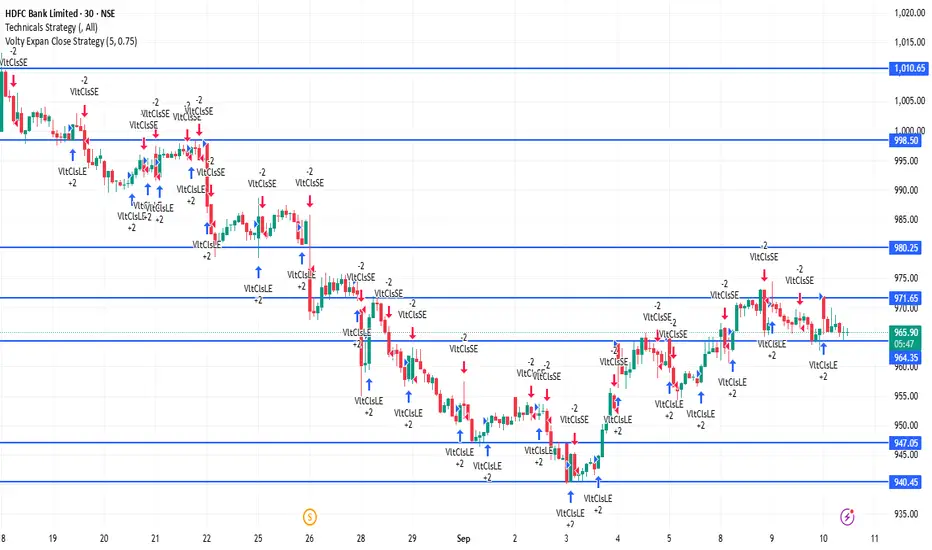
HDFCBANK 1D Time frameCurrent Price Action
HDFCBANK is trading around ₹962–968.
Day’s low is near ₹960 and high is around ₹978.
The stock is consolidating in a tight range.
⚖️ Key Levels
Immediate Resistance: ₹968 – ₹970
Next Resistance: ₹975 – ₹980
Immediate Support: ₹960
Strong Support: ₹950 – ₹955
📊 Indicators
Moving Averages: Price is below the 50-day MA (short-term weakness) but above the 200-day MA (long-term trend still intact).
RSI (14-day): Around 40–45 → neutral to slightly weak momentum.
MACD: Negative bias, showing limited upside strength.
📈 Outlook
If HDFCBANK stays above ₹960, a bounce toward ₹970 – ₹975 is possible.
A breakout above ₹975 – ₹980 could turn the trend stronger.
If the stock slips below ₹955 – ₹950, it may head lower toward ₹940 – ₹935.
Current bias: Neutral to slightly bearish until price breaks above resistance.
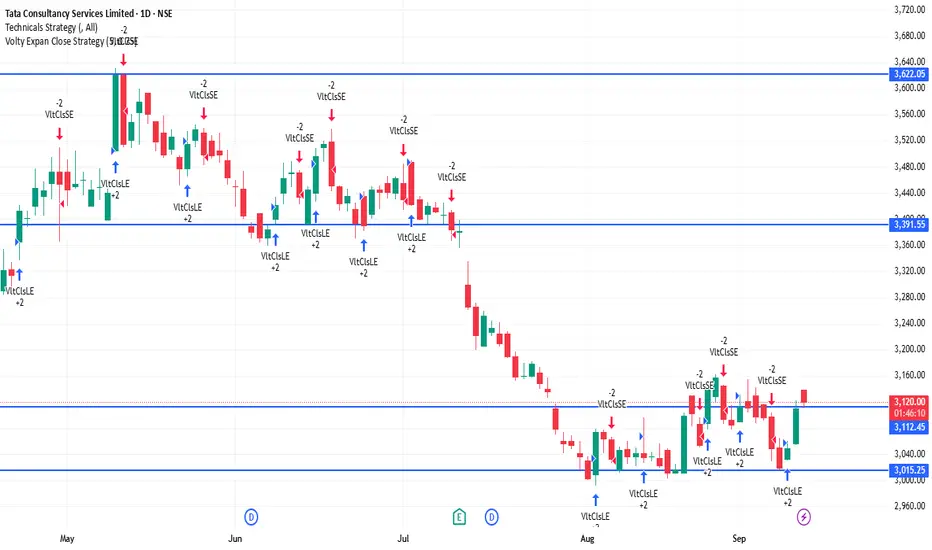
TCS 1D Time framePrice Action (Daily Chart)
Current price is around ₹3,117 - ₹3,120
Price is consolidating near support zones after a recent upward move.
Candle structure shows buying interest at lower levels, but resistance is capping the upside.
📊 Indicators
Moving Averages (MA):
Short-term MAs (5-day, 10-day) are slightly mixed.
Medium to long MAs (20, 50, 100, 200-day) are in buy zone, showing broader uptrend strength.
RSI (14-day): ~62-65 → indicates mild bullish momentum, not yet in overbought zone.
MACD: Shows positive crossover, momentum favors bulls but losing some strength.
⚖️ Key Levels
Immediate Resistance: ₹3,135 – ₹3,140
Next Resistance: ₹3,170 – ₹3,200
Immediate Support: ₹3,100 – ₹3,110
Strong Support: ₹3,050 – ₹3,000
📈 Outlook
Short-term sentiment: Neutral to slightly bullish as long as price holds above ₹3,100.
A breakout above ₹3,140 may open room toward ₹3,170–₹3,200.
A breakdown below ₹3,100 may drag price to ₹3,050–₹3,000.
Overall trend on daily timeframe is still uptrend, but near resistance, so caution is needed.
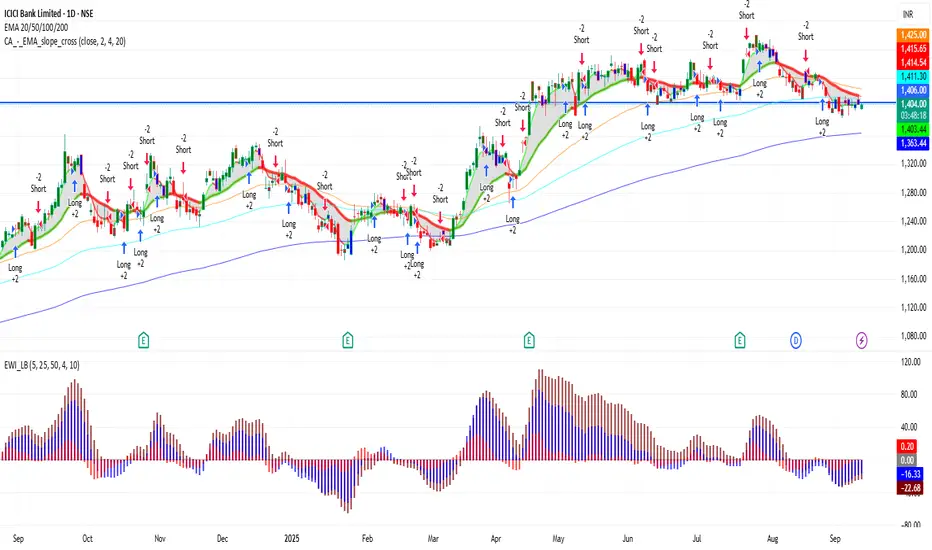
ICICIBANK 1D Time frame📊 Current Snapshot
Current Price: ₹1,406.10
Day’s Range: ₹1,402.00 – ₹1,416.35
52-Week Range: ₹1,186.00 – ₹1,500.00
Previous Close: ₹1,403.90
Opening Price: ₹1,403.70
Market Cap: ₹10.02 lakh crore
Volume: ~81.3 lakh shares
📈 Trend & Indicators
Trend: Neutral to mildly bullish; trading near 50-day and 200-day moving averages.
RSI (14): 60 – Neutral; no immediate overbought or oversold conditions.
MACD: Positive → indicates bullish momentum.
Moving Averages: Short-term moving averages suggest neutral to slightly bullish outlook.
🔮 Outlook
Bullish Scenario: Break above ₹1,416 with strong volume could target ₹1,450.
Bearish Scenario: Drop below ₹1,400 may lead to further decline toward ₹1,375.
Neutral Scenario: Consolidation between ₹1,400 – ₹1,416; breakout needed for directional move.
📌 Key Factors to Watch
Market Sentiment: Overall market trend and investor behavior.
Economic Indicators: Interest rates, inflation, and RBI policy updates.
Global Cues: Global market trends, US indices, crude oil, and currency movements.
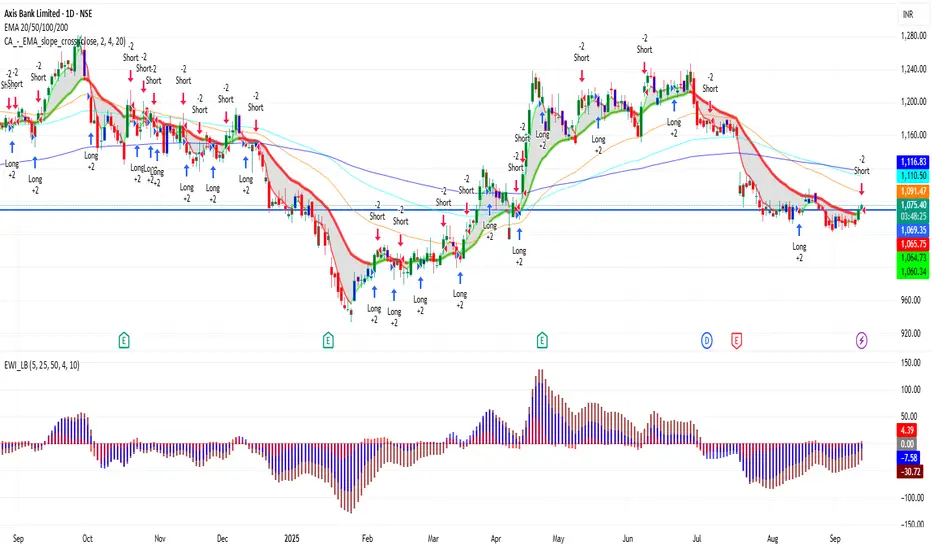
AXISBANK 1D Time frame📊 Current Snapshot
Current Price: ₹1,073.50
Day’s Range: ₹1,069.00 – ₹1,073.20
52-Week Range: ₹934.00 – ₹1,281.75
Previous Close: ₹1,070.10
Opening Price: ₹1,069.00
Market Cap: Approx. ₹3.32 lakh crore
Volume: ~1.65 lakh shares
📈 Trend & Indicators
Trend: Neutral to mildly bullish; trading near 50-day and 200-day moving averages.
RSI (14): 60 – Neutral; no immediate overbought or oversold conditions.
MACD: Positive → indicates bullish momentum.
Moving Averages: Short-term moving averages suggest neutral to slightly bullish outlook.
🔮 Outlook
Bullish Scenario: Break above ₹1,075 with strong volume could target ₹1,090.
Bearish Scenario: Drop below ₹1,065 may lead to further decline toward ₹1,050.
Neutral Scenario: Consolidation between ₹1,065 – ₹1,075; breakout needed for directional move.
📌 Key Factors to Watch
Market Sentiment: Overall market trend and investor behavior.
Economic Indicators: Interest rates, inflation, and RBI policy updates.
Global Cues: Global market trends, US indices, crude oil, and currency movements.
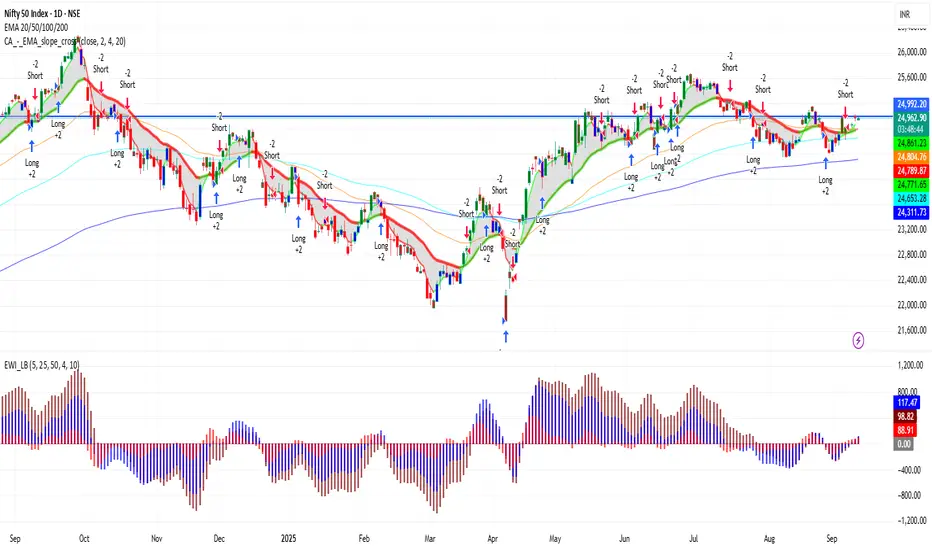
NIFTY 1D Time frame📊 Current Snapshot
Current Price: ₹24,981
Previous Close: ₹24,960.15
Day’s Range: ₹24,915 – ₹25,035
52-Week Range: ₹21,743 – ₹26,277
Market Cap: Approx. ₹21.5 lakh crore
Volume: ~1.8 crore shares
🔑 Key Support & Resistance Levels
Immediate Support: ₹24,900
Next Support: ₹24,500
Immediate Resistance: ₹25,050
Next Resistance: ₹25,200
📈 Trend & Indicators
Trend: Neutral to mildly bullish; trading near 50-day and 200-day moving averages.
RSI (14): 65 – approaching overbought zone.
MACD: Positive, indicating bullish momentum.
Moving Averages: Short-term moving averages suggest neutral to slightly bullish outlook.
🔮 Outlook
Bullish Scenario: Break above ₹25,050 with strong volume could push Nifty toward ₹25,200.
Bearish Scenario: Drop below ₹24,900 may lead to further decline toward ₹24,500.
Neutral Scenario: Consolidation between ₹24,900 – ₹25,050; breakout needed for directional move.
📌 Key Factors to Watch
Broader market sentiment.
Economic indicators such as interest rates and inflation.
Global cues affecting investor confidence.
TVSMOTOR 1D Time frameCurrent Snapshot
Last Traded Price: ₹3,495.30
Day’s Range: ₹3,455.50 – ₹3,502.40
52-Week Range: ₹2,171.40 – ₹3,602.70
Market Cap: ₹1.64 lakh crore
Volume: 159,624 shares
VWAP: ₹3,474.60
📈 Trend & Indicators
Trend: Neutral to mildly bullish; trading above 20-day and 50-day EMAs.
RSI (14): Around 68 – approaching overbought territory.
MACD: Positive → indicates bullish momentum.
Moving Averages: Short-term MAs suggest neutral to slightly bullish outlook.
🔮 Outlook
Bullish Scenario: Break above ₹3,502 with strong volume could target ₹3,550.
Bearish Scenario: Drop below ₹3,455 may lead to further decline toward ₹3,400.
Neutral Scenario: Consolidation between ₹3,455 – ₹3,502; breakout needed for directional move.
📌 Key Factors to Watch
Market Sentiment: Broader market moves can impact TVS Motor.
Economic Indicators: Interest rates, fuel prices, and inflation affect automotive stocks.
Company News: Any financial results or strategic announcements can influence price.

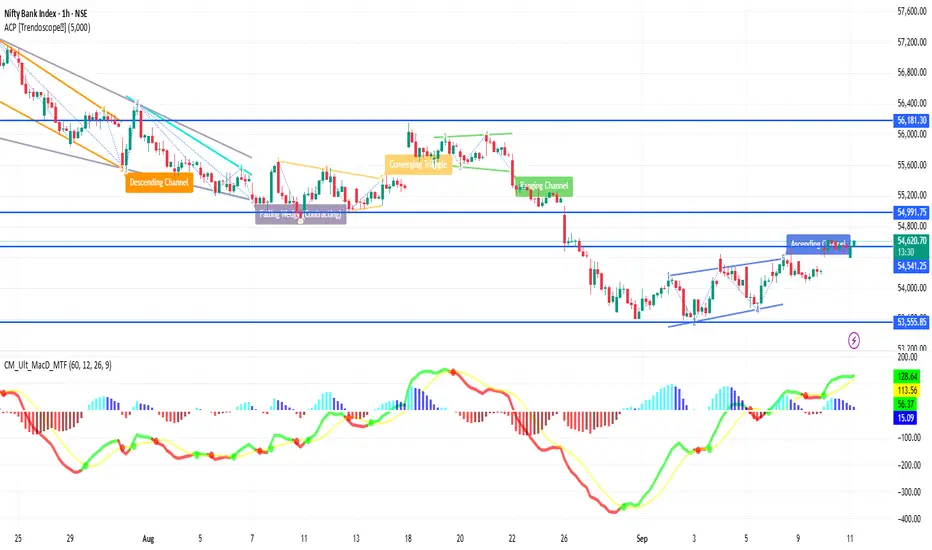
BANKNIFTY 1H Time frameBankNifty 1H Snapshot
Current Price: ~54,581
Recent Range: ~54,400 – 54,700
Bias: Slightly bullish, holding above short-term support
📈 Key Levels
Immediate Resistance: 54,650 – 54,700
Next Resistance: 54,800 → if broken, can open upside momentum
Immediate Support: 54,450
Deeper Support: 54,300 → then 54,000
🔎 Indicators (1-Hour)
RSI: Mid-60s → bullish but not yet extreme
MACD: Positive crossover → supports buying momentum
Stochastic: Near overbought → watch for minor pullback
🧭 Outlook
Bullish Case: Sustained above 54,600 → next push toward 54,700-54,800
Bearish Case: Slip below 54,450 → opens weakness toward 54,300
Overall Bias: Moderately bullish while holding above 54,450
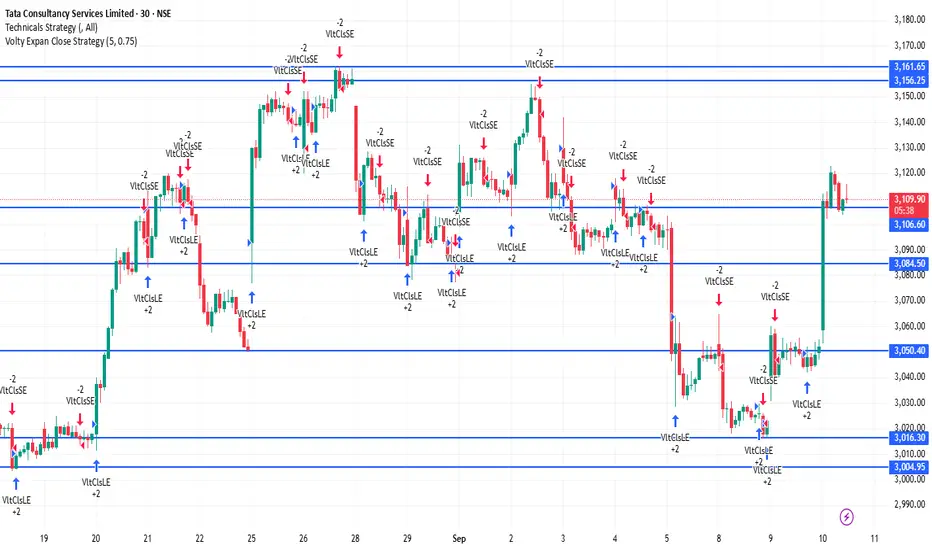
TCS 30Minutes Time frameTCS – 30-Minute Time Frame Important Levels (Current Estimate)
Support Zones
₹3,080 – ₹3,090 → Immediate intraday support
₹3,050 – ₹3,060 → Stronger support level where dip-buying may emerge
₹3,020 – ₹3,030 → Major support; a breakdown here may indicate intraday weakness
Resistance Zones
₹3,130 – ₹3,140 → Immediate intraday resistance
₹3,160 – ₹3,170 → Strong resistance zone; a breakout may extend upward momentum
₹3,200 – ₹3,210 → Major resistance; surpassing this can fuel a more sustained rally
Intraday Trend Outlook (30M Chart)
The trend appears mildly bullish as long as TCS holds above ₹3,080.
A clear move above ₹3,140 can open the path toward ₹3,160–₹3,200.
If it falls below ₹3,050, price may pull back toward ₹3,020, and a break under that could signal further downside.
HDFCBANK 30Minutes Time frameHDFC Bank – 30M Important Levels (Current)
These levels are calculated using today’s intraday pivot data and provide reliable reference points for short-term trading.
Pivot Point (Mid-Level): ~₹967
First Resistance (R1): ~₹972
Second Resistance (R2): ~₹979
First Support (S1): ~₹960
Second Support (S2): ~₹955
These intraday pivots help highlight key zones where intra-day price action often stalls, reverses, or accelerates.
Intraday Trend Outlook (30M Chart)
Above ₹972: Bullish momentum may continue, with potential upside toward ~₹979.
Between ₹960 – ₹972: Neutral-to-bullish range; watch for sustain or reversal.
Below ₹960: Bearish pressure may build, potentially testing down to ~₹955.
Impact of Rupee-Dollar Exchange Rate on Indian StocksIntroduction
The stock market is a complex system where numerous factors—both domestic and global—interact to determine price movements. One such crucial factor is the exchange rate between the Indian Rupee (INR) and the US Dollar (USD). The Rupee-Dollar exchange rate plays a vital role because the US Dollar is the world’s reserve currency, the primary medium of global trade, and a benchmark for financial transactions worldwide.
In India, the economy is deeply interconnected with global trade, capital flows, and financial markets. Any change in the value of the Rupee against the Dollar has wide-ranging implications on businesses, investors, and the stock market. Companies that import raw materials or export finished goods, sectors like Information Technology (IT), Pharmaceuticals, Oil & Gas, Banking, Aviation, and even Foreign Institutional Investors (FIIs), are directly influenced by these fluctuations.
This essay explores in detail how the Rupee-Dollar exchange rate impacts Indian stocks, covering the theoretical background, sectoral influences, investor behavior, macroeconomic effects, and real-world case studies.
Understanding the Rupee-Dollar Exchange Rate
The exchange rate refers to how much one unit of a currency is worth in terms of another. In India, the exchange rate most closely tracked by investors is INR/USD—the number of Rupees required to buy one US Dollar.
If 1 USD = ₹80, it means that importing something worth $1 will cost ₹80 in India.
If the Rupee depreciates (falls in value), say 1 USD = ₹85, imports become more expensive, but exporters receive more Rupees for the same Dollar earnings.
If the Rupee appreciates (gains in value), say 1 USD = ₹75, imports become cheaper, but exporters earn fewer Rupees per Dollar.
This constant push-and-pull directly influences corporate profitability and, in turn, the stock market.
Why Does the Rupee Move Against the Dollar?
The exchange rate fluctuates due to a combination of domestic and global factors:
Demand & Supply of Dollars – If India imports more than it exports, demand for Dollars rises, weakening the Rupee.
Foreign Institutional Investment (FII) Flows – When FIIs invest in Indian equities, they bring in Dollars, strengthening the Rupee. Conversely, when they pull out, the Rupee weakens.
Interest Rate Differentials – Higher interest rates in the US attract global investors, increasing demand for Dollars.
Crude Oil Prices – India is heavily dependent on crude imports. Rising oil prices increase Dollar demand, weakening the Rupee.
Geopolitical Events – Wars, sanctions, and global economic slowdowns push investors toward the Dollar as a "safe haven."
Inflation & Growth Rates – Higher inflation in India compared to the US reduces the Rupee’s purchasing power.
These factors cause daily volatility in the Rupee-Dollar exchange rate, impacting stock prices.
The Link Between Exchange Rate and Stock Market
The Rupee-Dollar relationship influences stocks in three broad ways:
Corporate Earnings Impact – Companies that earn or spend in Dollars see changes in profitability.
Foreign Investor Behavior – FIIs track currency stability before investing in emerging markets like India.
Macroeconomic Sentiment – A stable Rupee improves confidence, while sharp depreciation raises concerns about inflation, current account deficit, and fiscal health.
Sector-Wise Impact of Rupee-Dollar Exchange Rate
1. Information Technology (IT) Sector
Indian IT companies like TCS, Infosys, Wipro, and HCL earn the majority of their revenue in Dollars by exporting software services to the US and Europe.
A weak Rupee is positive for IT stocks since they earn more Rupees for the same Dollar revenue.
Example: If Infosys earns $1 billion, at ₹80/USD revenue = ₹80,000 crore. If Rupee falls to ₹85/USD, revenue = ₹85,000 crore (without increasing actual Dollar earnings).
Impact: Rupee depreciation → IT stocks rally. Rupee appreciation → IT stocks face margin pressure.
2. Pharmaceutical Sector
Similar to IT, Pharma companies like Sun Pharma, Dr. Reddy’s, and Cipla export a large share of medicines to the US.
A weak Rupee boosts export revenues, but import costs (like Active Pharmaceutical Ingredients from China) may rise.
Impact: Net positive for export-oriented pharma firms, but mixed for those heavily dependent on imports.
3. Oil & Gas Sector
India imports over 80% of its crude oil needs, priced in Dollars.
A weak Rupee makes oil imports costlier, increasing input costs for companies like IOC, BPCL, HPCL.
This also impacts sectors like aviation, paints, fertilizers, and chemicals, which rely on crude derivatives.
Impact: Rupee depreciation hurts oil & gas and related sectors.
4. Aviation Industry
Airlines like IndiGo, SpiceJet, and Air India earn revenue in Rupees but pay for aircraft leases, maintenance, and fuel in Dollars.
A weak Rupee increases costs significantly, leading to lower margins.
Impact: Rupee depreciation is negative for aviation stocks.
5. Banking & Financial Services
Banks with significant foreign borrowings may face higher repayment costs when the Rupee falls.
However, if they hold Dollar assets, they benefit.
Investor sentiment in the financial sector often mirrors overall macroeconomic stability tied to currency movements.
6. Import-Oriented Companies
Sectors like electronics, automobiles, FMCG (raw materials), and chemicals rely on imports.
A weaker Rupee raises raw material costs, compressing margins unless passed on to consumers.
7. Export-Oriented Manufacturing
Sectors like textiles, gems & jewelry, and leather benefit from a weaker Rupee as global buyers pay in Dollars.
However, if raw materials are imported, the benefits get diluted.
Impact on Foreign Investors
Foreign Institutional Investors (FIIs) are among the biggest drivers of the Indian stock market.
Stable Rupee: Encourages FIIs to invest since currency risk is lower.
Weakening Rupee: Even if stock returns are strong, FIIs may lose money when converting Rupees back to Dollars.
Example: If Nifty rises 10% but the Rupee falls 8% against the Dollar, FIIs net only ~2% returns.
Sudden depreciation often triggers FII outflows, leading to stock market corrections.
Thus, exchange rate stability is as important as stock fundamentals in attracting foreign capital.
Macroeconomic Effects on Stock Market
Inflation: A weak Rupee increases import costs (oil, electronics, machinery), leading to inflation. High inflation reduces corporate margins and consumer demand, pressuring stocks.
Current Account Deficit (CAD): Higher import bills widen CAD, weakening investor confidence.
Government Fiscal Position: Subsidy burdens (fertilizers, fuel) rise with Dollar appreciation, impacting fiscal deficit and bond yields, indirectly affecting equities.
Monetary Policy: RBI may raise interest rates to defend the Rupee, impacting borrowing costs and stock valuations.
The Way Forward
India’s growing integration into the global economy ensures that the Rupee-Dollar dynamic will continue to influence stocks. Key trends to watch:
US Federal Reserve policies – Dollar movements globally.
Energy Transition – Reducing oil imports will lower currency vulnerability.
Boosting Exports – Government initiatives like PLI schemes strengthen export-led sectors.
RBI Interventions – Maintaining stability via forex reserves.
Conclusion
The Rupee-Dollar exchange rate is more than just a number—it’s a reflection of India’s economic health, trade balance, and global investor confidence. Its impact on the stock market is far-reaching:
Exporters like IT and Pharma gain from Rupee weakness.
Import-heavy sectors like oil, aviation, and FMCG suffer.
Investors—both domestic and foreign—adjust portfolios based on currency trends.
Macroeconomic stability is closely linked to exchange rate dynamics.
For stock market participants, understanding this relationship provides an edge in making informed investment decisions. In the long run, India’s structural reforms, increasing exports, and growing financial depth may reduce vulnerability to Rupee-Dollar volatility. Until then, every swing in the currency will continue to ripple across Dalal Street.
TVSMOTOR 1D Time frame📍 TVSMOTOR – 1D Important Levels (Current)
🔹 Support Zones
2,050 – 2,070 → Immediate daily support
1,980 – 2,000 → Strong support zone; buyers expected here
1,900 – 1,920 → Major support; breakdown here may shift trend bearish
🔹 Resistance Zones
2,120 – 2,140 → Immediate daily resistance
2,180 – 2,200 → Strong resistance; breakout can extend momentum
2,250 – 2,280 → Major resistance; if crossed, bullish trend strengthens
⚖️ Daily Trend Outlook
TVSMOTOR is in a sideways-to-bullish structure on the daily chart.
As long as price holds above 2,050, momentum remains positive.
A breakout above 2,140 – 2,200 could push price towards 2,250 – 2,280.
A breakdown below 2,050 may drag it down to 2,000 – 1,920.

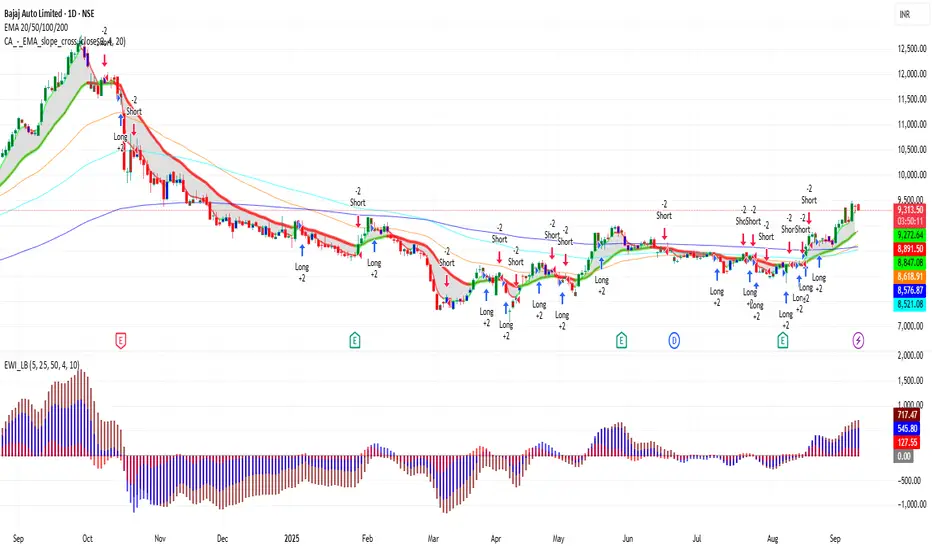
BAJAJ_AUTO 1D Time frame📍 BAJAJ_AUTO – 1D Important Levels (Current)
🔹 Support Zones
9,050 – 9,100 → Immediate daily support
8,800 – 8,900 → Strong support; buyers likely to defend this zone
8,500 – 8,600 → Major support; breakdown here may shift trend bearish
🔹 Resistance Zones
9,300 – 9,400 → Immediate daily resistance
9,550 – 9,650 → Strong resistance zone; breakout may extend upside momentum
9,800 – 10,000 → Major psychological resistance; if crossed, bullish trend strengthens further
⚖️ Daily Trend Outlook
Bajaj Auto is in a bullish structure on the daily chart, forming higher lows.
As long as price stays above 9,050, the stock remains positive.
A breakout above 9,400 – 9,650 can take it towards 9,800 – 10,000.
A breakdown below 9,050 could drag it towards 8,900 – 8,600.
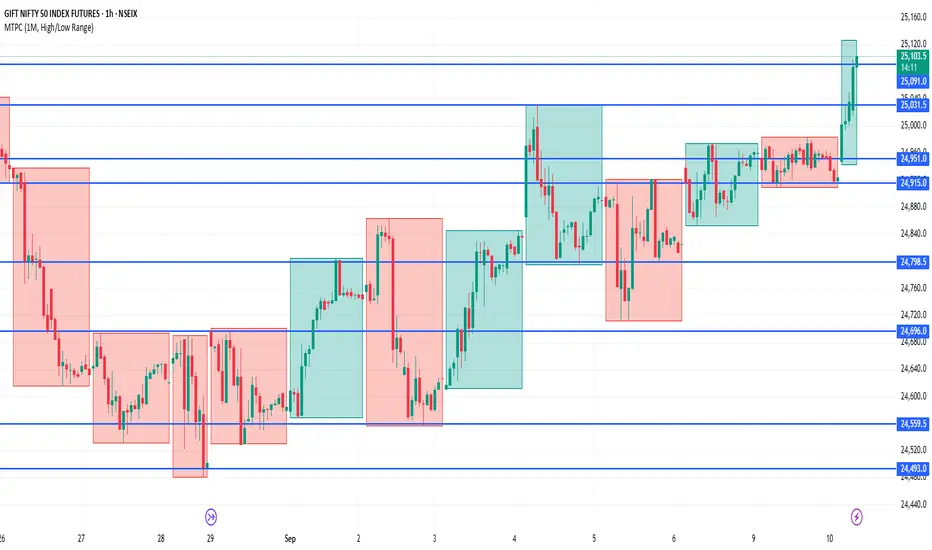
NIFTY1!📍 NIFTY1! – 1H Key Levels
🔹 Support Zones
22,450 – 22,500 → Immediate intraday support
22,350 – 22,400 → Stronger support, buyers likely active here
22,200 – 22,250 → Major support zone, breakdown can invite selling pressure
🔹 Resistance Zones
22,650 – 22,700 → Immediate resistance on 1H chart
22,800 – 22,850 → Strong resistance area, breakout may fuel rally
23,000 → Psychological and major resistance zone
⚖️ Quick Summary
Above 22,700, momentum may push Nifty Futures towards 22,850 – 23,000.
Below 22,450, weakness could drag price back to 22,350 – 22,200.
Current 1H trend bias is mildly bullish, but range-bound moves are possible between 22,450 – 22,700 before a breakout.
Swing Trading & Positional TradingPart I: Understanding Swing Trading
1. What is Swing Trading?
Swing trading is a short- to medium-term trading approach where traders aim to profit from "swings" or price fluctuations in an asset. Unlike intraday trading, where positions are squared off within a single session, swing traders hold positions for a few days to a few weeks, depending on momentum.
The main objective is to capture the bulk of a trend move—neither entering at the absolute bottom nor exiting at the exact top but staying in the "sweet spot" of a price swing.
2. Core Characteristics of Swing Trading
Time Horizon: 2 days to 3 weeks.
Capital Requirement: Moderate. Lower margin compared to intraday but requires patience.
Analysis Focus: Technical analysis, chart patterns, candlesticks, and momentum indicators.
Trading Frequency: Higher than positional but lower than intraday.
3. Swing Trading Strategies
Trend Following:
Enter trades in the direction of an established trend.
Tools: Moving averages (50 EMA, 200 EMA), ADX, price channels.
Pullback Trading:
Enter during temporary retracements in a trend.
Example: Buy during dips in an uptrend or short during rallies in a downtrend.
Breakout Trading:
Enter when the price breaks out of consolidation or chart patterns (triangle, flag, head and shoulders).
Reversal Trading:
Anticipate turning points when a trend exhausts.
Tools: RSI divergence, MACD crossover, candlestick reversal signals (Doji, Hammer, Shooting Star).
4. Tools & Indicators for Swing Trading
Moving Averages: Identify trend direction.
RSI (Relative Strength Index): Measure momentum, detect overbought/oversold conditions.
MACD (Moving Average Convergence Divergence): Spot trend reversals and momentum.
Volume Profile: Confirm breakout strength.
Support & Resistance Levels: Define entry/exit zones.
5. Advantages of Swing Trading
Less stressful than intraday trading.
Flexible for people with jobs/businesses.
Potential to earn higher returns than long-term investing due to frequent trades.
Lower exposure to overnight risk than positional traders.
6. Risks and Challenges
Market gaps and overnight news can affect trades.
Requires constant monitoring of charts.
False breakouts may lead to losses.
Higher transaction costs than positional trading due to more frequent trades.
Part II: Understanding Positional Trading
1. What is Positional Trading?
Positional trading is a medium- to long-term trading style, where trades are held for weeks to months (sometimes even years). Unlike swing traders, positional traders are less concerned with short-term volatility and more focused on major trends, fundamental drivers, and macroeconomic factors.
This style combines technical analysis for timing with fundamental analysis for conviction.
2. Core Characteristics of Positional Trading
Time Horizon: Weeks to months.
Capital Requirement: Higher, as positions are larger and often held overnight for long durations.
Analysis Focus: Combination of fundamentals (earnings, economic data, interest rates) and technicals (long-term charts).
Trading Frequency: Low. Only a few trades a year, but each can yield significant gains.
3. Positional Trading Strategies
Trend Following (Long-Term):
Ride major uptrends or downtrends.
Example: Buying IT sector stocks in a technology boom.
Breakout Investing:
Enter long-term positions after a significant resistance level or consolidation phase breaks.
Sector Rotation:
Identify which sectors are gaining strength due to macroeconomic cycles and shift positions accordingly.
Fundamentals-Driven Trades:
Rely heavily on earnings growth, industry trends, and valuation metrics (P/E, P/B).
4. Tools & Indicators for Positional Trading
Weekly & Monthly Charts: Identify big trends.
200-Day Moving Average: Long-term trend filter.
Fibonacci Retracement: Long-term correction levels.
Fundamental Metrics: EPS growth, ROE, balance sheet health, macro trends.
5. Advantages of Positional Trading
Captures big, multi-month moves.
Less time-intensive than swing or intraday trading.
Fewer trades → lower transaction costs.
Leverages the power of fundamentals + technicals.
6. Risks and Challenges
Exposure to systematic risks (interest rates, recessions, geopolitical tensions).
Requires patience and high conviction.
Market may remain sideways for long periods.
Larger stop-loss levels are needed, which increases capital at risk.
Psychology of Trading
Both swing and positional trading demand psychological discipline.
Swing Traders need quick decision-making, adaptability, and resilience against short-term noise. They must accept small, frequent losses.
Positional Traders need patience, conviction, and emotional control to sit through corrections and volatility without panic.
Key psychological skills:
Managing FOMO (Fear of Missing Out).
Sticking to stop-loss and targets.
Avoiding overtrading.
Maintaining realistic expectations.
Conclusion
Swing trading and positional trading both provide excellent opportunities for traders who cannot commit to intraday activity but still want to actively participate in markets.
Swing trading is ideal for those who want faster results and enjoy analyzing short-term price movements.
Positional trading suits those who are patient, capital-rich, and willing to ride big trends for significant gains.
The best approach depends on your personality, risk appetite, time availability, and goals. Some traders even combine both: using swing trades for short-term cash flow while holding positional trades for wealth creation.
Ultimately, success lies in discipline, consistency, and adapting strategies as markets evolve.

Bond & Fixed Income Trading1. Understanding Bonds and Fixed Income Instruments
1.1 What is a Bond?
A bond is a debt security issued by an entity to raise capital. When you buy a bond, you are lending money to the issuer in exchange for:
Coupon Payments: Fixed or floating interest paid periodically (semiannual, annual, or quarterly).
Principal Repayment: The face value (par value) paid back at maturity.
Example: A government issues a 10-year bond with a face value of $1,000 and a coupon rate of 5%. Investors will receive $50 annually for 10 years, and then $1,000 back at maturity.
1.2 Key Features of Bonds
Issuer: Government, municipality, or corporation.
Maturity: The time until the bondholder is repaid (short-term, medium-term, or long-term).
Coupon Rate: Interest rate, which can be fixed or floating.
Yield: Effective return on the bond based on price, coupon, and time to maturity.
Credit Rating: Issuer’s creditworthiness (AAA to junk).
1.3 Types of Fixed Income Securities
Government Bonds – Issued by national governments (e.g., U.S. Treasuries, Indian G-Secs).
Municipal Bonds – Issued by states or local governments.
Corporate Bonds – Issued by companies to finance projects or operations.
Zero-Coupon Bonds – Sold at discount, pay no interest, only face value at maturity.
Floating Rate Bonds – Coupons tied to a benchmark (like LIBOR, SOFR, or repo rate).
Inflation-Linked Bonds – Adjust coupons or principal with inflation (e.g., U.S. TIPS).
High-Yield (Junk) Bonds – Higher risk, lower credit quality, higher yields.
Convertible Bonds – Can be converted into equity shares.
Sovereign Bonds (Global) – Issued by foreign governments, sometimes in hard currencies like USD or EUR.
2. The Bond Market Structure
2.1 Primary Market
Issuers sell new bonds directly to investors through auctions, syndications, or private placements.
Governments usually conduct auctions.
Corporates issue via investment banks underwriting the debt.
2.2 Secondary Market
Once issued, bonds are traded among investors. Unlike stocks, most bond trading occurs over-the-counter (OTC) rather than centralized exchanges. Dealers, brokers, and electronic platforms facilitate these trades.
2.3 Market Participants
Issuers: Governments, municipalities, corporations.
Investors: Retail investors, pension funds, mutual funds, hedge funds, insurance companies.
Dealers & Brokers: Market makers providing liquidity.
Credit Rating Agencies: Provide credit ratings (Moody’s, S&P, Fitch).
Regulators: Ensure transparency (e.g., SEC in the U.S., SEBI in India).
3. Bond Pricing and Valuation
Bond trading revolves around pricing and yield analysis.
3.1 Bond Pricing Formula
Price = Present Value of Coupons + Present Value of Principal
The discount rate used is based on prevailing interest rates and risk premium.
3.2 Yield Measures
Current Yield = Annual Coupon / Current Price
Yield to Maturity (YTM): Return if bond held till maturity.
Yield to Call (YTC): Return if bond is called before maturity.
Yield Spread: Difference in yields between two bonds (e.g., corporate vs government).
3.3 Inverse Relationship between Price & Yield
When interest rates rise, bond prices fall (yields go up).
When interest rates fall, bond prices rise (yields go down).
This fundamental rule drives trading opportunities.
4. Strategies in Bond & Fixed Income Trading
4.1 Passive Strategies
Buy and Hold: Investors hold bonds until maturity for predictable returns.
Laddering: Staggering maturities to manage reinvestment risk.
Barbell Strategy: Combining short- and long-term bonds.
4.2 Active Strategies
Yield Curve Trading: Betting on changes in the shape of the yield curve (steepening, flattening).
Duration Management: Adjusting portfolio sensitivity to interest rates.
Credit Spread Trading: Exploiting differences between government and corporate yields.
Relative Value Trading: Arbitrage between similar bonds mispriced in the market.
Event-Driven Trading: Taking positions before/after policy changes, credit rating upgrades/downgrades.
4.3 Advanced Strategies
Bond Futures & Options: Derivatives to hedge or speculate.
Credit Default Swaps (CDS): Insurance against default, tradable contracts.
Interest Rate Swaps: Exchanging fixed-rate payments for floating-rate ones.
5. Risks in Bond & Fixed Income Trading
Interest Rate Risk: Prices fall when rates rise.
Credit Risk: Issuer defaults on payments.
Reinvestment Risk: Coupons may have to be reinvested at lower rates.
Liquidity Risk: Some bonds are hard to trade.
Inflation Risk: Rising inflation erodes real returns.
Currency Risk: For foreign bonds, exchange rate volatility matters.
Call & Prepayment Risk: Issuer may redeem bonds early when rates drop.
6. The Role of Central Banks and Monetary Policy
Bond markets are deeply tied to monetary policy:
Central banks control benchmark interest rates.
Through open market operations (OMO), they buy/sell government securities to regulate liquidity.
Quantitative easing (QE): Large-scale bond buying lowers yields.
Tightening cycles: Selling bonds or raising rates pushes yields higher.
Bond traders watch central bank meetings (like U.S. Fed, ECB, RBI) closely since even minor shifts in policy guidance can move bond yields globally.
7. Global Bond Markets
7.1 U.S. Treasury Market
The largest, most liquid bond market globally. Treasuries are considered the world’s risk-free benchmark.
7.2 European Bond Market
Includes German Bunds (safe-haven) and bonds from Italy, Spain, Greece (riskier spreads).
7.3 Asian Markets
Japan’s Government Bonds (JGBs) dominate, often with near-zero or negative yields.
India’s G-Sec market is growing rapidly, with RBI auctions being a key driver.
7.4 Emerging Markets
Sovereign bonds from Brazil, Turkey, South Africa, etc. These offer higher yields but come with higher risk.
8. Technology & Evolution of Fixed Income Trading
Electronic Trading Platforms (MarketAxess, Tradeweb, Bloomberg) are transforming bond markets from dealer-driven to electronic order books.
Algorithmic Trading & AI help in pricing, liquidity detection, and risk management.
Blockchain & Tokenization are being explored for faster settlement and transparency.
9. Case Studies
Case 1: 2008 Financial Crisis
The crisis originated partly from securitized debt instruments (mortgage-backed securities). Credit risk was underestimated, and defaults triggered global turmoil.
Case 2: COVID-19 Pandemic (2020)
Global bond yields crashed as investors rushed into safe-haven Treasuries. Central banks intervened with QE programs, leading to record low yields.
Case 3: Inflation Surge (2021–2023)
Bond yields spiked worldwide as central banks aggressively hiked rates to control inflation. Bond traders faced sharp volatility, especially in long-duration bonds.
10. Why Investors Trade Bonds
Stability & Income: Bonds provide predictable interest income.
Diversification: Balances equity-heavy portfolios.
Safe-Haven: Government bonds perform well in crises.
Speculation: Traders bet on interest rate moves and credit spreads.
Hedging: Bonds hedge against stock market volatility.
11. Future of Bond & Fixed Income Trading
Sustainable Bonds: Green bonds and ESG-linked instruments are growing.
Digital Transformation: Greater adoption of electronic trading and blockchain settlement.
Integration with Global Policies: Climate financing, infrastructure projects.
AI-Powered Analytics: Predictive modeling for yield curve and credit spreads.
Retail Participation: Platforms are increasingly making bonds accessible to individuals.
Conclusion
Bond and fixed income trading is a cornerstone of global finance, connecting governments, corporations, and investors. Unlike equities, where growth and dividends are uncertain, bonds promise fixed cash flows, making them critical for conservative investors as well as aggressive traders.
The dynamics of interest rates, credit risk, monetary policy, and macroeconomics make the bond market both a stabilizer and a source of opportunity. With rapid technological change and growing investor demand for stability, the fixed income market will continue to expand and evolve.
Ultimately, successful bond trading requires deep understanding of interest rate cycles, credit analysis, and market structure, along with disciplined risk management.

Option Trading How Options are Priced
One of the trickiest aspects of options is pricing. Unlike stocks (where price is direct), option prices are influenced by multiple variables.
Components of Option Pricing
Intrinsic Value – The real value if exercised today.
Call = Spot Price – Strike Price
Put = Strike Price – Spot Price
Time Value – Extra premium traders pay for the possibility that the option may gain value before expiry.
The Greeks
Options traders rely on “Greeks” to understand how different factors impact prices:
Delta: Sensitivity to price changes of underlying.
Gamma: Rate of change of Delta.
Theta: Time decay of the option’s value.
Vega: Sensitivity to volatility changes.
Rho: Sensitivity to interest rates.
Volatility
Volatility plays a huge role. Higher volatility = higher premiums. There are two types:
Historical Volatility – Past market movement.
Implied Volatility (IV) – Market’s expectation of future volatility.
Black-Scholes Model
Developed in 1973, it uses mathematical formulas to calculate fair value of options considering spot price, strike price, time to expiry, volatility, and interest rates.

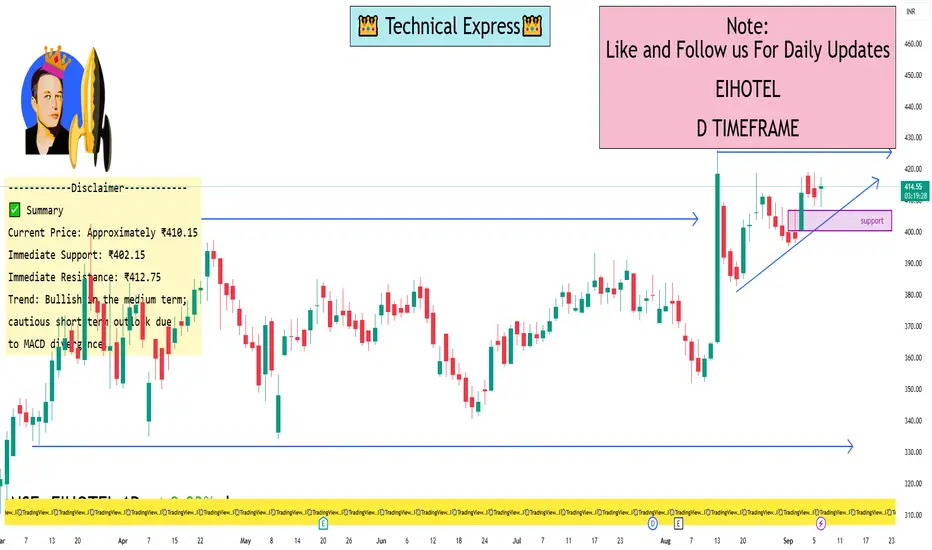
EIHOTEL 1 Day View📈 Daily Support & Resistance Levels
Based on recent data, here are the critical levels:
Support Levels:
S1: ₹402.15
S2: ₹396.05
S3: ₹388.93
Resistance Levels:
R1: ₹412.75
R2: ₹417.25
R3: ₹423.35
These levels are derived from standard pivot point calculations and provide insight into potential price reversal zones.
🔍 Technical Indicators Overview
RSI (14-day): 55.79 – Neutral, indicating neither overbought nor oversold conditions.
MACD: 7.41 – Suggests a bearish trend, as the MACD line is above the signal line.
Moving Averages:
5-day EMA: ₹399.37 – Slightly below the current price, indicating a short-term bearish trend.
20-day EMA: ₹391.96 – Above the current price, suggesting medium-term bullish momentum.
50-day EMA: ₹381.97 – Above the current price, reinforcing the medium-term bullish outlook.
🧭 Trend Analysis
The stock is trading above its 20-day and 50-day EMAs, which typically indicates a bullish trend. However, the MACD suggests a potential short-term bearish phase. Traders should monitor the support and resistance levels closely for potential breakout or breakdown opportunities.
Risk Management & Position Sizing1. Introduction
Trading and investing are not just about finding opportunities; they are about surviving long enough to capitalize on those opportunities. Many traders focus solely on strategies, indicators, or news but fail to recognize that risk management and position sizing are the backbone of long-term success.
It doesn’t matter if you have the best strategy in the world—without proper risk control, even a few bad trades can wipe out your account. On the other hand, a mediocre strategy with strict risk management can still keep you profitable over time.
Risk management is about protecting capital, while position sizing is about optimizing growth while keeping risks tolerable. Together, they determine not just whether you survive in the markets but whether you thrive.
2. Understanding Risk in Trading
Before diving into methods, let’s define risk:
Risk is the probability of losing part or all of your investment due to adverse price movements or unforeseen events.
Types of Risk
Market Risk – Prices move against you due to volatility, trends, or sudden news.
Credit Risk – Counterparty default risk (important in derivatives, bonds, and broker dealings).
Liquidity Risk – Inability to exit a position at desired prices due to thin volume.
Operational Risk – Failures in trading platforms, execution errors, or broker malfunctions.
Psychological Risk – Emotional decisions driven by fear, greed, or impatience.
Why Risk Management is Vital
Preserves trading capital to stay in the game.
Reduces emotional stress and impulsive decisions.
Helps achieve consistency in returns.
Shields from black swan events like 2008 crisis or COVID-19 crash.
3. Core Principles of Risk Management
3.1 Preservation of Capital
Your first goal isn’t to make money—it’s to avoid losing money unnecessarily. Even legendary traders say: “Take care of the downside, the upside will take care of itself.”
3.2 Risk vs. Reward
Every trade has a risk/reward ratio. If you risk ₹1,000 and aim to make ₹3,000, your ratio is 1:3. Good traders avoid trades with poor ratios like 2:1 risk/reward in their favor.
3.3 Probability & Expectancy
Trading is a game of probabilities.
Win rate × average win – (loss rate × average loss) = expectancy.
Positive expectancy ensures long-term profitability.
3.4 Diversification
Don’t put all eggs in one basket. Spread risk across assets, sectors, and strategies to reduce portfolio volatility.
4. Position Sizing Explained
What is Position Sizing?
Position sizing is deciding how much capital to allocate to a trade. Too small, and profits don’t matter; too large, and losses can be fatal.
Fixed Lot vs. Variable Lot
Fixed lot: Always trade the same number of shares/contracts.
Variable lot: Adjust size based on risk percentage, volatility, or account growth.
Position Sizing Models
Fixed Dollar Model – Risking a fixed cash amount (e.g., ₹10,000 per trade).
Fixed Percentage Risk Model – Risking 1–2% of account per trade (most popular).
Volatility-Based Model – Larger positions in stable assets, smaller in volatile ones.
Kelly Criterion – Mathematical formula to maximize growth while avoiding ruin.
5. Techniques of Risk Management in Practice
5.1 Stop-Loss Strategies
A stop-loss is a pre-set exit to limit losses.
Percentage Stop: Exit if loss exceeds 2% of capital.
Volatility Stop: Use ATR (Average True Range) to set dynamic stops.
Chart Stop: Place below support or above resistance.
5.2 Trailing Stops
Move stop-loss as trade moves in your favor—locking in profits while letting winners run.
5.3 Hedging
Use derivatives (options/futures) to protect against downside risk. Example: Buy a put to protect long equity.
5.4 Risk/Reward Ratios
Always look for trades where potential reward is at least 2–3x the risk.
6. The Psychology of Risk Management
Fear: Causes premature exits.
Greed: Leads to oversized positions.
Overconfidence: Makes traders ignore risk rules.
Impatience: Pushes traders into random trades.
Discipline, emotional control, and sticking to rules are as important as technical skills.
7. Position Sizing Strategies in Detail
Stocks
Use 2% rule: Never risk more than 2% of capital on a single stock.
Diversify across industries.
Forex
Calculate pip value and lot size using risk per trade.
Adjust for leverage; avoid risking more than 1%–2% of account per trade.
Futures & Options
Higher leverage = higher risk.
Use margin calculations and hedge positions with spreads.
Crypto
Extremely volatile.
Use smaller positions and wider stops.
Only risk what you can afford to lose.
8. Risk Management in Different Trading Styles
Day Trading
Use tight stops and small risk (0.5%–1%).
Trade frequently but with discipline.
Swing Trading
Moderate position sizes.
Wider stops, risk around 1%–2% per trade.
Position Trading
Long-term view, smaller number of trades.
Can risk slightly higher (up to 3%) but diversify more.
Scalping
Extremely small risks (0.1%–0.5%).
High frequency requires strict discipline.
9. Common Mistakes in Risk Management
Risking too much capital in one trade.
Ignoring correlation (e.g., buying multiple tech stocks all exposed to same risk).
Over-leveraging.
Moving stop-loss further away instead of accepting loss.
Trading without a written plan.
10. Building a Personal Risk Management Plan
Define Risk Tolerance – How much are you comfortable losing?
Capital Allocation Rules – Max % per trade, per sector, per asset.
Position Sizing Method – Choose fixed % or volatility-based.
Stop-Loss & Exit Rules – Define before entering trade.
Review & Journal – Track results and refine rules.
Conclusion
Risk management and position sizing are not optional—they are mandatory survival tools. While strategies and market analysis help find opportunities, only proper risk control ensures long-term consistency and growth.
The most successful traders are not the ones with the highest returns, but those who stay in the market longest with steady risk-adjusted growth.
Remember:
Preserve capital first.
Risk small, grow steady.
Size positions wisely.
That’s the ultimate formula for success in trading.
Technical Analysis Foundations1. Historical Background of Technical Analysis
Early Origins
Japanese Rice Trading (1700s): Candlestick charting was developed by Munehisa Homma, a rice trader, who discovered that market psychology and patterns could predict future prices.
Charles Dow (Late 1800s): Considered the father of modern technical analysis, Dow developed the Dow Theory, which laid the groundwork for trend analysis.
Evolution in the 20th Century
With the rise of stock exchanges in the U.S. and Europe, charting methods gained popularity.
The creation of indicators like Moving Averages, RSI, MACD, and Bollinger Bands in the mid-20th century expanded the technical toolkit.
Modern Era
Today, technical analysis is powered by computers, algorithms, and AI-based models.
Despite these advances, the core principle remains the same: history tends to repeat itself in markets.
2. Core Principles of Technical Analysis
Technical analysis is built on three central assumptions:
Price Discounts Everything
Every factor—economic, political, psychological—is already reflected in price.
Traders don’t need to analyze external events; studying price is enough.
Prices Move in Trends
Markets don’t move randomly. Instead, they form trends—uptrend, downtrend, or sideways.
Identifying and following the trend is the foundation of profitable trading.
History Repeats Itself
Human behavior in markets tends to repeat due to psychology (fear, greed, hope).
Chart patterns like Head & Shoulders or Double Tops repeat because investor reactions are consistent over time.
3. Types of Charts
Charts are the backbone of technical analysis. The three most commonly used chart types are:
1. Line Chart
Simplest chart, connecting closing prices with a line.
Best for long-term trend analysis.
2. Bar Chart
Displays open, high, low, and close (OHLC) in each bar.
Provides more detail than line charts.
3. Candlestick Chart
Invented in Japan, now the most popular.
Each candlestick shows open, high, low, and close with a body and wicks.
Offers visual insight into market psychology (bullish vs. bearish sentiment).
4. Understanding Market Structure
1. Trends
Uptrend: Higher highs and higher lows.
Downtrend: Lower highs and lower lows.
Sideways: Price consolidates within a range.
2. Support and Resistance
Support: Price level where buying pressure overcomes selling.
Resistance: Price level where selling pressure overcomes buying.
Key to identifying entry and exit points.
3. Breakouts and Pullbacks
Breakout: Price moves beyond support or resistance with strong volume.
Pullback: Temporary retracement before the trend resumes.
5. Technical Indicators
Indicators are mathematical calculations applied to price or volume data. They are divided into two main types:
1. Trend Indicators
Moving Averages (SMA, EMA): Smooth price data to identify trend direction.
MACD (Moving Average Convergence Divergence): Measures momentum and trend strength.
2. Momentum Indicators
RSI (Relative Strength Index): Identifies overbought (>70) or oversold (<30) conditions.
Stochastic Oscillator: Compares closing price to recent highs/lows.
3. Volatility Indicators
Bollinger Bands: Show price volatility around a moving average.
ATR (Average True Range): Measures market volatility.
4. Volume Indicators
OBV (On Balance Volume): Tracks cumulative buying/selling pressure.
Volume Profile: Highlights price levels where significant trading occurred.
6. Chart Patterns
Patterns represent the psychology of market participants. They are broadly classified into continuation and reversal patterns.
1. Reversal Patterns
Head and Shoulders: Signals a trend reversal from bullish to bearish.
Double Top/Bottom: Indicates a change in trend after testing a key level twice.
2. Continuation Patterns
Flags and Pennants: Short-term consolidations within a strong trend.
Triangles (Symmetrical, Ascending, Descending): Signal breakout in the direction of trend.
3. Candlestick Patterns
Doji: Market indecision.
Hammer / Shooting Star: Potential reversal signals.
Engulfing Patterns: Strong reversal signals based on candlestick body size.
7. Volume and Market Confirmation
Volume is a critical element in technical analysis:
Rising volume confirms the strength of a trend.
Low volume during a breakout may signal a false move.
Divergence between price and volume often hints at a reversal.
8. Timeframes in Technical Analysis
Intraday (1-min, 5-min, 15-min): For day traders and scalpers.
Swing (Hourly, 4H, Daily): For medium-term traders.
Position (Weekly, Monthly): For long-term investors.
The principle of Multiple Time Frame Analysis is key: Traders often analyze higher timeframes for trend direction and lower timeframes for precise entries.
9. Market Psychology and Sentiment
Technical analysis is rooted in psychology:
Fear and Greed: Drive most market movements.
Herd Behavior: Traders follow crowds, amplifying trends.
Overconfidence: Leads to bubbles and crashes.
Sentiment indicators like VIX (Volatility Index) or Put/Call ratios are often used to gauge market mood.
10. Risk Management in Technical Analysis
No strategy works without risk control. Key principles:
Position Sizing: Risk only 1–2% of capital per trade.
Stop Loss: Predetermine exit levels to minimize loss.
Risk-Reward Ratio: Aim for trades with at least 1:2 risk-reward.
Conclusion
Technical analysis is both an art and a science. It blends mathematical tools with human psychology to understand market behavior. While it has limitations, its principles of trend, support/resistance, and pattern recognition remain timeless.
For beginners, mastering chart basics, support/resistance, and risk management is the starting point. For advanced traders, integrating multiple indicators, refining strategies, and incorporating psychology make the difference.
Ultimately, technical analysis is not about predicting the future with certainty—it’s about increasing probabilities and managing risk. With discipline and practice, it becomes a powerful tool for navigating financial markets.

Psychology of Trading1. Introduction: Why Psychology Matters in Trading
Trading is not just about buying low and selling high. It is about making decisions under uncertainty, managing risk, and dealing with constant emotional swings. Unlike traditional jobs where performance is based on effort and skills, trading has an unpredictable outcome in the short term.
You can make a perfect trade setup and still lose money.
You can make a terrible decision and accidentally profit.
This uncertainty creates emotional pressure, leading traders to make irrational decisions. For example:
Selling too early out of fear.
Holding on to losing trades hoping for a reversal.
Over-trading after a big win or loss.
Without strong psychological control, traders often repeat these mistakes. That is why understanding and mastering trading psychology is the real secret to consistent success.
2. Core Emotions in Trading
Emotions are natural, but when unmanaged, they distort judgment. Let’s break down the four main emotions every trader faces:
(a) Fear
Fear is the most common emotion in trading. It shows up in two forms:
Fear of Losing Money – leading to hesitation, missed opportunities, or premature exits.
Fear of Missing Out (FOMO) – jumping into trades too late because others are making money.
Example: A trader sees a stock rallying rapidly and buys at the top out of FOMO. When the price corrects, fear of loss makes them sell at the bottom – a classic cycle.
(b) Greed
Greed pushes traders to take excessive risks, over-leverage, or hold winning positions too long. Instead of following a plan, they chase “unlimited” profits.
Example: A trader who plans for 5% profit refuses to book at target, hoping for 10%. The market reverses, and the profit turns into a loss.
(c) Hope
Hope is dangerous in trading. While hope is positive in life, in markets it blinds traders from reality. Hope makes people hold on to losing trades, ignoring stop-losses, and believing “it will come back.”
Example: A trader buys a stock at ₹500, it falls to ₹450, then ₹400. Instead of cutting losses, the trader “hopes” for recovery and keeps averaging down, often leading to bigger losses.
(d) Regret
Regret comes after missed opportunities or wrong trades. Regret often leads to revenge trading, where traders try to quickly recover losses, usually resulting in even bigger losses.
3. Cognitive Biases in Trading
Apart from emotions, psychology is also influenced by cognitive biases – mental shortcuts that distort rational thinking.
Overconfidence Bias – Believing your strategy is always right after a few wins, leading to careless trading.
Confirmation Bias – Only looking for information that supports your view, ignoring opposite signals.
Loss Aversion – The pain of losing ₹1000 is stronger than the joy of gaining ₹1000. This makes traders hold losers and sell winners too soon.
Anchoring Bias – Relying too heavily on the first price seen, e.g., thinking “I bought at ₹600, so it must go back to ₹600.”
Herd Mentality – Following the crowd without analysis, especially during hype rallies or crashes.
These biases prevent traders from making objective decisions.
4. Mindset of a Successful Trader
Successful traders think differently from beginners. Their mindset is built on discipline, patience, and acceptance of uncertainty. Key elements include:
Process Over Outcome: Focusing on following rules, not immediate profit.
Acceptance of Losses: Treating losses as part of the business, not as personal failure.
Probabilistic Thinking: Understanding that no trade is 100% certain; trading is about probabilities.
Long-Term Focus: Avoiding the need for daily wins, instead building consistent performance over months/years.
Emotional Detachment: Viewing money as “trading capital,” not personal wealth.
5. The Role of Discipline
Discipline is the backbone of trading psychology. Without discipline, even the best strategies fail. Discipline involves:
Following a Trading Plan – entry, exit, stop-loss, risk-reward.
Position Sizing – never risking more than 1-2% of capital on a single trade.
Consistency – sticking to strategy instead of changing methods after every loss.
Patience – waiting for the right setup instead of forcing trades.
Most traders fail not because of bad strategies but because they lack the discipline to follow their strategies.
6. Psychological Challenges in Different Trading Styles
(a) Day Trading
Constant pressure, quick decisions.
High temptation to over-trade.
Emotional exhaustion.
(b) Swing Trading
Requires patience to hold trades for days/weeks.
Fear of overnight risks (gaps, news).
Temptation to check charts every hour.
(c) Long-Term Investing
Emotional difficulty in holding through corrections.
Pressure from news and market noise.
Fear of missing short-term opportunities.
Each style demands a different level of emotional control.
7. Developing Emotional Intelligence for Trading
Emotional Intelligence (EQ) is the ability to understand and manage your emotions. Traders with high EQ can:
Recognize when fear/greed is influencing them.
Pause before reacting emotionally.
Maintain objectivity under stress.
Ways to improve EQ in trading:
Journaling – Writing down emotions and mistakes after each trade.
Mindfulness & Meditation – Helps calm the mind and reduce impulsive decisions.
Detachment from Money – Viewing trades as probabilities, not personal wins/losses.
Visualization – Mentally preparing for both winning and losing scenarios.
8. Risk Management & Psychology
Risk management is not just technical – it is psychological. A trader who risks too much per trade is more likely to panic.
Risk per trade: Max 1–2% of capital.
Use stop-loss orders to remove emotional decision-making.
Diversify to avoid stress from a single bad trade.
When risk is controlled, emotions naturally reduce.
9. Common Psychological Mistakes Traders Make
Overtrading – Trading too often due to excitement or frustration.
Ignoring Stop-Losses – Driven by hope and denial.
Chasing the Market – Entering late due to FOMO.
Revenge Trading – Trying to recover losses aggressively.
Lack of Patience – Jumping in before confirmation.
Ego Trading – Refusing to accept mistakes, trying to “prove the market wrong.”
10. Building Psychological Strength
Practical steps to master trading psychology:
Create a Trading Plan – Define entry, exit, stop-loss, risk-reward.
Keep a Trading Journal – Record reasons, outcomes, and emotions of each trade.
Use Small Position Sizes – Reduce stress by lowering risk.
Practice Visualization – Prepare for losses before they happen.
Regular Breaks – Step away from screens to avoid emotional burnout.
Focus on Process, Not Profit – Judge yourself by discipline, not daily P&L.
Accept Imperfection – No trader wins all trades; consistency matters more than perfection.
Final Thoughts
The psychology of trading is the bridge between knowledge and execution. Thousands of traders know strategies, but only a few succeed because they master their emotions.
To succeed in trading:
Build discipline like a soldier.
Accept uncertainty like a scientist.
Control emotions like a monk.
In short: Trading is less about predicting markets and more about controlling yourself.