Basics of Financial Markets1. What are Financial Markets?
A financial market is a marketplace where financial instruments are created, bought, and sold. Unlike physical markets where goods are exchanged, financial markets deal with monetary assets, securities, and derivatives.
Key Characteristics:
Medium of Exchange – Instead of physical goods, money, credit, or securities are exchanged.
Standardized Instruments – Financial contracts such as stocks or bonds are standardized and legally binding.
Liquidity – Markets allow participants to buy or sell instruments quickly without drastically affecting prices.
Transparency – Prices and information are accessible, which reduces uncertainty.
Regulation – Most markets are regulated to ensure fairness, prevent fraud, and protect investors.
2. Why Do Financial Markets Exist?
The need for financial markets arises because of the following:
Capital Allocation – They help direct savings to businesses and governments that need funds.
Price Discovery – Markets determine the fair value of financial instruments through supply and demand.
Liquidity Provision – Investors can easily enter or exit positions.
Risk Management – Derivative markets allow participants to hedge against risks like currency fluctuations, interest rates, or commodity prices.
Efficient Resource Use – They reduce transaction costs and make capital flow more efficient across the economy.
3. Types of Financial Markets
Financial markets are broadly classified into several categories:
(a) Capital Market
Capital markets deal with long-term securities such as stocks and bonds. They are subdivided into:
Primary Market – Where new securities are issued (e.g., IPOs).
Secondary Market – Where existing securities are traded among investors (e.g., stock exchanges).
(b) Money Market
This is the market for short-term funds, usually less than one year. Instruments include:
Treasury bills
Commercial paper
Certificates of deposit
Repurchase agreements
Money markets are crucial for liquidity management by banks, companies, and governments.
(c) Foreign Exchange Market (Forex)
The largest and most liquid market in the world, where currencies are traded. Daily turnover exceeds $7 trillion globally. Forex enables:
International trade settlement
Speculation
Hedging currency risks
(d) Derivatives Market
These markets trade instruments that derive their value from underlying assets like stocks, bonds, commodities, or indices. Key instruments include:
Futures
Options
Swaps
Forwards
(e) Commodity Market
These markets allow the trade of raw materials such as oil, gold, silver, coffee, wheat, and natural gas. They play a vital role in price discovery and hedging for producers and consumers.
(f) Insurance and Pension Markets
Though sometimes overlooked, insurance and pension funds form part of financial markets as they pool resources and invest in capital markets to provide long-term returns.
4. Major Participants in Financial Markets
(a) Individual Investors
Ordinary people investing in stocks, bonds, mutual funds, or retirement accounts.
(b) Institutional Investors
Pension funds
Hedge funds
Insurance companies
Mutual funds
They often have large capital and dominate trading volumes.
(c) Corporations
Issue stocks and bonds to raise capital for growth and expansion.
(d) Governments
Issue treasury securities to finance deficits and manage national debt.
(e) Central Banks
Influence interest rates, liquidity, and currency stability. For example, the Federal Reserve (US) or RBI (India).
(f) Brokers and Dealers
Middlemen who facilitate transactions.
(g) Regulators
Organizations like SEBI (India), SEC (US), or FCA (UK) ensure fair practices, transparency, and investor protection.
5. Financial Instruments
Financial instruments are contracts that represent monetary value. Broadly divided into:
(a) Equity Instruments
Shares or stocks represent ownership in a company.
Provide dividends and capital appreciation.
(b) Debt Instruments
Bonds, debentures, or loans represent borrowing.
Fixed income with lower risk compared to equities.
(c) Hybrid Instruments
Convertible bonds
Preference shares (mix of equity and debt features)
(d) Derivatives
Contracts like futures and options used for speculation or hedging.
(e) Foreign Exchange Instruments
Spot transactions, forwards, swaps.
6. Functions of Financial Markets
Mobilization of Savings – Channels savings into investments.
Efficient Allocation of Resources – Ensures capital flows where it is most productive.
Liquidity Creation – Enables quick conversion of assets to cash.
Price Discovery – Determines fair asset prices.
Risk Management – Through diversification and hedging.
Economic Growth Support – Facilitates industrial expansion and infrastructure building.
7. Primary vs. Secondary Market
Primary Market
New securities are issued.
Example: An IPO of a company.
Investors buy directly from the issuer.
Secondary Market
Existing securities are traded among investors.
Example: Buying shares of TCS on NSE.
Prices are driven by demand and supply.
Both markets are essential – the primary market raises fresh funds, while the secondary market ensures liquidity.
8. Global Financial Markets
Financial markets today are interconnected. Events in one region impact others through global capital flows.
US markets (NYSE, NASDAQ) dominate equity trading.
London is a hub for forex trading.
Asia (Tokyo, Shanghai, Hong Kong, Singapore, Mumbai) is rising as a global financial powerhouse.
Globalization and technology have made markets operate 24/7, with information spreading instantly.
9. Role of Technology in Financial Markets
Technology has revolutionized finance:
Online trading platforms allow individuals to trade from anywhere.
Algo & High-Frequency Trading execute orders in microseconds.
Blockchain & Cryptocurrencies (Bitcoin, Ethereum) are creating new asset classes.
Fintech Innovations like robo-advisors, digital wallets, and payment banks are reshaping finance.
10. Risks in Financial Markets
Despite benefits, markets involve risks:
Market Risk – Loss due to price movements.
Credit Risk – Default by borrowers.
Liquidity Risk – Inability to sell assets quickly.
Operational Risk – Failures in processes, systems, or fraud.
Systemic Risk – Collapse of one institution affecting the entire system (e.g., 2008 crisis).
Conclusion
Financial markets are complex yet fascinating ecosystems that drive global economic growth. They connect savers with borrowers, facilitate price discovery, provide liquidity, and enable risk management. For individuals, they offer opportunities to grow wealth, while for nations, they are vital for development and stability.
Understanding the basics of financial markets is not just about investing—it’s about grasping how economies function in a globalized, interconnected world. With technological advancements and evolving regulations, financial markets will continue to transform, creating both opportunities and challenges for future generations.
ICICIBANK

Part 7 Trading Masterclass With ExpertsMistakes Beginners Make
Ignoring Time Decay: Many beginners buy out-of-the-money options and lose money as they expire worthless.
Over-Leverage: Betting too much on one trade.
Lack of Exit Plan: Holding options till expiry without managing risk.
Not Understanding Greeks: Greeks (Delta, Theta, Vega, Gamma) explain option movements.
Following Tips Blindly: Always research, don’t rely on random market tips.
The Greeks – A Beginner’s View
Delta: Measures sensitivity of option price to stock price changes.
Theta: Measures time decay.
Vega: Measures sensitivity to volatility.
Gamma: Measures change in delta.
While beginners don’t need to master Greeks immediately, having a basic awareness helps in making smarter trades.
Roadmap to Becoming a Skilled Options Trader
Start with Education: Learn basics before trading.
Paper Trade: Practice without real money.
Begin Small: Trade with limited capital.
Focus on Risk Management: Never risk more than 1–2% of your capital per trade.
Keep a Trading Journal: Record every trade, analyze mistakes.
Gradually Explore Strategies: Start with buying calls/puts, then move to spreads, covered calls, and advanced strategies.
Stay Updated: Market news, volatility, and earnings impact options heavily.

Part 2 Ride The Big MovesWhat Are Options?
The Definition
An option is a financial contract that gives you the right, but not the obligation, to buy or sell an underlying asset (like a stock, index, or commodity) at a specific price within a specific time.
There are two main types of options:
Call Option – Gives the right to buy the asset at a fixed price (called the strike price).
Put Option – Gives the right to sell the asset at a fixed price.
Think of options like insurance policies. Just as you pay a premium for car insurance to protect against accidents, in options trading you pay a premium to gain control over an asset’s future without actually owning it upfront.
A Simple Example
Imagine you want to buy 100 shares of Reliance Industries at ₹2,500 per share, but you don’t want to spend ₹2,50,000 immediately. Instead, you buy a call option for ₹100 per share with a strike price of ₹2,500, expiring in one month.
If Reliance rises to ₹2,700, you can exercise your option and buy at ₹2,500, instantly profiting ₹200 per share (minus the premium).
If Reliance falls to ₹2,300, you don’t exercise. You only lose the premium you paid (₹100 per share).
This flexibility is the power of options.

Algo & Quant Trading in IndiaIntroduction
Financial markets worldwide have witnessed a paradigm shift in the last two decades. Traditional trading, which once relied heavily on manual execution, intuition, and gut feeling, has now given way to sophisticated, technology-driven strategies. In India, this transformation has been especially visible with the rise of Algorithmic (Algo) Trading and Quantitative (Quant) Trading.
Algo trading refers to the use of computer programs that follow a defined set of instructions (algorithms) to place trades automatically. Quant trading, on the other hand, is rooted in mathematical, statistical, and computational models to identify trading opportunities. While the two often overlap, quant strategies form the brain of the model, and algos are the execution engine.
In India, the growth of algo and quant trading is not just a reflection of global trends, but also a product of domestic factors like regulatory changes, increased market participation, rapid digitization, and the rise of fintech. From institutional investors to retail traders, the Indian market is undergoing a revolution that is reshaping how trading is executed.
Evolution of Algo & Quant Trading Globally and in India
Global Origins
Algorithmic trading traces its roots back to the 1970s and 1980s in the US and Europe when exchanges began offering electronic trading systems. By the late 1990s and early 2000s, hedge funds and investment banks began adopting quant-driven models for arbitrage, high-frequency trading (HFT), and risk management. Today, in developed markets, more than 70–80% of trades on exchanges are executed through algos.
Indian Journey
India’s journey began much later but has picked up speed rapidly:
2000 – NSE and BSE adopted electronic trading, paving the way for automation.
2008 – SEBI formally allowed algorithmic trading in India, mainly targeted at institutional traders.
2010–2015 – Introduction of co-location services by exchanges allowed brokers and institutions to place their servers closer to exchange data centers, reducing latency.
2016–2020 – With fintech growth and APIs provided by brokers like Zerodha, Upstox, and Angel One, algo trading reached the retail segment.
2020 onwards – Post-pandemic, massive digitization, cheaper data, and increased retail participation fueled the adoption of quant-based strategies among traders.
Today, algo and quant trading in India account for over 50% of daily turnover on NSE and BSE in derivatives and equities combined.
Understanding Algo Trading
Definition
Algo trading uses predefined rules based on time, price, volume, or mathematical models to execute trades automatically without human intervention.
Key Features
Speed: Orders are executed in milliseconds.
Accuracy: Eliminates human error in order placement.
Discipline: Removes emotional bias.
Backtesting: Strategies can be tested on historical data before going live.
Common Algo Strategies in India
Arbitrage Trading – Exploiting price differences across cash and derivatives or across different exchanges.
Market Making – Providing liquidity by quoting both buy and sell prices.
Trend Following – Using indicators like moving averages, MACD, and momentum.
Mean Reversion – Betting that prices will revert to their historical average.
Scalping / High-Frequency Trading – Very short-term strategies capturing micro-movements.
Execution Algorithms – VWAP (Volume Weighted Average Price), TWAP (Time Weighted Average Price) used by institutions to minimize market impact.
Understanding Quant Trading
Definition
Quant trading involves developing strategies based on quantitative analysis – mathematical models, statistical techniques, and computational algorithms.
Building Blocks of Quant Trading
Data – Price data, fundamental data, alternative data (news sentiment, social media, macro indicators).
Models – Predictive models like regression, machine learning algorithms, time-series analysis.
Risk Management – Position sizing, stop-loss rules, drawdown control.
Execution – Often implemented via algorithms to ensure efficiency.
Popular Quant Strategies in India
Statistical Arbitrage (pairs trading, cointegration).
Factor Investing (momentum, value, quality factors).
Machine Learning Models (neural networks, random forests for pattern detection).
Event-Driven Strategies (earnings announcements, macro data, corporate actions).
Regulatory Framework in India
Algo and quant trading in India operate under the supervision of SEBI (Securities and Exchange Board of India). Key guidelines include:
Direct Market Access (DMA): Institutional traders can place orders directly into exchange systems.
Co-location Facilities: Exchanges provide space near their servers to reduce latency for HFTs.
Risk Controls: SEBI mandates pre-trade risk checks (price band, order value, quantity limits).
Approval for Brokers: Brokers offering algos must get SEBI approval and ensure audits.
Retail Algo Trading (2022 draft): SEBI expressed concerns about unregulated retail algos offered via APIs. Regulations are evolving to protect small investors.
While SEBI encourages innovation, it is equally cautious about market stability and fairness.
Technology Infrastructure Behind Algo & Quant Trading
Essential Components
APIs (Application Programming Interfaces): Provided by brokers to allow programmatic order execution.
Low-Latency Networks: High-speed internet and co-location access for institutional players.
Programming Languages: Python, R, C++, and MATLAB dominate strategy development.
Databases & Cloud Computing: MongoDB, SQL, AWS, and Azure for storing and analyzing data.
Backtesting Platforms: Tools like Amibroker, MetaTrader, and broker-provided backtesters.
Rise of Retail Platforms in India
Zerodha’s Kite Connect API
Upstox API
Angel One SmartAPI
Algo platforms like Tradetron, Streak, AlgoTest
These platforms democratized algo and quant trading, allowing retail traders to build, test, and deploy strategies without deep coding knowledge.
Advantages of Algo & Quant Trading
Speed & Efficiency – Execution in microseconds.
No Human Emotions – Reduces fear, greed, or panic.
Scalability – Strategies can run across multiple stocks simultaneously.
Backtesting Capability – Historical simulations improve reliability.
Liquidity & Market Depth – Enhances overall efficiency of markets.
Challenges and Risks
Technology Costs: Infrastructure for serious HFT/quant models is expensive.
Regulatory Uncertainty: Retail algo rules are still evolving.
Market Risks: Backtested strategies may fail in live conditions.
Overfitting Models: Quant strategies may look perfect on paper but collapse in reality.
Operational Risks: Server downtime, internet issues, or software bugs can lead to losses.
The Rise of Retail Algo Traders in India
Traditionally, algo and quant trading were limited to large institutions, hedge funds, and prop trading firms. However, in India, retail adoption is rapidly increasing:
Young traders with coding skills are building custom strategies.
Platforms like Streak allow no-code algo building.
Social trading and strategy marketplaces let retail traders copy tested models.
This democratization is changing market dynamics, as retail algos now contribute significantly to volumes.
Role of Prop Trading Firms and Hedge Funds
Several proprietary trading firms and domestic hedge funds are aggressively building quant and algo strategies in India. These firms:
Employ mathematicians, statisticians, and programmers.
Focus on arbitrage, high-frequency, and statistical models.
Benefit from co-location and institutional-grade infrastructure.
Examples include Tower Research, Quadeye, iRage, and Dolat Capital.
Impact on Indian Markets
Higher Liquidity: Algo trading has improved depth and bid-ask spreads.
Reduced Costs: Institutional investors save on execution costs.
Efficient Price Discovery: Arbitrage strategies ensure fewer mispricings.
Volatility Concerns: Sudden algorithmic errors can lead to flash crashes.
Retail Empowerment: Access to professional-grade tools has leveled the playing field.
Future of Algo & Quant Trading in India
Artificial Intelligence & Machine Learning: AI-driven algos will dominate pattern recognition.
Alternative Data Usage: News analytics, social sentiment, and satellite data will gain importance.
Expansion to Commodities & Crypto: Once regulatory clarity improves, algo adoption will rise in these markets.
Wider Retail Participation: With APIs and fintech growth, retail algo adoption will skyrocket.
Regulatory Clarity: SEBI will formalize frameworks for retail algo safety.
Case Studies
Case Study 1: Arbitrage in Indian Equities
A quant firm builds a model exploiting price differences between NSE and BSE for highly liquid stocks like Reliance and HDFC Bank. The algo executes hundreds of trades daily, making small but consistent profits with low risk.
Case Study 2: Retail Trader Using Streak
A retail trader builds a moving average crossover strategy on Streak for Nifty options. Backtests show consistent profits, and the algo runs live with automated execution. While returns are smaller than HFT firms, it brings consistency and discipline to retail trading.
Conclusion
Algo and Quant trading in India are no longer niche activities reserved for a few elite institutions. They have become an integral part of the Indian financial ecosystem, transforming how markets function. The synergy of technology, regulation, and retail participation is reshaping trading culture.
While risks remain in terms of technology dependence and regulatory gaps, the benefits – efficiency, transparency, and democratization – far outweigh the challenges. The next decade will likely see India emerge as one of the fastest-growing hubs for algo and quant trading in Asia, supported by its large pool of engineers, coders, and financial talent.
Algo & Quant trading are not just the future of Indian markets – they are the present reality shaping every tick on the screen.

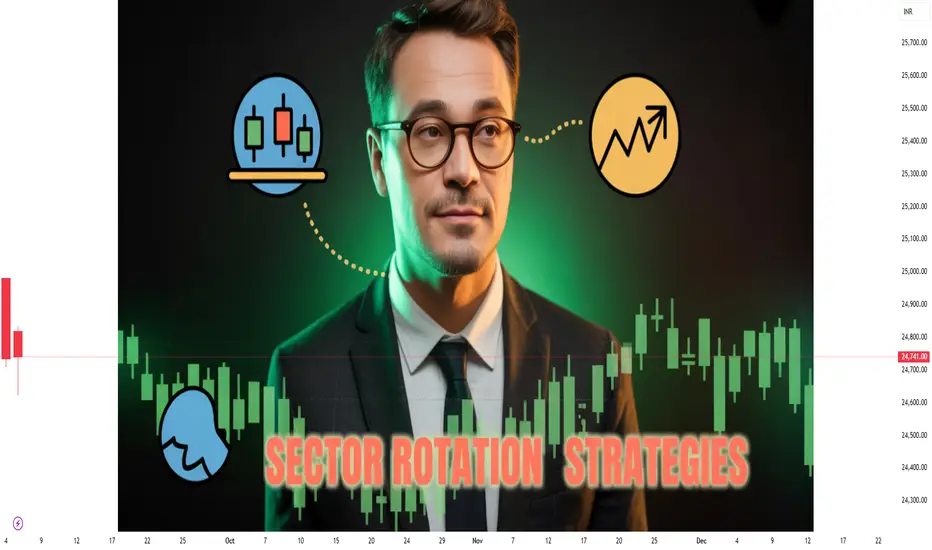
Sector Rotation in Indian MarketsIntroduction
The Indian stock market is one of the most vibrant, dynamic, and rapidly growing markets in the world. Over the last two decades, India has emerged as a global investment hub, attracting both domestic and foreign investors. Within this vast ecosystem, one concept plays a critical role in how investors allocate their money, time their entries and exits, and build long-term wealth: sector rotation.
Sector rotation refers to the process of shifting investments from one sector of the economy to another based on the economic cycle, market trends, and investor expectations. It is not just about identifying which stock will rise but about understanding which sectors will outperform at a given time. In the Indian context, where the economy is influenced by domestic consumption, global trade, commodity cycles, government policies, and demographic shifts, sector rotation becomes an essential strategy for smart investors.
This article will explore sector rotation in Indian markets in detail—its concept, drivers, historical examples, strategies, risks, and its growing relevance in today’s economy.
Understanding Sector Rotation
Sector rotation is based on the idea that different industries perform better during different phases of the economic cycle. For instance, when the economy is expanding, sectors like banking, infrastructure, and real estate often do well. Conversely, in times of slowdown or uncertainty, defensive sectors like pharmaceuticals, FMCG (Fast-Moving Consumer Goods), and utilities tend to outperform.
The economic cycle typically passes through four phases:
Expansion – Rising GDP growth, improving corporate profits, strong demand, and positive investor sentiment.
Peak – High growth but nearing saturation, inflationary pressures, and possible interest rate hikes.
Contraction – Slowing demand, declining profits, falling investment, and weaker market sentiment.
Trough/Recovery – Stabilization, government interventions, lower interest rates, and early signs of revival.
Each of these stages favors specific sectors. Understanding these shifts allows investors to rotate capital accordingly, capturing returns and reducing risks.
Why Sector Rotation Matters in India
India’s economy is unique compared to developed markets. It is domestically driven, powered largely by consumption, but also influenced by global commodity prices, exports, and foreign capital inflows. The following factors make sector rotation particularly important in India:
High Economic Growth Cycles
India has historically grown faster than most developed economies. This creates frequent sectoral shifts as new industries emerge and old ones adapt.
Policy-Driven Economy
Government policies (such as Make in India, PLI schemes, EV push, green energy initiatives) can rapidly change sector dynamics.
Demographics & Consumption
A young population and growing middle class make sectors like FMCG, retail, and technology highly cyclical and demand-driven.
Global Linkages
Export-heavy sectors like IT services, pharmaceuticals, and metals are influenced by global demand and currency movements, requiring careful rotation strategies.
Liquidity Flows
Foreign Institutional Investors (FIIs) and Domestic Institutional Investors (DIIs) often shift large sums between sectors, driving momentum.
Historical Sector Rotation in Indian Markets
Looking at India’s market history helps illustrate how sector rotation plays out in real time.
1. IT Boom (Late 1990s – Early 2000s)
Trigger: The rise of the internet and Y2K opportunities.
Beneficiaries: Infosys, Wipro, TCS became global giants.
Rotation: Capital moved from traditional industries (steel, cement) to technology.
2. Infrastructure & Realty Boom (2003–2008)
Trigger: High GDP growth, easy credit, and government focus on infrastructure.
Beneficiaries: Construction, real estate, power, and banking stocks.
Rotation: IT took a backseat while infra and realty stocks skyrocketed.
3. Defensive Phase (2008–2010)
Trigger: Global financial crisis.
Beneficiaries: FMCG, pharmaceuticals, utilities (seen as safe havens).
Rotation: Money flowed out of cyclicals into defensives.
4. Banking & Consumption Boom (2014–2018)
Trigger: Political stability (Modi government), reforms like GST, rising urban demand.
Beneficiaries: Private banks (HDFC Bank, Kotak), consumer stocks, and autos.
Rotation: From defensives into growth-oriented consumption themes.
5. New-Age Tech & Specialty Chemicals (2020–2023)
Trigger: COVID-19 pandemic, supply chain shifts, digital acceleration.
Beneficiaries: IT services, digital platforms, specialty chemicals, and pharma.
Rotation: From traditional banking/infra into new-age digital & healthcare themes.
Key Drivers of Sector Rotation in India
Several factors dictate how and when money moves between sectors in the Indian stock market:
1. Economic Growth & Cycles
Strong GDP growth boosts cyclicals (banks, autos, infra).
Slowdowns favor defensives (FMCG, healthcare, utilities).
2. Interest Rates & Inflation
Low rates: Boosts real estate, autos, banks.
High inflation: Commodities, energy, and metals gain.
3. Government Policies
PLI schemes push manufacturing and electronics.
Green energy policies drive renewables.
Budget announcements often trigger sector rotations.
4. Global Trends
US tech trends influence Indian IT.
Global oil prices impact energy, paints, and logistics.
Pharma benefits from global health trends.
5. Corporate Earnings & Valuations
Sectors with better earnings momentum attract capital.
Overvalued sectors see outflows into undervalued opportunities.
6. Liquidity & Investor Sentiment
FIIs often chase large liquid sectors like IT and banks.
Retail investors may favor emerging sectors like EVs and small-cap themes.
Sector Rotation Framework for Investors
Investors can adopt a structured approach to benefit from sector rotation:
Step 1: Identify the Economic Cycle
Track GDP growth, inflation, RBI policy, and global trends.
Step 2: Map Sectors to Phases
Expansion: Banks, infra, real estate, autos.
Peak: Commodities, metals, oil & gas.
Contraction: FMCG, healthcare, utilities.
Recovery: IT, capital goods, mid-cap manufacturing.
Step 3: Track Sectoral Indices
Nifty IT, Nifty Bank, Nifty Pharma, Nifty FMCG, etc.
Rotation is visible when one index outperforms while another lags.
Step 4: Monitor Flows
FIIs/DIIs publish sectoral allocation data.
Mutual funds and ETFs provide clues on trends.
Step 5: Adjust Portfolio
Gradually rotate allocation rather than making sudden shifts.
Use sectoral ETFs, index funds, or top sector stocks.
Examples of Sector Rotation in Today’s Market (2025 Outlook)
Banking & Financials – Benefiting from strong credit growth and rising urban demand.
IT & Digital – Facing global slowdown but long-term digitalization remains strong.
Pharma & Healthcare – Steady defensive play with innovation in generics and biotech.
FMCG – Gaining from rural recovery and stable consumption.
Renewables & EVs – Long-term government push making it a high-growth sector.
Metals & Energy – Dependent on global commodity cycles; near-term volatility expected.
Risks of Sector Rotation
While sector rotation can boost returns, it also carries risks:
Timing Risk – Misjudging the economic cycle leads to poor allocation.
Policy Uncertainty – Sudden government changes (e.g., GST, export bans).
Global Shocks – Oil price spikes, geopolitical tensions can derail sectors.
Overvaluation Risk – Entering a sector too late when valuations are inflated.
Liquidity Risk – Some sectors (like SMEs or niche industries) may lack liquidity.
Practical Tips for Investors
Stay Diversified – Never put all money into one sector.
Follow Sector Leaders – Blue-chip companies signal sectoral momentum.
Use Technical Indicators – Relative strength index (RSI), moving averages for sector indices.
Read Policy Signals – Budgets, RBI minutes, global commodity news.
Use Sector ETFs – Easier to rotate compared to picking individual stocks.
Combine Fundamentals & Technicals – Balance both to avoid emotional decisions.
Conclusion
Sector rotation in Indian markets is not just a theory—it is a practical investing strategy that has repeatedly proven effective over decades. From the IT boom of the 2000s to the infra rally of 2003–2008, the defensive plays of 2008–2010, and the digital acceleration post-COVID, Indian markets showcase clear evidence of money moving from one sector to another as cycles shift.
For investors, understanding sector rotation means being proactive rather than reactive. Instead of chasing hot stocks after a rally, the real winners are those who anticipate the next sectoral leader and rotate their portfolios accordingly.
India’s economic growth story, driven by demographics, policy reforms, and global integration, ensures that sector rotation will continue to play a pivotal role in wealth creation. Whether you are a short-term trader or a long-term investor, mastering sector rotation is like learning the rhythm of the market’s heartbeat—it tells you where to focus, when to shift, and how to stay ahead.
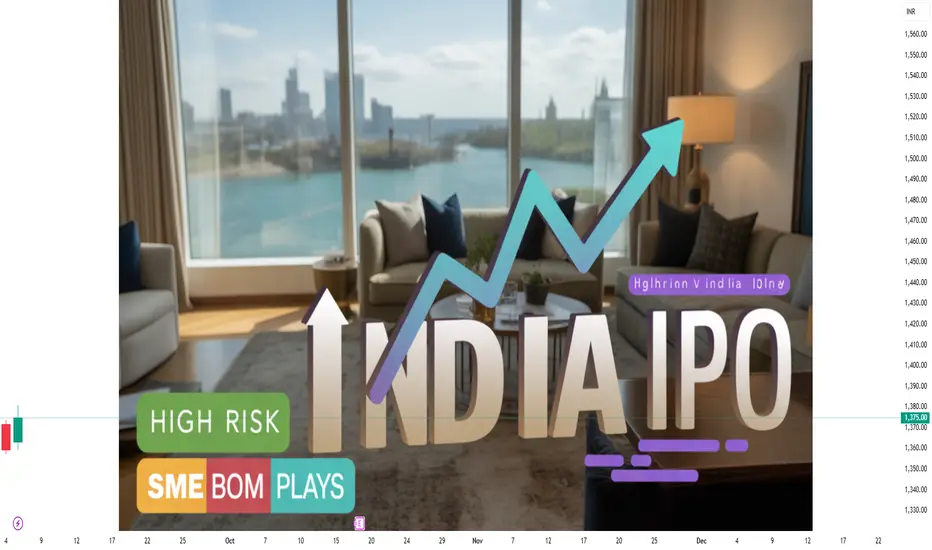
SME IPO Boom in IndiaEvolution of SME IPOs in India
Pre-2012 Scenario
Before 2012, SME companies found it extremely difficult to raise funds through stock exchanges. The compliance burden, cost of listing, and strict requirements made it nearly impossible for smaller businesses to access capital markets. Their financing largely depended on:
Bank loans (often with collateral).
Private equity/venture capital.
Family funds and informal sources.
Introduction of SME Platforms
In 2012, SEBI (Securities and Exchange Board of India) and stock exchanges launched dedicated SME platforms:
BSE SME Exchange (launched in March 2012).
NSE Emerge (launched in September 2012).
These platforms were specifically designed to simplify compliance, reduce listing costs, and provide a gateway for SMEs to raise funds publicly.
Growth Trajectory
Between 2012–2016: A slow start, as companies and investors were still testing the waters.
2017–2019: Strong pickup, especially in tier-2 and tier-3 cities, as awareness spread.
Post-COVID (2020–2023): Explosive growth, with record numbers of SME IPOs and oversubscriptions, indicating a new trend of investor enthusiasm.
By 2024, hundreds of SME IPOs had listed, many with extraordinary listing gains, capturing national attention.
Why Are SME IPOs Booming in India?
Several factors explain the surge:
1. Rising Investor Appetite
Retail investors have increasingly shown interest in SME IPOs because:
Many SME IPOs have delivered multibagger returns in short periods.
Lower IPO sizes make them accessible.
Grey market activity creates hype before listing.
2. Capital Needs of SMEs
SMEs require funds for:
Expansion of capacity.
Technology upgrades.
Debt repayment.
Marketing and working capital.
Listing on SME platforms gives them visibility and credibility, helping them raise funds at competitive costs.
3. Government Support
Initiatives such as Startup India, Digital India, and Make in India have created a supportive environment for SMEs. The government’s focus on MSMEs as the “backbone of the Indian economy” has encouraged many small firms to formalize and consider stock market fundraising.
4. Exchange and SEBI Initiatives
SEBI has created a lighter compliance framework for SME listings, while BSE and NSE have aggressively promoted their SME platforms through roadshows, seminars, and regional outreach.
5. Growing Retail Participation in Markets
The pandemic era saw an explosion in demat accounts, with retail participation at historic highs. Many first-time investors are experimenting with SME IPOs, attracted by their smaller size and higher potential returns.
6. Strong Secondary Market Performance
Many SME stocks, once listed, have performed far better than mainboard stocks. This secondary market strength has boosted confidence among new investors.
Features of SME IPOs
SME IPOs differ from mainboard IPOs in several ways:
Issue Size: Typically smaller, ranging from ₹10 crore to ₹50 crore, though some go higher.
Eligibility: SMEs with post-issue paid-up capital between ₹1 crore and ₹25 crore can list.
Investors: Minimum application size is higher than mainboard IPOs (e.g., ₹1–2 lakh), designed to attract serious investors.
Trading: SME shares are initially traded in a separate platform with lower liquidity compared to mainboard.
Migration: Once the SME grows and meets eligibility, it can migrate to the mainboard.
Benefits of SME IPOs
For Companies
Access to long-term capital without heavy collateral.
Enhanced brand image and credibility.
Opportunity to attract institutional investors.
Liquidity for promoters and early investors.
Better corporate governance and transparency.
For Investors
Early access to high-growth businesses.
Potential for outsized returns.
Portfolio diversification beyond large-caps and mid-caps.
For the Economy
Formalization of the SME sector.
Job creation and regional development.
Strengthening of India’s entrepreneurial ecosystem.
Risks and Challenges in SME IPOs
While the boom is exciting, SME IPOs are not risk-free.
1. Limited Liquidity
SME stocks often suffer from low trading volumes, making it difficult to exit positions.
2. Higher Business Risk
Many SMEs are in early stages, highly dependent on promoters, and vulnerable to industry shocks.
3. Lack of Research Coverage
Unlike large companies, SME IPOs are rarely tracked by analysts, leaving investors with limited data for decision-making.
4. Valuation Concerns
Some SME IPOs are aggressively priced, relying on hype rather than fundamentals.
5. Grey Market Influence
The unofficial grey market often inflates expectations, leading to volatility post-listing.
6. Regulatory Compliance Burden
Although lighter than mainboard, SMEs still face compliance and governance requirements that can strain smaller firms.
Case Studies: Successful SME IPOs
Example 1: Rex Sealing & Packing Industries Ltd
Listed on NSE Emerge, the IPO was oversubscribed multiple times and delivered strong listing gains.
Example 2: Veekayem Fashion and Apparels Ltd
Attracted huge retail interest due to India’s growing textile exports, and its stock multiplied in value within a year.
Example 3: Drone Destination Ltd
A new-age technology SME IPO that captured attention due to India’s drone policy support.
These examples highlight that SME IPOs span across industries—from textiles and chemicals to technology and healthcare.
Investor Strategies for SME IPOs
Due Diligence: Analyze financials, promoter background, industry prospects.
Subscription Data: Higher subscription (especially QIB and HNI categories) signals confidence.
Avoid Blind Herding: Not all SME IPOs succeed; selective investing is key.
Long-Term View: Treat SME IPOs as long-term investments rather than just listing gain plays.
Diversification: Spread risk by investing in multiple SME IPOs across industries.
Regulatory Safeguards
SEBI has taken several steps to protect investors in SME IPOs:
Mandatory minimum subscription levels.
Strict disclosures of promoter shareholding and related-party transactions.
Lock-in requirements for promoters to ensure long-term commitment.
Migration norms to move from SME platform to mainboard once size criteria are met.
Future of SME IPOs in India
The SME IPO boom is likely to continue, supported by:
Tier-2 and Tier-3 growth: Regional SMEs will increasingly come to market.
Digital platforms: Easier investor access via apps and online brokers.
New-age industries: EVs, drones, fintech, and green energy SMEs will dominate listings.
Policy support: Government’s push for “Viksit Bharat 2047” includes SME empowerment.
However, sustainability of the boom will depend on investor discipline, company performance, and regulatory vigilance.
Conclusion
The SME IPO boom in India marks a new chapter in the evolution of Indian capital markets. What began as a niche experiment in 2012 has grown into a full-fledged ecosystem empowering small businesses and democratizing investment opportunities.
For SMEs, IPOs provide growth capital and visibility. For investors, they offer high-risk, high-reward opportunities. For the economy, they catalyze entrepreneurship, innovation, and job creation.
Yet, caution is essential. Investors must conduct thorough research and not be swayed by hype. Policymakers and regulators must ensure transparency and protect retail investors from excesses.
If managed well, the SME IPO boom can be one of the defining forces in India’s journey towards becoming a $5 trillion economy and beyond, proving that in India’s growth story, small can indeed be big.
Divergence SecretsOption Trading in India
India has seen a boom in retail options trading.
1. Exchanges
NSE (National Stock Exchange): Leader in index & stock options.
BSE (Bombay Stock Exchange): Smaller but growing.
2. Popular Underlyings
Nifty 50 Options (most liquid).
Bank Nifty Options (very volatile).
Stock Options (Infosys, Reliance, HDFC Bank, etc.).
3. SEBI Regulations
Compulsory margin requirements.
Weekly index expiries (Thursday).
Physical settlement of stock options at expiry.
Option trading is a double-edged sword. It can create wealth through leverage, hedging, and smart strategies. But it can also destroy capital if misused without understanding risks.
The secret is balance:
Learn the basics.
Practice with small positions.
Respect risk management.
Master volatility and Greeks.
If stocks are like playing cricket, options are like playing 3D chess—complex, dynamic, but highly rewarding for disciplined traders.

Part 2 Support and ResistanceOption Trading in India
India has seen a boom in retail options trading.
1. Exchanges
NSE (National Stock Exchange): Leader in index & stock options.
BSE (Bombay Stock Exchange): Smaller but growing.
2. Popular Underlyings
Nifty 50 Options (most liquid).
Bank Nifty Options (very volatile).
Stock Options (Infosys, Reliance, HDFC Bank, etc.).
3. SEBI Regulations
Compulsory margin requirements.
Weekly index expiries (Thursday).
Physical settlement of stock options at expiry.
Put Options (Right to Sell)
A Put Option gives the holder the right to sell at a strike price. Used when expecting prices to fall.
Example: Buying Infosys ₹1,500 Put at ₹50 premium pays off if Infosys drops below ₹1,450.
Option Market Participants
Hedgers: Reduce risk by using options as insurance. (e.g., farmer hedging crop price, or investor protecting stock portfolio).
Speculators: Bet on price movements to earn profits.
Arbitrageurs: Exploit price differences across markets.
Writers (Sellers): Earn premium by selling options but take on higher risks.

Part 2 Master Candlestick PatternTypes of Options and Market Participants
1. Call Options (Right to Buy)
A Call Option gives the holder the right to buy an asset at a strike price. Investors use calls when they expect prices to rise.
Example: Buying a TCS ₹3,000 Call at ₹100 premium means you profit if TCS rises above ₹3,100 before expiry.
2. Put Options (Right to Sell)
A Put Option gives the holder the right to sell at a strike price. Used when expecting prices to fall.
Example: Buying Infosys ₹1,500 Put at ₹50 premium pays off if Infosys drops below ₹1,450.
3. Option Market Participants
Hedgers: Reduce risk by using options as insurance. (e.g., farmer hedging crop price, or investor protecting stock portfolio).
Speculators: Bet on price movements to earn profits.
Arbitrageurs: Exploit price differences across markets.
Writers (Sellers): Earn premium by selling options but take on higher risks.
Psychology & Discipline in Option Trading
Trading is not just math. It’s mindset.
Fear of Missing Out (FOMO): Leads to impulsive trades.
Over-Leverage: Options tempt traders with small premiums, causing overtrading.
Discipline: Setting stop-loss, position sizing, and risk management is crucial.
Patience: Most successful option traders focus on probability, not prediction.

Part 1 Master Candlestick PatternIntroduction to Options (The Foundation)
Options are one of the most powerful financial instruments in modern markets. They provide flexibility, leverage, and protection. At their core, options are derivative contracts, meaning their value is derived from an underlying asset—like a stock, index, currency, or commodity.
Unlike buying stocks directly, which gives you ownership in a company, options give you the right (but not the obligation) to buy or sell an asset at a pre-decided price within a specific timeframe. This is what makes options both unique and versatile.
1.1 What is an Option?
An option is a contract between two parties:
Buyer of the option: Pays a premium for rights.
Seller (or writer) of the option: Receives the premium but takes on obligations.
Options come in two types:
Call Option – The right to buy an asset at a set price.
Put Option – The right to sell an asset at a set price.
1.2 Key Terminology
Strike Price (Exercise Price): The pre-agreed price at which the underlying can be bought/sold.
Expiration Date: The last day the option can be exercised.
Premium: The price paid by the buyer to acquire the option.
Underlying Asset: The instrument on which the option is based (stock, index, etc.).
Lot Size: Standardized number of units covered by one option contract.
1.3 Example of an Option Contract
Imagine Reliance Industries is trading at ₹2,500. You believe it will rise. You buy a Call Option with a strike price of ₹2,600, expiring in one month, for a premium of ₹50.
If Reliance rises to ₹2,700, your profit = (₹100 intrinsic value – ₹50 premium) × lot size.
If Reliance falls to ₹2,400, you lose only the ₹50 premium.
This limited risk and high reward potential make options attractive.

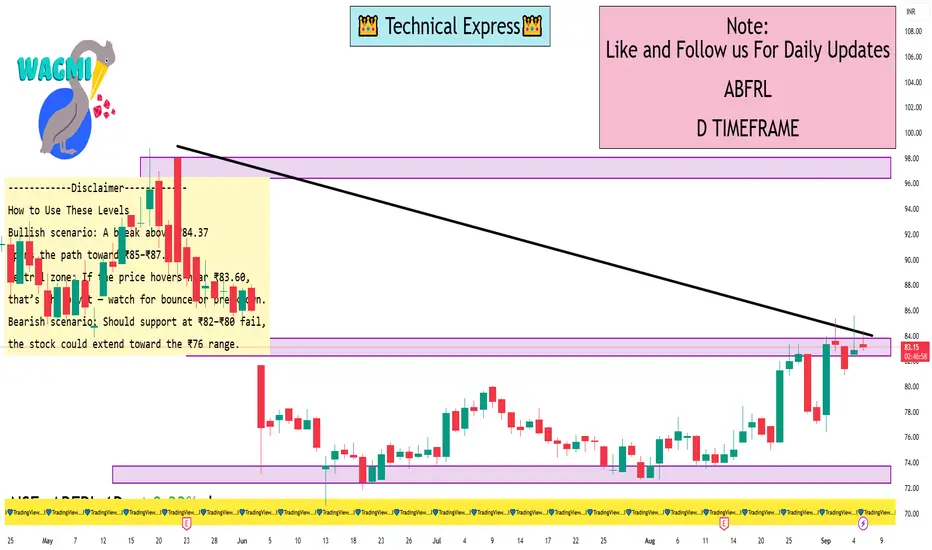
ABFRL 1 Day ViewKey Intraday Support & Resistance Levels (1-Day Timeframe)
Here’s a breakdown of the technical levels for ABFRL on a daily (1-day) timeframe:
Pivot Points & Fibonacci Levels (TopStockResearch as of Sept 5, 2025)
Standard daily pivots:
Support: S1 = ₹83.59, S2 = ₹81.59, S3 = ₹80.29, S4 = ₹78.29
Pivot: ₹84.89
Resistance: R1 = ₹86.89, R2 = ₹88.19
Camarilla pivots confirming nearby support/resistance zone
MunafaSutra Intraday Levels
One source reports:
Resistance: ₹78.09
Short-term support/resistance: ₹80.24 / ₹76.48
Another indicates:
Resistance: ₹77.42
Support/resistance: ₹78.26 / ₹75.82
These shorter-term numbers appear based on earlier data and may have shifted slightly. The pivot-based levels from TopStockResearch are likely more up-to-date and relevant for today’s intraday outlook.
Fibonacci Retracement Levels (from recent uptrends)
Retracement (support) zones from trend beginnings (e.g., June 13–Sept 4):
Near support areas: ₹79.85, ₹78.07, ₹76.30, ₹74.10
Projection (resistance) levels: ₹86.43, ₹88.63, ₹90.40, ₹92.18, ₹94.38
Gap Resistance & Candlestick Patterns
A gap resistance zone exists around ₹84, which may act as a near-term target if bullish momentum continues. Recent candlestick activity (inverted hammer, bullish pin bar) hints at potential short-term reversal strength
Macro Events: The Forces That Shape Global Markets1. Introduction to Macro Events
In financial markets, price movements are never random. Behind every rally, crash, or sideways trend lies a set of fundamental forces—commonly referred to as macro events. These events are large-scale, economy-wide developments that affect not just one company or sector, but entire markets, regions, and even the global economy. Traders, investors, policymakers, and institutions constantly monitor macro events because they set the tone for risk appetite, liquidity, and asset pricing.
Macro events may arise from economic data, central bank decisions, geopolitical tensions, or structural shifts like technological change. A trader who ignores them risks being blindsided by sudden volatility. On the other hand, a trader who understands them gains an edge in predicting sentiment and positioning portfolios.
To fully grasp their importance, let’s break down the types of macro events, their market impacts, and how history has demonstrated their power.
2. Types of Macro Events
2.1 Economic Data Releases
Economic data releases are the heartbeat of financial markets. Reports like GDP growth, inflation, employment, consumer spending, and manufacturing activity act as “check-ups” for the health of an economy.
Nonfarm Payrolls (U.S.) – Traders worldwide treat this monthly report as a market-moving event. A strong jobs number signals robust growth (positive for stocks but negative for bonds as rates may rise). A weak number fuels expectations of rate cuts.
Inflation Data (CPI, PPI) – Inflation is closely tied to central bank actions. Surging inflation pressures interest rates higher, hurting equities but boosting bond yields and commodities.
GDP Growth – A country’s output growth rate sets the long-term trajectory of corporate earnings, trade balances, and investor flows.
Markets move not only on the numbers themselves but also on how they compare with expectations. A surprise deviation often triggers sharp intraday volatility.
2.2 Central Bank Policies
Few macro events move markets as strongly as central bank decisions. Whether it’s the U.S. Federal Reserve, the European Central Bank, or the Reserve Bank of India, monetary policy sets the cost of capital and liquidity across the system.
Key tools include:
Interest Rate Decisions – Hikes cool inflation but dampen equity rallies; cuts stimulate growth but weaken currencies.
Quantitative Easing (QE) – Large-scale asset purchases inject liquidity, boosting risk assets like stocks and real estate.
Forward Guidance – Even a single phrase in a central banker’s speech can send bond yields or currencies into a tailspin.
For example, when the Fed cut rates aggressively in 2020 to support markets during COVID-19, U.S. equities staged a massive rebound despite the global health crisis.
2.3 Geopolitical Developments
Geopolitics introduces uncertainty—something markets dislike. Wars, conflicts, trade disputes, and diplomatic standoffs can all shake investor confidence.
Wars & Conflicts – The Russia-Ukraine war (2022) disrupted energy and food supplies, triggering global inflation.
Trade Wars – The U.S.-China trade war (2018–2019) raised tariffs and unsettled supply chains, causing market turbulence.
Diplomatic Summits – Agreements at events like G20 summits or OPEC meetings can shift global commodity prices overnight.
Geopolitical risks often push investors into safe havens such as gold, U.S. Treasuries, or the Swiss franc.
2.4 Commodity & Energy Shocks
Energy is the backbone of the global economy, making oil, natural gas, and key commodities highly sensitive to macro events.
Oil Price Shocks – OPEC’s 1973 embargo quadrupled oil prices, plunging the world into recession.
Food Commodity Shocks – Weather disruptions and supply bottlenecks cause spikes in wheat, rice, or soybean prices, fueling inflation and social unrest.
Metals & Rare Earths – Strategic minerals used in technology and defense often become geopolitical tools.
Traders in commodities often live and breathe macro headlines because supply disruptions or political moves can swing prices violently.
2.5 Fiscal Policies & Government Actions
Governments wield enormous influence over economies through taxation, spending, and reforms.
Budget Announcements – India’s Union Budget or the U.S. Federal Budget shapes growth expectations, subsidies, and corporate profitability.
Tax Reforms – Cuts often boost stock markets (short term), while hikes may dampen business sentiment.
Stimulus Packages – Large-scale spending, such as the U.S. CARES Act during COVID-19, directly fuels liquidity and consumption.
Fiscal actions usually complement or counterbalance central bank policies.
2.6 Global Trade & Supply Chain Events
Globalization has tightly interconnected economies, meaning a shock in one part of the chain can ripple worldwide.
Port Blockages – The 2021 Suez Canal blockage halted 12% of world trade in a matter of days.
Semiconductor Shortages – The 2020–2022 chip shortage disrupted auto and electronics sectors globally.
Pandemic Restrictions – Lockdowns and border closures caused logistical nightmares for exporters and importers.
For equity analysts, supply chain disruptions translate into earnings downgrades and margin pressures.
2.7 Financial Crises & Black Swan Events
Sometimes macro events come as shocks—rare, unpredictable, but catastrophic.
2008 Global Financial Crisis – Triggered by subprime mortgage collapse, this event nearly froze global credit markets.
COVID-19 Pandemic – A health crisis turned into an economic shock, shrinking global GDP and reshaping industries.
Currency Collapses – Hyperinflation in Venezuela or Turkey’s lira crash illustrates how quickly confidence can vanish.
Black swans emphasize the need for diversification, hedging, and scenario planning.
3. Impact of Macro Events on Markets
3.1 Equities
Stock markets reflect expectations of future earnings. Macro events shift those expectations:
Positive GDP growth → bullish equities.
Rate hikes → bearish for growth stocks.
Wars/conflicts → sectoral winners (defense, energy) but broad market losses.
3.2 Bonds
Bonds are highly sensitive to macro signals, especially inflation and interest rates.
Rising inflation → falling bond prices (yields up).
Recession fears → investors flock to bonds, pushing yields down.
3.3 Currencies (Forex)
Currencies react to both domestic and global macro events.
Higher interest rates → stronger currency.
Political instability → weaker currency.
Trade surpluses → long-term currency support.
For instance, the U.S. dollar strengthened massively during 2022 as the Fed hiked rates to tame inflation.
3.4 Commodities
Macro events often push commodities in opposite directions:
Inflation & war → gold up.
Supply disruptions → oil and gas spike.
Economic slowdowns → industrial metals (copper, aluminum) fall.
3.5 Cryptocurrencies
Though newer, crypto markets are also shaped by macro events:
Inflation & currency weakness → investors turn to Bitcoin as “digital gold.”
Regulatory crackdowns → sell-offs in crypto markets.
Liquidity waves → surging risk appetite drives crypto rallies.
4. Historical Examples of Macro Events
4.1 2008 Global Financial Crisis
Triggered by mortgage-backed securities collapse, the crisis wiped trillions from global markets. Central banks responded with QE, reshaping monetary policy forever.
4.2 COVID-19 Pandemic (2020)
Lockdowns froze economies, markets crashed 30% in weeks, but unprecedented stimulus sparked one of the fastest rebounds in history.
4.3 Russia-Ukraine War (2022)
Energy and food price shocks drove inflation worldwide. European economies struggled with gas shortages, while defense stocks surged.
4.4 OPEC Oil Price Shocks
From 1973 to 2020, OPEC decisions repeatedly caused energy volatility. Traders monitor these meetings as major macro events.
4.5 India’s Demonetization (2016)
The sudden removal of high-value currency notes disrupted businesses, retail demand, and the informal economy, while pushing digital payments adoption.
5. How Traders and Investors Should Respond
Risk Management Strategies
Use stop-loss orders to protect capital during volatile macro events.
Diversify across asset classes (equities, bonds, commodities, cash).
Hedging Instruments
Futures & options to hedge exposure.
Currency forwards for exporters/importers.
Gold as a safe haven during uncertainty.
Macro Trading Strategies
Top-down investing: Start with macro trends → sectors → individual stocks.
Event-driven trading: Position ahead of known announcements (jobs data, Fed meetings).
Safe-haven rotation: Shift to gold, Treasuries, or USD during crises.
Long-Term vs Short-Term
Long-term investors ride out volatility, focusing on structural growth.
Short-term traders exploit swings with tactical plays.
6. Future of Macro Events in a Changing World
6.1 Technology & AI
AI adoption will reshape productivity, labor markets, and monetary policy. Macro events will increasingly include technological disruptions.
6.2 Climate Change & Green Policies
Extreme weather and carbon policies will move commodity markets, insurance sectors, and energy investments.
6.3 Geopolitical Power Shifts
The U.S.–China rivalry, regional alliances, and conflicts will dominate macro headlines for decades.
6.4 Digital Currencies & Blockchain
Central Bank Digital Currencies (CBDCs) could redefine monetary systems, making them macro events in themselves.
7. Conclusion
Macro events are the invisible currents steering global markets. They influence risk perception, capital flows, and investment returns. Whether it’s a jobs report, a Fed rate decision, an oil shock, or a geopolitical crisis, markets react instantly and often violently.
For traders, the lesson is clear: ignore macro events at your peril. Success lies not only in technical charts or company fundamentals but also in recognizing the big picture. By staying informed, practicing risk management, and thinking globally, investors can turn macro volatility into opportunity.
Breakouts & Fakeouts in Trading🔹 Introduction
Financial markets are like living organisms – constantly moving, adjusting, and reacting to news, emotions, and liquidity. For traders, one of the most exciting moments is when a stock, currency pair, commodity, or cryptocurrency seems to break out of its range. Breakouts often lead to big, sharp moves, offering opportunities for quick profits.
But here’s the catch: not every breakout is real. Many are fakeouts (false breakouts) designed by market dynamics, liquidity hunters, or big players to trap traders. The difference between making money and losing money often lies in identifying whether a breakout is genuine or false.
This article dives into:
What breakouts are
Why fakeouts happen
Chart examples (conceptually explained)
Tools to confirm breakouts
Trading strategies to avoid traps
Risk management for breakout traders
🔹 Part 1: What is a Breakout?
A breakout occurs when the price of an asset moves outside a defined support or resistance level with increased momentum.
✅ Common Types of Breakouts
Resistance Breakout – Price moves above a previously strong ceiling.
Support Breakout – Price falls below a previously strong floor.
Trendline Breakout – Price breaks out of a rising or falling trendline.
Chart Pattern Breakout – Price escapes from patterns like triangles, flags, rectangles, or head & shoulders.
Volatility Breakout – When price explodes after a period of consolidation (Bollinger Band squeeze).
Why traders love breakouts?
They indicate a new trend may begin.
They provide clear entry and exit levels.
They often come with higher volume, confirming market interest.
Example: If Nifty is stuck between 19,500–20,000 for weeks and suddenly crosses 20,000 with heavy volume, that’s a bullish breakout.
🔹 Part 2: What is a Fakeout?
A fakeout (false breakout) happens when price temporarily breaks a level, lures traders into positions, but then reverses back into the range.
Fakeouts are dangerous because:
Traders enter aggressively expecting a trend, but get stopped out.
Big players use fakeouts to hunt stop-losses of retail traders.
They often happen during low liquidity or news events.
Example: Price breaks above 20,000, attracts buyers, but quickly reverses to 19,800. That’s a bull trap fakeout.
🔹 Part 3: Why Do Fakeouts Happen?
Fakeouts are not random; they are part of market psychology and structure.
Liquidity Hunting (Stop Loss Hunting)
Smart money knows retail traders place stop-losses above resistance or below support.
They push prices just beyond those levels, trigger stop-losses, then reverse.
Low Volume Breakouts
If breakout happens without strong participation, it’s usually unsustainable.
News & Events
A sudden announcement can cause sharp moves, but once news fades, price falls back.
Algorithmic Manipulation
High-frequency traders may push price beyond levels to create artificial breakouts.
Market Sentiment & Greed
Traders chase breakouts blindly, creating temporary momentum before exhaustion.
🔹 Part 4: Spotting Genuine Breakouts vs Fakeouts
✅ Clues for Real Breakouts
High Volume: Breakouts with above-average volume are stronger.
Retest of Levels: After breakout, price pulls back to test old support/resistance, then resumes trend.
Strong Candle Closes: Large body candles closing beyond the level.
Market Context: Aligns with larger trend or macroeconomic strength.
❌ Signs of Fakeouts
Breakout with low or declining volume.
Long wicks (shadows) beyond resistance/support but weak closes.
Breakouts during off-market hours or thin liquidity.
Price immediately snaps back into range after breakout.
🔹 Part 5: Chart Patterns & Fakeouts
Range Breakouts
Markets consolidate between two levels.
Breakouts beyond range are powerful but also prone to fakeouts.
Triangle Breakouts
Symmetrical/ascending/descending triangles show compression.
Fakeouts are common before the “real” breakout.
Head & Shoulders Pattern
A breakdown below the neckline should confirm trend reversal.
Many times, price breaks below neckline but quickly recovers.
Flag & Pennant Patterns
Strong continuation patterns, but fake breakouts happen if volume is missing.
🔹 Part 6: Strategies to Trade Breakouts & Avoid Fakeouts
1. Wait for Candle Close Confirmation
Don’t jump in immediately; wait for the candle to close above/below the level.
2. Use Volume as Filter
Only trade breakouts with above-average volume.
3. Retest Strategy
Enter on pullback to old support/resistance (safer entry).
4. Multi-Timeframe Confirmation
If breakout is visible on both 1-hour and daily charts, it’s stronger.
5. Combine with Indicators
RSI divergence can warn of false breakout.
Moving averages can confirm trend direction.
6. Avoid News-Driven Breakouts
Trade technical breakouts, not temporary news spikes.
🔹 Part 7: Risk Management in Breakout Trading
Even the best trader cannot avoid fakeouts completely. That’s why risk management is key.
Position Sizing: Risk only 1–2% of account per trade.
Stop Loss Placement:
For upside breakout: place SL below breakout level.
For downside breakout: place SL above breakdown level.
Use Partial Profits: Book some profit early, trail the rest.
Don’t Chase Breakouts: If you miss the first entry, don’t enter late.
🔹 Part 8: Real-Life Examples
Example 1: Stock Breakout
Stock consolidates between ₹500–₹520 for 2 weeks.
Breaks ₹520 with high volume, rallies to ₹550. (Real breakout)
Example 2: Crypto Fakeout
Bitcoin breaks $30,000 resistance but fails to sustain.
Falls back to $29,000 within hours. (Bull trap fakeout)
Example 3: Forex False Breakdown
EUR/USD breaks below 1.1000, triggering short trades.
Reverses sharply to 1.1050. (Bear trap fakeout)
🔹 Part 9: Psychology Behind Breakouts & Fakeouts
Retail Traders: Chase price blindly.
Institutions: Create liquidity zones by triggering retail stop-losses.
Fear & Greed: Traders either fear missing out (FOMO) or panic at reversals.
Patience vs Impulsiveness: Successful traders wait for confirmation, while impulsive ones fall for fakeouts.
🔹 Part 10: Advanced Tips for Professionals
Volume Profile Analysis
See if breakout aligns with high-volume nodes (strong support/resistance).
Order Flow Tools (Level II Data, Footprint Charts)
Helps spot whether breakout is supported by real buying/selling.
Breakout with Trend Alignment
Always trade in direction of higher-timeframe trend.
Market Timing
Breakouts during main sessions (like US market open) are more reliable.
🔹 Conclusion
Breakouts & fakeouts are two sides of the same coin. While real breakouts can deliver powerful moves, fakeouts are equally common and dangerous. The key lies in:
Confirming with volume, retests, and candle closes.
Avoiding emotional FOMO trades.
Protecting capital with risk management.
If you understand the psychology behind breakouts and fakeouts, use confirmation tools, and trade with patience, you can avoid traps and capture the big trend moves that follow genuine breakouts.
Crypto Trading StrategiesChapter 1: Basics of Crypto Trading
1.1 What is Crypto Trading?
Crypto trading is the buying and selling of digital currencies like Bitcoin, Ethereum, or Solana with the goal of making profits. Trades can be short-term (minutes, hours, or days) or long-term (months or years).
1.2 Why Do People Trade Crypto?
High volatility = high profit potential
24/7 market availability
Variety of assets (over 25,000 coins/tokens)
No central authority (decentralization)
1.3 Types of Crypto Trading
Spot Trading: Buying and selling crypto for immediate delivery.
Futures & Derivatives: Speculating on price without holding the asset.
Margin Trading: Borrowing funds to trade larger positions.
Automated Trading (Bots/AI): Using algorithms to execute trades.
Chapter 2: Foundations of a Good Trading Strategy
2.1 Key Elements
Market Analysis (technical + fundamental)
Risk Management (stop-loss, position sizing)
Trading Psychology (discipline, patience)
Adaptability (adjusting strategies to market conditions)
2.2 Technical Tools
Candlestick patterns
Moving averages (MA, EMA)
RSI, MACD, Bollinger Bands
Volume profile and market structure
2.3 Risk Control
Never risk more than 1–2% of capital per trade.
Always set stop-loss orders.
Diversify across assets.
Chapter 3: Popular Crypto Trading Strategies
3.1 HODLing (Long-Term Holding)
Concept: Buy and hold crypto for years regardless of short-term fluctuations.
Best for: Investors who believe in long-term blockchain growth.
Pros: Easy, stress-free, low trading fees.
Cons: Vulnerable to market crashes.
3.2 Day Trading
Concept: Opening and closing positions within a day.
Tools Used: Technical analysis, chart patterns, high liquidity coins.
Pros: Daily income potential.
Cons: Stressful, requires screen time, risky.
3.3 Swing Trading
Concept: Capturing medium-term price swings (days to weeks).
Example: Buying Bitcoin after a pullback and selling after a breakout.
Pros: Less stressful than day trading.
Cons: Requires patience, overnight risks.
3.4 Scalping
Concept: Making dozens or hundreds of trades daily for small profits.
Tools: Bots, high liquidity exchanges, technical indicators.
Pros: Can accumulate profits quickly.
Cons: High fees, mentally exhausting.
3.5 Trend Following
Concept: "The trend is your friend." Trade in the direction of momentum.
Indicators: Moving averages, MACD, Ichimoku Cloud.
Pros: Effective in trending markets.
Cons: Doesn’t work well in sideways (range-bound) markets.
3.6 Breakout Trading
Concept: Entering trades when price breaks a key support/resistance level.
Example: Buying Bitcoin when it breaks $30,000 resistance.
Pros: Can catch big moves early.
Cons: False breakouts are common.
3.7 Arbitrage
Concept: Exploiting price differences between exchanges.
Types:
Exchange Arbitrage (Binance vs Coinbase)
Triangular Arbitrage (using three pairs)
Pros: Low risk if executed fast.
Cons: Requires speed, high capital.
3.8 Copy Trading / Social Trading
Concept: Following trades of professional traders via platforms.
Pros: Easy for beginners.
Cons: Risk if trader performs badly.
3.9 Algorithmic & Bot Trading
Concept: Automated execution using pre-set rules.
Pros: No emotions, works 24/7.
Cons: Needs technical knowledge, market risk.
3.10 News-Based Trading
Concept: Trading based on major announcements (ETF approvals, regulations, partnerships).
Pros: Can profit from volatility.
Cons: Markets react unpredictably.
Chapter 4: Advanced Crypto Trading Strategies
4.1 Using Leverage
Borrowed funds to trade bigger positions.
Example: 10x leverage means 1% move = 10% profit/loss.
Warning: Extremely risky, beginners should avoid.
4.2 Hedging
Using futures/options to protect long-term holdings.
Example: Holding Bitcoin but shorting futures to protect downside.
4.3 Dollar-Cost Averaging (DCA)
Investing small amounts regularly over time.
Pros: Reduces impact of volatility.
Cons: Slower gains in bull markets.
4.4 Yield Farming & Staking
Earning passive income by locking tokens.
Pros: Steady income.
Cons: Smart contract risks, token devaluation.
Chapter 5: Trading Psychology & Risk Management
5.1 Emotions in Trading
Fear & greed drive most mistakes.
Overtrading, revenge trading, panic selling = account killers.
5.2 Building Discipline
Have a written trading plan.
Stick to stop-loss and take-profit levels.
Avoid FOMO (fear of missing out).
5.3 Risk-Reward Ratio
Aim for at least 1:2 risk-reward ratio (risk $100 to make $200).
Chapter 6: Practical Tips for Crypto Traders
Trade only with money you can afford to lose.
Keep records of trades (trading journal).
Use reliable exchanges with strong security.
Learn continuously—crypto evolves fast.
Diversify between Bitcoin, altcoins, and stablecoins.
Conclusion
Crypto trading offers incredible opportunities—but also extreme risks. Without a strategy, traders often fall prey to volatility, scams, or emotions. By learning and applying structured crypto trading strategies like HODLing, day trading, swing trading, scalping, and advanced techniques like arbitrage or hedging, traders can approach the market with confidence.
Success in crypto doesn’t come overnight. It’s built through education, discipline, and consistent execution. The right strategy—combined with risk management and emotional control—can turn crypto from a gamble into a rewarding investment journey.

Entry to Exit: Step-by-Step Trade Management1. Introduction
Trading is not only about finding the right entry point—it’s about how you manage your trade once you’re inside the market. Many beginners spend countless hours searching for the “perfect” entry strategy, but professionals know that trade management is where the real game is won or lost.
Think of trading as a journey. Entry is the start, exit is the destination, and trade management is the road that connects the two. Without proper management, even the best entry signals can turn into losing trades. On the other hand, with disciplined management, even an average entry can become profitable.
In this guide, we’ll break down the entire trade lifecycle—from preparation to execution, from entry to exit—step by step.
2. Pre-Trade Preparation
Before entering a trade, preparation is key. Just like a pilot runs through a checklist before takeoff, a trader should have a trade checklist.
🔹 Market Research & Analysis
Study broader market trends (bullish, bearish, sideways).
Check fundamentals (earnings reports, economic news, sector performance).
Perform technical analysis (support/resistance levels, chart patterns, moving averages).
🔹 Building a Trade Plan
A trade without a plan is like sailing without a map. A strong trade plan includes:
Entry criteria – What signals will you wait for before entering?
Stop-loss level – Where will you cut the trade if it goes against you?
Target level – Where will you take profit?
Position size – How much capital will you risk?
🔹 Defining Risk per Trade
Professional traders don’t risk everything in one trade. A common rule is the 1-2% risk rule. For example:
If you have ₹1,00,000 capital and risk 1% per trade → max loss = ₹1,000.
This ensures survival even after multiple losing trades.
3. Entry Strategies
Your entry is the first step into the battlefield. A good entry maximizes reward while minimizing risk.
🔹 Types of Entries
Breakout Entries – Entering when price breaks a key resistance/support.
Pullback Entries – Waiting for price to retrace to a support/resistance level before entering.
Reversal Entries – Entering when trend shows signs of changing direction.
🔹 Confirmation Tools
Candlestick patterns (engulfing, hammer, doji).
Indicators (RSI for momentum, MACD for trend confirmation).
Volume analysis (rising volume = strong move).
🔹 Avoiding FOMO Entries
Jumping into trades without confirmation leads to poor risk-reward setups. Always stick to your predefined entry signals.
4. Stop Loss & Risk Management
Stop-loss is your insurance policy. Without it, one bad trade can wipe out weeks of profits.
🔹 Types of Stops
Hard Stop – Pre-set level, automatically exits trade.
Mental Stop – Decided in mind, but dangerous if emotions take over.
ATR Stop – Based on volatility (Average True Range).
🔹 Break-Even Adjustment
When trade moves in your favor, shift stop-loss to entry point → removes risk.
🔹 Risk-Reward Ratio (RRR)
Only take trades with minimum 1:2 or 1:3 ratio. Example: risk ₹1,000 for potential ₹2,000–₹3,000 gain.
5. Trade Monitoring & Mid-Trade Adjustments
Once in a trade, your job is to manage it intelligently.
🔹 When Market Moves in Your Favor
Use trailing stop-loss to lock profits.
Scale out gradually (book partial profits at key levels).
🔹 When Market Moves Against You
Never widen stop-loss (it increases risk).
Accept the loss gracefully—capital preservation is priority.
🔹 Scaling In & Out
Scaling in: Add to your position as trade confirms in your favor.
Scaling out: Reduce position gradually, booking partial profits while still staying in.
6. Trade Psychology
Emotions are the biggest enemy of traders. Fear and greed often sabotage good strategies.
🔹 Common Emotional Traps
Fear of Missing Out (FOMO) – Chasing trades without signals.
Fear of Loss – Closing positions too early.
Greed – Holding too long, ignoring exit plan.
🔹 Discipline Rules
Follow your plan, not your emotions.
Accept that losses are part of the game.
Think in terms of probabilities, not certainties.
7. Exit Strategies
A trade is not complete until you exit. Profits exist only when booked.
🔹 Exit Types
Target-Based Exit – Close trade when it hits your planned profit target.
Trailing Stop Exit – Ride trend while protecting profits.
Time-Based Exit – Exit if price doesn’t move within certain time.
🔹 Letting Profits Run
The hardest skill is to hold winners long enough while not giving back gains. Trailing stops help balance safety & profit.
🔹 Avoid Early Exits
Many traders exit too soon because of emotions. Always follow your planned exit rule, not short-term market noise.
8. Post-Trade Review
Every trade—win or lose—is a learning opportunity.
🔹 Trading Journal
Record every trade:
Entry, exit, stop-loss.
Reasons for trade.
Emotions felt.
Lessons learned.
🔹 Review Process
Analyze losing trades → were they due to bad setup or bad discipline?
Analyze winning trades → did you follow your plan, or was it luck?
Constantly refine your strategy.
9. Conclusion
Trade management is the bridge between analysis and profitability. The entry may give you the opportunity, but it’s management that determines the outcome.
Prepare before you trade.
Enter only with clear signals.
Manage risk with position sizing and stop-loss.
Control emotions during the trade.
Exit with discipline.
Learn from every trade.
By mastering trade management, you shift from gambling to professional trading. In the end, trading isn’t about predicting the market perfectly—it’s about managing uncertainty profitably, from entry to exit.
Part 10 Trading Master Class With ExpertsOptions in Hedging
Options are not only for speculation. Big institutions use them for hedging.
Portfolio Hedge: A fund holding ₹100 crore worth of Nifty stocks may buy Nifty puts. If the market crashes, puts rise in value, cushioning losses.
Corporate Hedge: A company expecting payment in USD may buy currency options to protect against rupee appreciation.
Commodity Hedge: A farmer may use options to lock in selling prices for crops.
Hedging reduces uncertainty and stabilizes income.
Options in Speculation
Speculators love options because:
Small premium = big exposure.
High leverage = high potential returns.
Flexibility to bet on direction, volatility, or time.
But speculation is risky. Most retail traders lose because they treat options as lottery tickets.
Options for Income Generation
Option sellers (writers) earn premium by providing liquidity to buyers.
Covered Call Writing: Regularly selling calls on owned stock generates income.
Cash-Secured Puts: Selling puts on stocks you’re willing to buy at lower prices.
Range-Bound Strategies (Iron Condors, Butterflies): Earn premium if stock stays within range.
Many professionals and institutions rely on option selling for consistent income.

Part 8 Trading Master Class With ExpertsNeutral Market Strategies
Sometimes traders expect the market to move sideways with low volatility. Options shine here:
Straddle: Buy a call & put at the same strike.
Profits if stock makes big move (up or down).
Expensive because of double premium.
Strangle: Buy OTM call & OTM put.
Cheaper than straddle.
Needs a strong move in any direction.
Iron Condor: Sell OTM call + sell OTM put + buy far OTM call + buy far OTM put.
Profits if stock stays within a range.
Popular income strategy.
Butterfly Spread: Combine calls or puts at 3 strike prices.
Best when expecting very little movement.
Advanced Strategies
Calendar Spread: Sell near-term option & buy long-term option at same strike.
Benefits from time decay differences.
Ratio Spread: Sell more options than you buy.
High-risk, high-reward.
Diagonal Spread: Mix of calendar & vertical spread.
Box Spread: Combination that locks in risk-free profit (used by arbitrageurs).
📌 Takeaway: Strategies allow traders to play in bullish, bearish, or neutral markets while controlling risk. Mastery of strategies separates professional traders from gamblers.

Part 6 Learn Institutional Trading Deep Dive into Option Strategies
One of the biggest advantages of options is the ability to combine them into structured strategies. Let’s expand on some common and advanced ones:
A. Single-Leg Strategies
These involve buying or selling just one option.
Long Call: Buy a call option expecting prices to rise.
Low risk (limited to premium paid).
High reward if stock surges.
Long Put: Buy a put option expecting prices to fall.
Best for bearish outlook.
Acts as portfolio insurance.
Short Call (Naked Call): Sell a call without owning stock.
You receive premium.
Unlimited risk if stock rises sharply.
Short Put (Naked Put): Sell a put option.
You receive premium.
Big risk if stock collapses.
B. Multi-Leg Strategies (Spreads & Hedging)
Bull Call Spread: Buy a lower strike call & sell a higher strike call.
Profits if stock rises moderately.
Lower risk than naked call.
Bear Put Spread: Buy higher strike put & sell lower strike put.
Works in moderately bearish markets.
Covered Call: Own stock + sell call option.
Generates steady income.
Capped upside potential.
Protective Put: Own stock + buy put option.
Insurance against stock falling.

Part 2 Ride The Big MovesBasic Terminology
Before we dive deeper, let’s clear the basic terms in option trading:
Underlying Asset – The stock, index, commodity, or currency on which the option is based. Example: Nifty, Reliance, crude oil.
Option Contract – The agreement between buyer and seller of the option.
Call Option – Gives the holder the right (but not obligation) to buy the underlying asset at a fixed price before expiry.
Put Option – Gives the holder the right (but not obligation) to sell the underlying asset at a fixed price before expiry.
Strike Price – The price at which the option holder can buy (call) or sell (put) the underlying.
Expiry Date – The last date when the option can be exercised. In India, stock options usually expire monthly or weekly (for indices).
Premium – The price you pay to buy an option contract. It’s like a ticket fee for having the right to buy or sell in the future.
Lot Size – Each option contract is traded in fixed quantities called lots. Example: Nifty option lot = 50 units.
How Options Work
Imagine you want to buy a house worth ₹50 lakhs, but you’re unsure whether the price will rise or fall in the next 6 months. Instead of paying ₹50 lakhs now, you strike a deal with the owner:
You pay ₹2 lakhs today as a non-refundable fee (premium).
You get the right to buy the house anytime in the next 6 months at ₹50 lakhs (strike price).
Now:
If the house price rises to ₹60 lakhs, you can still buy it at ₹50 lakhs and make a profit.
If the house price falls to ₹45 lakhs, you can walk away. You lose only the ₹2 lakhs premium.
This is exactly how a call option works.
A put option is the reverse: you get the right to sell something at a fixed price, useful if you think prices will fall.
So options are all about rights, not obligations. The buyer has rights, the seller has obligations.

Part 1 Ride The Big MovesIntroduction to Options
In the world of financial markets, people look for different ways to make money, reduce risk, or take positions on where they think markets are headed. Apart from buying and selling stocks directly, one of the most powerful tools available is options trading.
Options are a type of derivative contract. This means their value is derived from an underlying asset like a stock, index, currency, or commodity. They give traders and investors flexibility because they can be used for speculation (betting on price movements), hedging (protecting against risks), or even for generating steady income.
Unlike stocks where ownership is straightforward (you buy a share, you own part of the company), options are contracts with special terms, conditions, and expiry dates. This makes them more complex but also more versatile.
For example: If you believe a stock price will rise in the next month, you don’t necessarily need to buy the stock. Instead, you can buy a call option, which gives you the right to buy that stock at a certain price later. Similarly, if you think the stock will fall, you can buy a put option, which gives you the right to sell at a certain price.
This flexibility makes options attractive to professional traders, institutions, and even retail traders who want to manage risk or boost returns.
But with power comes responsibility—options can be risky if not understood properly. That’s why it’s important to study them in depth.
Types of Options (Call & Put)
Call Option (Bullish bet):
If you expect the stock price to go up, you buy a call. Example: Reliance stock is ₹2,500. You buy a call option with strike price ₹2,600. If stock rises above ₹2,600, your option gains value.
Put Option (Bearish bet):
If you expect the stock price to fall, you buy a put. Example: Infosys stock is ₹1,500. You buy a put option with strike price ₹1,400. If stock falls below ₹1,400, your option gains value.
Both call and put can be bought or sold (written). Selling options means you take on obligations, which is riskier but gives you upfront premium income.

ATULAUTO 1 Day ViewIntraday Support & Resistance (1-Day Level)
MunafaSutra reports:
Short-term Resistance: ₹434.01 and ₹438.97
These levels are cited as valid for intra-day trading scenarios
ICICI Direct shows:
First Support: ₹422.5
Second Support: ₹418.7
Third Support: ₹413.2
Second Resistance: ₹437.2
Third Resistance: ₹441.0
Summary of intraday levels:
Support zone: ~₹422–₹419
Resistance zone: ~₹437–₹441
Current Price Context
ICICIdirect shows a day high of ₹499.05 and day low of ₹449.00, with a last traded price around ₹490.20 as of September 4, 2025
Investing.com also confirms this high volatility range: day’s range ~₹454.95 to ₹497.60
This suggests the stock has already experienced a significant intraday rally, trading well above the traditional short-term resistance levels noted by analysts.
Technical Ratings (Daily Basis)
TradingView categorizes the 1-day timeframe technical summary for Atul Auto as "Neutral" across both Oscillators and Moving Averages
Final Thoughts
For aggressive traders: A breakout above the ₹495–₹503 zone could spark further upside.
For cautious traders: Watch for potential consolidation and hold above ₹475–₹484 as signs of strength. A dip to ₹434–₹444 still maintains bullish structure for now.
Stop-loss planning: Consider trailing protection below key support levels, e.g., around the pivot zone (₹475) or lower support (₹434).
Intraday vs Swing Trading1. Understanding Intraday Trading
Definition
Intraday trading means entering and exiting positions within the same trading day. A trader does not hold any position overnight to avoid overnight risks such as news announcements, earnings reports, or global market volatility.
Characteristics of Intraday Trading
Short Holding Period: Minutes to hours, always squared-off before market close.
High Frequency: Multiple trades per day depending on opportunities.
Focus on Liquidity: Traders choose highly liquid stocks or instruments.
Leverage Usage: Intraday traders often use margin to amplify profits.
Technical Analysis Driven: Relies heavily on charts, price action, and indicators.
Goals of Intraday Traders
Capture small price movements (scalping 0.5–2% moves).
Consistent daily profits rather than waiting for big gains.
Quick decision-making, discipline, and risk management.
2. Understanding Swing Trading
Definition
Swing trading refers to holding positions for a few days to weeks, aiming to capture medium-term price swings. Traders ride upward or downward trends without reacting to every tick.
Characteristics of Swing Trading
Longer Holding Period: From 2–3 days up to several weeks.
Lower Frequency: Fewer trades, but larger profit targets.
Combination of Technical & Fundamental Analysis: Uses chart patterns, moving averages, and sometimes earnings or macroeconomic events.
Tolerance for Overnight Risk: Accepts gaps due to news or global events.
Less Screen Time: Traders analyze at the end of the day and monitor broadly.
Goals of Swing Traders
Catch larger moves (5–20% swings).
Trade with the trend, not intraday noise.
Balance between active trading and long-term investing.
3. Key Differences Between Intraday and Swing Trading
Aspect Intraday Trading Swing Trading
Holding Period Minutes to hours, closed same day Days to weeks
Frequency Many trades daily Few trades monthly
Capital Requirement Lower due to leverage Higher, requires holding without leverage
Risk Level Very high (market noise, leverage) Moderate (overnight risk, but less noise)
Profit Target Small per trade (0.5–2%) Larger per trade (5–20%)
Tools Intraday charts (1-min, 5-min, 15-min) Daily/weekly charts
Time Commitment Full-time, glued to screen Part-time, end-of-day monitoring
Stress Level High, fast decisions needed Lower, patience-based
Best for Aggressive, disciplined traders Patient, trend-following traders
4. Tools & Techniques
Tools for Intraday Trading
Short-term Charts – 1-min, 5-min, 15-min candles.
Indicators – VWAP, RSI, MACD, Bollinger Bands.
Order Types – Market orders, stop-loss, bracket orders.
News Feeds – Corporate announcements, economic data.
Scanners – For identifying stocks with volume and volatility.
Tools for Swing Trading
Daily/Weekly Charts – Identify broader trends.
Indicators – Moving averages (50, 200), RSI, Fibonacci retracement.
Patterns – Head & shoulders, flags, double tops/bottoms.
Fundamentals – Earnings reports, sector trends.
Portfolio Management – Diversification across sectors.
5. Risk & Reward
Intraday Trading Risks
Sudden intraday volatility.
High leverage leading to amplified losses.
Emotional stress leading to overtrading.
Market manipulation in low-volume stocks.
Swing Trading Risks
Overnight gaps due to news or events.
Holding during earnings or geopolitical announcements.
Misjudging long-term trend direction.
Reward Potential
Intraday: Small but frequent gains.
Swing: Fewer but larger gains.
6. Psychology Behind Each Style
Intraday Trader Psychology
Must be quick, disciplined, unemotional.
Can’t afford hesitation; seconds matter.
Needs mental stamina for long hours.
Swing Trader Psychology
Requires patience and conviction in the analysis.
Should handle overnight anxiety calmly.
Avoids micromanaging every tick.
7. Which Style Suits You?
Intraday Trading Suits If:
You can dedicate 6–7 hours daily.
You thrive in fast decision-making.
You handle stress well.
You prefer quick profits.
Swing Trading Suits If:
You have a job or business, can’t sit full-time.
You are patient and prefer analyzing trends.
You’re comfortable holding overnight risk.
You seek balanced trading with less stress.
8. Real-World Example
Imagine Stock XYZ at ₹1000:
Intraday Trader: Buys at ₹1000, sells at ₹1010 same day, booking 1% profit. May repeat 5–10 trades.
Swing Trader: Buys at ₹1000, holds for a week till ₹1150, booking 15% profit. Only 1 trade, but larger reward.
9. Pros & Cons
Pros of Intraday Trading
Quick returns.
Leverage available.
Daily learning experience.
No overnight risk.
Cons of Intraday Trading
Extremely stressful.
High brokerage costs.
Demands full-time attention.
High failure rate for beginners.
Pros of Swing Trading
Less screen time.
Larger profits per trade.
Flexibility to combine with job.
Trend-friendly.
Cons of Swing Trading
Overnight risk.
Requires patience.
Slow capital turnover.
Emotional swings if market gaps down.
10. Conclusion
Intraday and swing trading are two distinct paths to profit from markets. Neither is inherently better — it depends on one’s personality, risk appetite, and lifestyle.
If you thrive in fast-paced environments, can manage stress, and want quick daily profits, intraday trading is suitable.
If you prefer patience, less stress, and bigger swings, and don’t want to monitor markets constantly, swing trading is more fitting.
Ultimately, the best traders often experiment with both, learn their strengths, and settle into the style that complements their psychology. Success depends not just on the strategy, but on discipline, money management, and continuous learning.
Risk Smart, Grow Fast in TradingIntroduction
Trading has always been seen as a path to quick money, fast success, and even financial freedom. But the truth is that trading is not a get-rich-quick game. For every successful trader who grows fast, there are hundreds who lose money because they ignore the most important foundation of trading: risk management.
“Risk Smart, Grow Fast” is not just a catchy phrase. It’s a principle, a mindset, and a strategy. It means that if you manage your risks wisely, protect your capital, and make decisions with discipline, you can grow faster and more sustainably than if you blindly chase high returns. In fact, smart risk management is the engine that powers growth in trading.
This essay explores the philosophy, strategies, tools, and psychology behind trading with a “Risk Smart, Grow Fast” approach.
Part 1: Why Risk Management Is More Important Than Profit
Most new traders focus on one question: “How much can I make?” The right question, however, is: “How much can I lose if I’m wrong?”
In trading, risk always comes before reward. Here’s why:
Capital Preservation – Without capital, there’s no trading. Losing 50% of your account requires a 100% gain to break even. Protecting your downside ensures you stay in the game.
Compounding Effect – Smaller drawdowns allow compounding to work more efficiently. Even modest profits can grow exponentially when losses are controlled.
Emotional Stability – Large losses trigger fear, stress, and revenge trading. Smart risk control keeps emotions in check, enabling rational decision-making.
Sustainable Growth – Fast growth through reckless risk-taking often ends in collapse. True fast growth comes from controlled risk that compounds over time.
Key Idea: You cannot grow fast unless you manage risk smartly.
Part 2: What Does “Risk Smart” Really Mean?
Being risk smart doesn’t mean avoiding risk altogether. Trading is risk by nature; without risk, there is no reward. Instead, it means taking calculated risks that are aligned with your trading strategy, capital, and goals.
Core principles of being Risk Smart:
Position Sizing – Risking only a small percentage of your capital on each trade (usually 1–2%).
Stop Loss Discipline – Always knowing where you will exit if the trade goes wrong.
Diversification – Not putting all capital into one stock, sector, or instrument.
Risk/Reward Ratio – Ensuring potential reward is at least 2–3 times the risk.
Capital Allocation – Spreading money between short-term trades, long-term investments, and safe reserves.
Think of being risk smart like wearing a seatbelt while driving fast. You may enjoy the thrill of speed, but the seatbelt ensures survival if things go wrong.
Part 3: The Growth Mindset in Trading
While being risk smart focuses on protection, “grow fast” focuses on maximizing opportunities. Growth in trading is not just about profits, but also about knowledge, experience, and adaptability.
Components of the Growth Mindset:
Learning from Losses – Every loss is tuition. Smart traders don’t fear losses; they analyze them to refine strategies.
Adapting to Market Conditions – Markets change; strategies must evolve. What works in a trending market may fail in a choppy one.
Scaling Up Gradually – Growing fast doesn’t mean doubling your risk overnight. It means compounding small consistent gains until you can trade larger with confidence.
Leveraging Technology – Using charting tools, algo trading, backtesting, and data analytics to grow faster than traditional traders.
Mind and Body Discipline – Growth requires sharp focus, emotional control, and physical health. Trading is mental warfare; stamina matters.
Part 4: Balancing Risk and Growth
The challenge is balancing risk smart and grow fast. Too much focus on risk may lead to over-caution, missing opportunities. Too much focus on growth may cause reckless risk-taking.
Here’s how to strike the balance:
Risk Small, Scale Big – Start by risking 1–2% per trade. As your capital grows, absolute profits grow faster.
Compound Gains – Reinvest profits strategically instead of withdrawing all earnings.
Optimize Position Sizing – Adjust size based on volatility, conviction, and account size.
Use Asymmetric Setups – Look for trades where upside is significantly greater than downside.
Review Weekly, Act Daily – Analyze risk exposure weekly while executing growth trades daily.
Part 5: Practical Risk Smart Techniques
The 1% Rule – Never risk more than 1% of account value on a single trade.
Example: With $10,000 capital, maximum risk per trade = $100.
The 2:1 or 3:1 Rule – For every $1 risked, aim to make $2–$3.
Stop Loss & Trailing Stops – Set stop losses for protection and use trailing stops to lock profits as the trade moves in your favor.
Risk Diversification –
Across asset classes (stocks, forex, commodities, crypto).
Across sectors (IT, pharma, banking).
Across time horizons (scalping, swing, long-term).
Hedging with Options – Using protective puts or covered calls to cap downside risk.
Volatility Awareness – Adjusting position size based on market volatility (e.g., smaller trades during high VIX).
Part 6: Strategies to Grow Fast
Trend Following – Capturing large moves in trending markets. “The trend is your friend” until it bends.
Breakout Trading – Entering when price breaks major support/resistance levels with volume confirmation.
Swing Trading – Exploiting short- to medium-term price swings for consistent growth.
Position Trading – Holding positions for weeks/months based on macro or sectoral trends.
Leverage Smartly – Using moderate leverage to accelerate growth, but only when risk is tightly controlled.
Scaling In and Out – Adding to winning trades (pyramiding) and reducing exposure on uncertainty.
Part 7: Psychology of Risk Smart Growth
Trading success is 20% strategy and 80% psychology. To “risk smart, grow fast,” a trader must master their mind.
Discipline Over Impulse – Following the plan, not emotions.
Patience to Wait – Avoiding overtrading. Opportunities will always come.
Resilience to Losses – Viewing losses as part of the game, not personal failure.
Confidence Without Arrogance – Trusting your system but staying humble before markets.
Growth Mindset – Believing that skills improve with practice, not fixed by talent.
Part 8: Case Studies
Case 1: The Reckless Trader
Rahul had ₹5 lakhs and doubled it in 3 months by taking huge leveraged bets on penny stocks. But one wrong move wiped out 80% of his capital. His fast growth collapsed because he was not risk smart.
Case 2: The Risk Smart Trader
Anita had ₹5 lakhs too. She risked only 1% per trade, focused on high R/R setups, and compounded profits. In one year, she grew her account to ₹7.5 lakhs steadily. She didn’t double it overnight, but her growth was sustainable and replicable.
Lesson: Fast reckless growth often leads to collapse. Risk smart growth compounds wealth.
Part 9: Tools for Risk Smart Growth
Trading Journal – Records trades, mistakes, emotions, and improvements.
Risk Calculators – To determine position size before placing a trade.
Charting Platforms – TradingView, MetaTrader, NinjaTrader.
Backtesting Software – To validate strategies before applying real capital.
News & Data Feeds – For staying ahead of market-moving events.
AI & Algo Tools – Automating discipline and minimizing emotional decisions.
Part 10: The Roadmap to “Risk Smart, Grow Fast”
Foundation – Learn basics, risk management, and trading psychology.
System Development – Build and backtest your own trading strategy.
Capital Protection – Apply strict stop losses and position sizing.
Small Scale Trading – Start with small capital or paper trading.
Gradual Scaling – Increase trade size as consistency improves.
Compounding Phase – Reinvest profits to accelerate growth.
Mastery & Automation – Use technology and delegation for efficiency.
Conclusion
“Risk Smart, Grow Fast” is not just a slogan—it’s the essence of long-term trading success. The markets will always remain uncertain, volatile, and risky. But if you respect risk, embrace discipline, and use smart strategies, you can not only survive but thrive.
Fast growth in trading doesn’t come from reckless gambling—it comes from the slow magic of compounding, powered by smart risk management.
In the end, trading is like sailing. The winds of the market are unpredictable, but if you set your sails wisely, control your risks, and ride the waves with patience, you can reach your destination faster than you ever imagined.