GOLD TRADING INSIGHTS TODAY WITH LUCYGOLD TRADING INSIGHTS TODAY WITH LUCY 💛
Hello everyone 🌸
The gold market (XAUUSD) today is showing many interesting signals as the price continues to test the crucial trendline area. Traders' sentiment is quite cautious at the moment – both buyers and sellers are “squaring off” around the liquidity balance zone.
🔍 Technical Analysis
On the chart, gold is moving within a narrowing triangle price channel – this indicates momentum is accumulating, and when the price breaks in either direction, the subsequent volatility will be very strong ⚡
Currently, the price is reacting around the main trendline, but there is no clear breakout signal yet.
In my personal view, the probability of a decline remains higher, however, further confirmation is needed before entering a trade.
The important point to note is the support area at 3965, which is the key boundary to confirm a clear downtrend.
If the price breaks through this area, the possibility of extending towards the Fibonacci 2.618 area around 3890 is entirely possible.
⚙️ Price Levels to Watch
Currently, the 3990 – 4012 area is short-term resistance, where sellers may reappear.
Meanwhile, the 3965 – 3945 – 3920 areas are the main supports that need close observation.
If the price continues to hold above 3945, the likelihood of a short-term rebound is quite high.
🎯 Today's Trading Scenario
💼 Buy: 3945
⛔ SL: 3938
🎯 TP: 3958 – 3977 – 3992 – 4012
💼 Sell: When the price clearly breaks below support 3965
⛔ SL: Above the breakout area
🎯 Expected TP: extending towards the Fibonacci 2.618 area around 3890
I still prefer to observe the price reaction at the trendline area, and only act when there is clear confirmation — because in a triangle pattern, the patient one will always be the winner 🌙
⚠️ Note & Conclusion
The above analysis reflects only Lucy's personal perspective, based on Trendline – Fibonacci – ICT factors 📊
This is not investment advice.
Please share your views on gold in the comments section 💬
And don't forget to follow Lucy for daily updates on insightful analyses —
where technical analysis merges with market emotions 💫🌸
Ict

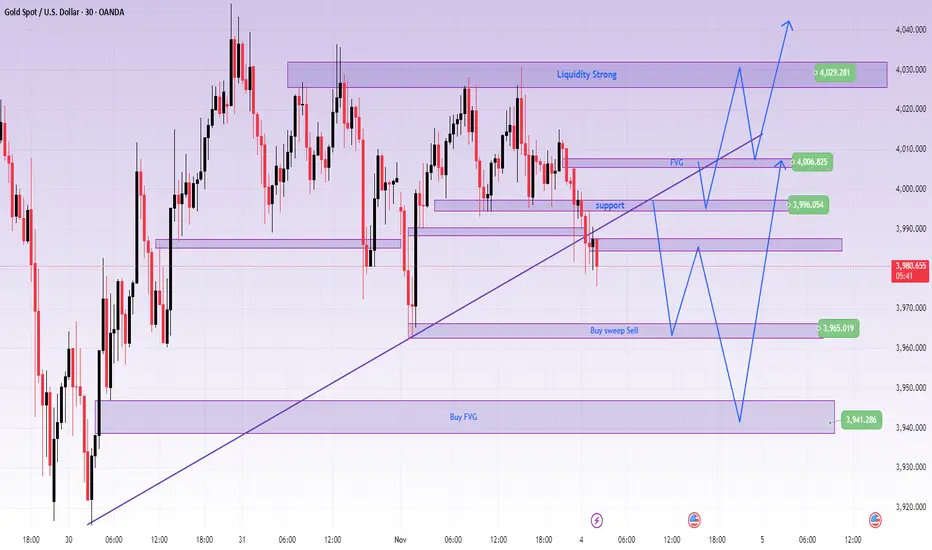
GOLD CONFIRMS SHORT-TERM DECLINE AFTER BREAKING TRENDLINEXAUUSD – GOLD CONFIRMS SHORT-TERM DECLINE AFTER BREAKING TRENDLINE
🪞 1. Overview
🌤️ In the Asian session this morning, gold broke the upward trendline even though the selling pressure wasn't particularly strong.
However, this is the first signal indicating that the short-term trend is leaning towards the sellers.
💬 Currently, the 3996 level is a significant resistance, and the price might retest this area before continuing to decline.
If the price surpasses the FVG at 4007, the trend might temporarily rebound in the short term.
💹 2. Technical Analysis (ICT Perspective)
🔸 Market structure: After breaking the trend, the structure temporarily shifts to short-term bearish.
🔸 Liquidity & FVG: Liquidity is drawn to the 3960–3940 area, while FVG 4007 is the first barrier.
🔸 Order Flow: Smart Money may lightly sweep up to the resistance area before pushing the price further down.
🎯 3. Reference Trading Scenarios
💔 MAIN SELL
Entry: 3996 | SL: 4004
TP: 3985 – 3972 – 3948
💢 SELL scalping
Entry: 4007 | SL: 4014
TP: 3998 – 3978
💖 REACTIVE BUY
Entry: 3965 | SL: 3957
TP: 3976 – 3988 – 3999
🌸 DEEP BUY
Entry: 3941 | SL: 3931
TP: 3955 – 3968 – 3988 – 4012 – 4066
🔍 4. Price Levels to Note
✨ 4007 → FVG resistance, short-term trend confirmation area
✨ 3996 → Retest area of the broken trendline
✨ 3965 – 3941 → Strong support area, likely to see reversal reactions
💬 5. Notes & Call for Interaction
⚠️ This is not an investment recommendation, but merely a personal technical perspective following the ICT method.
Observe the price reaction around the trendline carefully before making a decision 💭
If you find this post helpful, please 💛 like – 💬 leave a comment – 🔔 follow LanaM2
to stay updated with daily gold insights and learn more about the Smart Money Concept 🌷✨
Weekly & Daily BTC analysis of 10R Opportunity........On HTF weekly and daily BTC is forming good scenarios for bearish trade. Price is consolidating at higher levels for last couple of weeks and showing value adjustment in BTC. Price already shot up a lot and we may see a short term pull back.
1. BTC has created CISD after taking liquidity at weekly level and tested weekly iFVG.
2. It has also created 1D FVG and 4H FVG and iFVG over lapping. creating cluster of CEs. Which might be a Good POI for sell side opportunity.
3. Technically we are already into a weekly down side scenario. Further price is approaching Daily and 4 Hourly FVGs for possible re-entry opportunities.
4. RSI has also already shown a bearish divergence on weekly level.
5. Most probably price will take liquidity of FVG and create MSS/CISD/TS/iFVG in LTF.
6. Price should show rejection/reversal in respective LTF (1H/15m) at FVG zone.
7. Take the trade only once clear entry model i.e. turtle soup. iFVG break, CDS or MSS happens on LTF
All these combinations are signalling a high probability and ~10R trade scenario.
Note – if you liked this analysis, please boost the idea so that other can also get benefit of it. Also follow me for notification for incoming ideas.
Also Feel free to comment if you have any input to share.
Disclaimer – This analysis is just for education purpose not any trading suggestion. Please take the trade at your own risk and with the discussion with your financial advisor.

BTC forming wonderful scenarioBTC is forming good scenarios for bullish and subsequently bearish trade. It has created ABC pattern and retracing back to bullish FVG. We need to wait for price getting into right zones. We may also see a sell side trade once reaches to bearish FVG.
1. Currently price has broken ABC pattern neckline and retracing towards 1h FVG.
2. We may also see a sell side trade once price tap into bearish FVG and shows reversal pattern.
3. Most probably price will take liquidity of FVG and create MSS/CISD/TS/iFVG in LTF.
4. Price should show rejection/reversal in LTF (5m,1m) at FVG zone.
5. Take the trade only once clear entry model i.e. turtle soup. iFVG break, CDS or MSS happens on LTF
All these combinations are signalling a high probability and ~4R trade scenario.
Note – if you liked this analysis, please boost the idea so that other can also get benefit of it. Also follow me for notification for incoming ideas.
Also Feel free to comment if you have any input to share.
Disclaimer – This analysis is just for education purpose not any trading suggestion. Please take the trade at your own risk and with the discussion with your financial advisor.

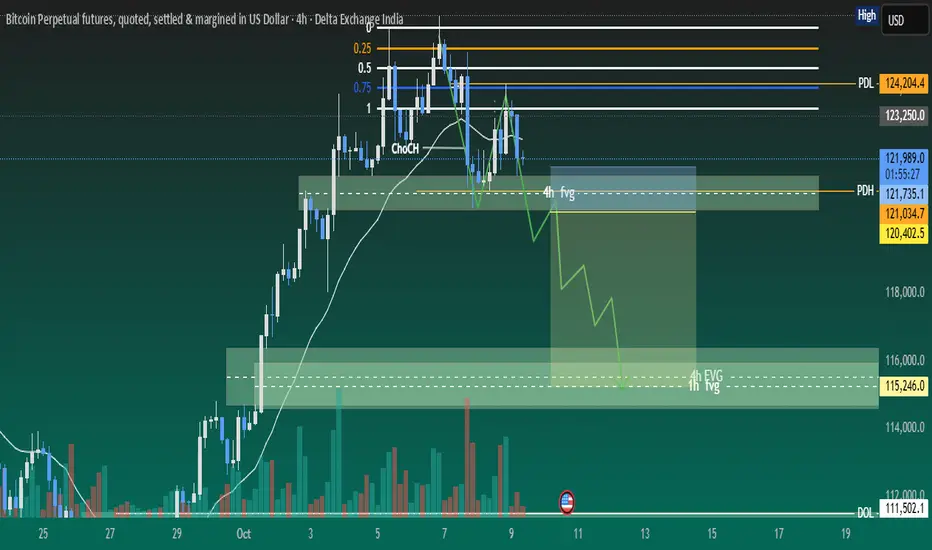
BTC is developing ~4R down side tradeBTC has done MSS on 4h time frame and showing rejection at 4H FVG after displacement. We can see a good downside trade once below FVG is mitigated and changed to iFVG. We need to wait for price getting into right zones.
1. Currently price is moving inside 4H FVG after displacement and showing rejection as well.
2. Price should break below FVG and retest.
3. There are several SIBIs which may be target for it and further buy side reversal trade.
4. RSI has already shown bearish divergence. Which support coming down move.
5. Most probably price will take liquidity of FVG and create MSS/CISD/TS/iFVG in LTF.
6. Price should show rejection/reversal in LTF (5m,1m) at FVG zone.
7. Take the trade only once clear any of the entry model i.e. turtle soup. iFVG break, CDS or MSS happens on LTF
All these combinations are signalling a high probability and ~4R trade scenario.
Note – if you liked this analysis, please boost the idea so that other can also get benefit of it. Also follow me for notification for incoming ideas.
Also Feel free to comment if you have any input to share.
Disclaimer – This analysis is just for education purpose not any trading suggestion. Please take the trade at your own risk and with the discussion with your financial advisor.
Beautiful 6R BTC trade scenariosBTC is forming both buy and sell side trades as the price is in critical zone. BTC will possibly give us both side good trades. We need to wait for price getting into right zones.
1. Currently price is moving around daily and 4H gradient levels.
2. 125275 level is creating a gradient cluster of both 1d and 4h time frame. Which may give us a good sell side trade if price show clear reversal signals.
3. There is an 1hour iFVG if price takes liquidity of it, most probably it will touch gradient cluster level and good sell scenario may be confirmed.
4. There are several SIBIs which may be target for it and further buy side reversal trade.
5. Buy side reversal trade may be good trade as overall BTC order flow is upside.
6. Most probably price will take liquidity of FVGs and create MSS/CISD/TS/iFVG in LTF.
7. Price should show rejection/reversal in LTF (5m,1m) at FVG zone.
All these combinations are signalling a high probability and 5.5R trade scenario.
Note – if you liked this analysis, please boost the idea so that other can also get benefit of it. Also follow me for notification for incoming ideas.
Also Feel free to comment if you have any input to share.
Disclaimer – This analysis is just for education purpose not any trading suggestion. Please take the trade at your own risk and with the discussion with your financial advisor.

ETHUSD 2.5R sell side trade scenarioETHUSD is forming sell side trades as current bias and draw on liquidity both are at down side. Price has also left SIBIs to attract price upside for a while and then return back to target. In weekend price may have low volatility and trade possibly generate on Monday or later.
1. There is a daily time frame bearish FVG.
2. There is bearish FVG in 4H TF. Now price is approaching it slowly.
3. These FVGs are forming inside OTE zone.
4. Order flow is bearish. And draw on liquidity is also at downside.
5. Most probably price will take liquidity of FVGs and create MSS/CISD/TS/iFVG in LTF.
6. Price should show rejection/reversal in LTF (5m,1m) at FVG zone.
7. BTC is also forming similar scenario.
All these combinations are signalling a high probability and 2.5R trade scenario.
Note – if you liked this analysis, please boost the idea so that other can also get benefit of it. Also follow me for notification for incoming ideas.
Also Feel free to comment if you have any input to share.
Disclaimer – This analysis is just for education purpose not any trading suggestion. Please take the trade at your own risk and with the discussion with your financial advisor.

BTCUSD 3R Sell side trade BTCUSD is forming sell side trade as current bias and draw on liquidity both are at down side. Price has also left SIBIs to attract price upside for a while and then return back to target. In weekend price may have low volatility and trade possibly generate on Monday or later.
1. There is a 4H time frame bearish FVG.
2. There is bearish FVG in 1H and 30m overlapping with 4H FVG. Now price is approaching it slowly.
3. These FVGs are forming inside Fib golden zone.
4. Order flow is bearish. And draw on liquidity is also at downside.
5. Most probably price will take liquidity of FVGs and create MSS/CISD/TS/iFVG in LTF.
6. Price should show rejection/reversal in LTF (5m,1m) at FVG zone.
All these combinations are signalling a high probability and 3R trade scenario.
Note – if you liked this analysis, please boost the idea so that other can also get benefit of it. Also follow me for notification for incoming ideas.
Also Feel free to comment if you have any input to share.
Disclaimer – This analysis is just for education purpose not any trading suggestion. Please take the trade at your own risk and with the discussion with your financial advisor.

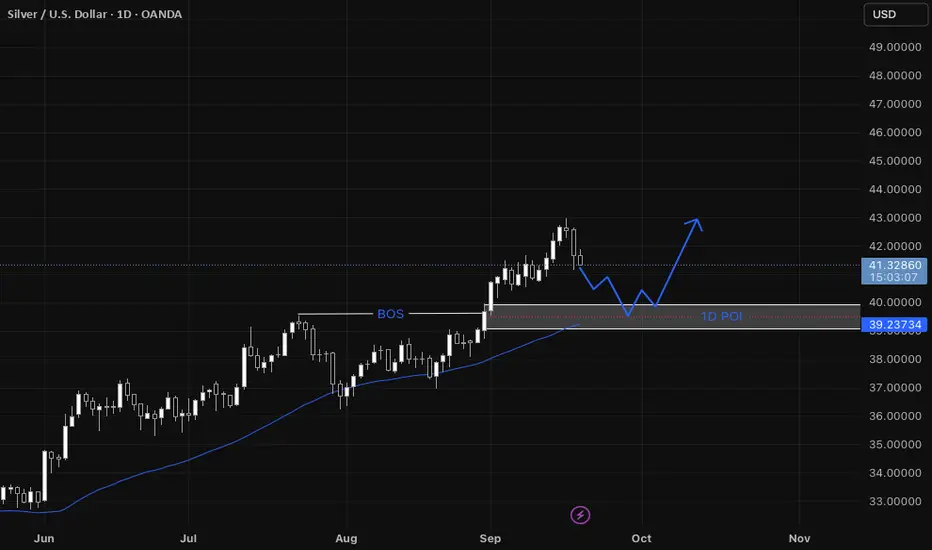
XAGUSD Step-by-step entry plan for XAGUSD
1. We have our Daily Point of Interest (POI)
- On the daily a zone that contains:
* a fair value gap (FVG),
* a break of structure (BOS) that previously acted as resistance and is now expected to act as support, and
* support from the 44 SMA.
2. Wait for price to return to the Daily POI
- Only consider the setup if price actually comes back into that daily POI zone.
3. Switch to the 1-hour timeframe to refine the entry
- Look for a shift in structure on the 1-hour (i.e., evidence that momentum is shifting bullish: BOS to the upside, higher highs/higher lows).
4. Confirm a 1-hour fair value gap forms
- The structure shift on 1-hour should create a 1-hour FVG (a short intraday imbalance).
5. Wait for the 1-hour FVG to be filled
- Let price fill that 1-hour FVG (price moves into/through the gap).
6. Look for a bullish confirmation on the filled 1-hour FVG
- After the fill, require a clear bullish formation on 1-hour (examples: bullish engulfing candle, strong demand candle, a higher-low + rejection wick).
7. Enter on the 1-hour bullish confirmation
- Enter when price breaks the confirmation level (e.g., breaks above the local 1-hour high formed by the bullish setup) or on a confirmed bullish candle close per your entry rules.
USDJPY Sell entry 1::5 RnRUSDJPY is forming a beautiful day trade for selling side. It can be a very good intraday trade if everything goes as per plan.
1. Price kissed 4H Iceberg Block and showed sniper liquidity and left bearish FVGs at both 30m and 15m.
2. 15m FVG is inside 30m FVG and upper side of OTE area.
3. Now it is moving toward FVG areas after taking reversal from bullish 15m BPR
4. Most probably price will take liquidity of FVG and OTE zone and create MSS in LTF.
5. Order flow confirming bearish bias.
6. Price should show rejection/reversal in LTF (5m,1m) at FVG zone.
All these combinations are signalling a high probability and high Risk and Reward (1:5) trade scenario.
Note – if you liked this analysis, please boost the idea so that other can also get benefit of it. Also follow me for notification for incoming ideas.
Also Feel free to comment if you have any input to share.
Disclaimer – This analysis is just for education purpose not any trading suggestion. Please take the trade at your own risk and with the discussion with your financial advisor.

Gold (XAUUSD) 1:4 intraday buy scenario.Gold is in up move and forming a good buy scenario on 30/15-minute chart. It can be a very good intraday trade if everything goes as per plan.
1. 30/15m bullish FVG is pending and price is showing pull back towards it.
2. Most probably price will take liquidity of FVG and OTE zone and create MSS in LTF.
3. Order flow confirming bullish bias.
4. Price should show rejection/reversal in LTF at FVG zone.
All these combinations are signalling a high probability and high Risk and Reward (1:4) trade scenario.
Note – if you liked this analysis, please boost the idea so that other can also get benefit of it. Also follow me for notification for incoming ideas.
Also Feel free to comment if you have any input to share.
Disclaimer – This analysis is just for education purpose not any trading suggestion. Please take the trade at your own risk and with the discussion with your financial advisor.

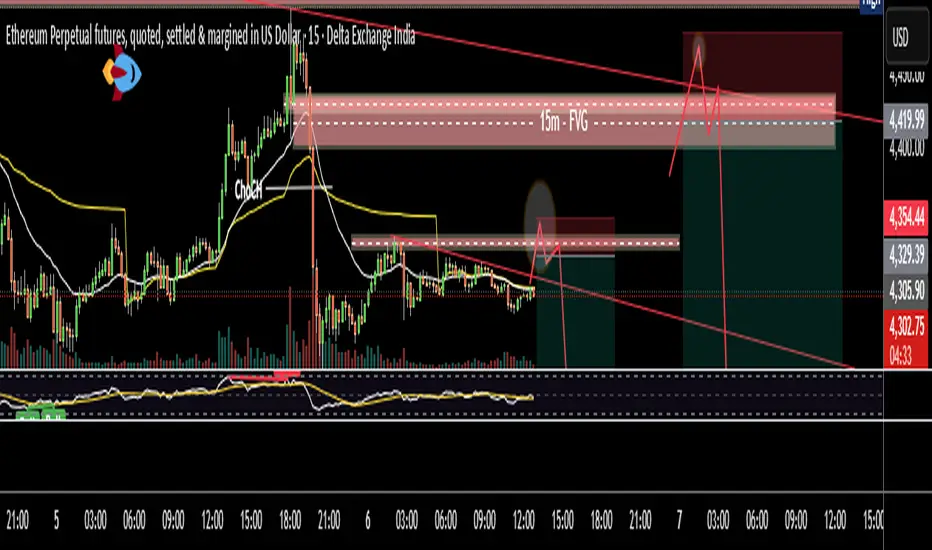
BTC developing a good sell opportunityBTC is moving in range for long time. Now it has shown a displacement after ChoCH and formed a bearish 15m FVG. There may be a good trade at sell side if price approach it. Well there are two trade scenarios are forming.
1. Price moves to 15m FVG and OTE overlap zone.
2. Most probably price will take liquidity of FVG and OTE zone and create MSS in LTF.
3. After breaking trend line it should pullback till FVG/trend line or any newly created OB/FVG.
All these combinations are signalling a high probability and high Risk and Reward (1:8) trade scenario.
Note – if you liked this analysis, please boost the idea so that other can also get benefit of it. Also follow me for notification for incoming ideas.
Also Feel free to comment if you have any input to share.
Disclaimer – This analysis is just for education purpose not any trading suggestion. Please take the trade at your own risk and with the discussion with your financial advisor.

ETH multiple Sell OpportunitiesETH is moving in range for almost a week time. Now it has shown a displacement after ChoCH and formed a bearish 15m FVG. There may be a good trade at sell side if price approach it. Well there are two trade scenarios are forming.
Trade # 1
1. Price is moving around a short term trend line and resistance.
2. If price breaks trend line and take the liquidity of resistance than it may be sell trade.
Trade # 2
3. Price moves to 15m FVG and OTE overlap zone.
4. Most probably price will take liquidity of FVG zone and break trend line.
5. After breaking trend line it should pullback till FVG/trend line or any newly created OB/FVG.
All these combinations are signaling a high probability and high Risk and Reward (1:8) trade scenario.
Note – if you liked this analysis, please boost the idea so that other can also get benefit of it. Also follow me for notification for incoming ideas.
Also Feel free to comment if you have any input to share.
Disclaimer – This analysis is just for education purpose not any trading suggestion. Please take the trade at your own risk and with the discussion with your financial advisor.
Gold (XAUUSD) forming wonderful sell scenarioGoldUSD price is moving at higher side and showing weakness. It is also forming double top kind of scenario. We may see a good short trade if liquidity sweep is witness at the resistance level with the additional confirmation of higher volume. Overall trend is still upside but buyers seems exhausted. We may find a good sell trade if Liquidity sweeps at resistance and everything goes as we planned.
1. Price is approaching 4H resistance zone. Which may act as a strong supply zone.
2. Buying is slow and weak.
3. Most probably price will take liquidity of resistance zone and break trend line.
4. After breaking trend line it should pullback till resistance/trend line or any newly created OB/FVG.
All these combinations are signalling a high probability and high Risk and Reward (1:8) trade scenario.
Note – if you liked this analysis, please boost the idea so that other can also get benefit of it. Also follow me for notification for incoming ideas.
Also Feel free to comment if you have any input to share.
Disclaimer – This analysis is just for education purpose not any trading suggestion. Please take the trade at your own risk and with the discussion with your financial advisor.

NZDUSD Forming a Great Sell side scenario....NZDJPY is approaching 4H resistance zone, which has already show rejection previously. There is also a steep bullish trend line creating a confluence. There is a valid 4H FVG at upside. All these things signalling a coming very good sell side opportunity. Below are points detailing the same.
1. Price is approaching 4H resistance zone. Which may act as a strong supply zone.
2. Very steep Bullish Trend line developing a confluence at resistance. Steep trend line is always prone for breakout/breakdown.
3. Most probably price will take liquidity of resistance zone and break trend line.
4. After breaking trend line it should pullback till resistance/trend line or any newly created OB/FVG.
5. There are two possible reversal point 1. At nearest resistance. 2. At 4H FVG and higher trendline.
All these combinations are signalling a high probability and high Risk and Reward (1:8) trade scenario.
Note – if you liked this analysis, please boost the idea so that other can also get benefit of it. Also follow me for notification for incoming ideas.
Also Feel free to comment if you have any input to share.
Disclaimer – This analysis is just for education purpose not any trading suggestion. Please take the trade at your own risk and with the discussion with your financial advisor.

1:7 RnR trade opportunity on GBPCADGBPCAD is forming a great price action and scenario. Which may lead to high risk and reward trade. Below are the signals noticed ...
1. Price has broken 10 days’ consolidation of trend line and nearby resistance as well.
2. Created BOS and FVG on 1-hour time frame in discount area.
3. Price is running above VWAP and 21 EMA. And 21 EMA crossing over VWAP.
4. Now we can expect a pullback till FVG area.
All these combinations are signalling a high probability and high RnR (1:7) trade scenario.
Note – if liked this analysis, please boost the idea so that other can also get benefit of it. Also follow me for notification for incoming ideas.
Disclaimer – This analysis is just for education purpose not any trading suggestion. Please take the trade at your own risk and with the discussion with your financial advisor.

XAUUSD SD + OTE Long Trade (Smart Money Logic)This is my recent LONG trade on OANDA:XAUUSD on the 15 min chart.
When everyone was waiting to SHORT , I was waiting patiently in my LONG position.
Entry :
$3378 - Order Block + FVG + 0.5 Optimal Trade Entry level
Exit :
1st Target - $3400 (Standard Deviation Target 1 + 3400 psychological level)
2nd Target - $3418 (Standard Deviation Target 2)
NOTE: Smart Money DOES NOT HUNT stoplosses , they trigger their positions slightly below where they find maximum liquidity, because their positions are WAY TOO HUGE and need all the anti-orders (buy/sell stops) basically buy side or sell side liquidity so that they can fill in their orders. They are literally there to HELP YOU push the price up or down, you just need to place your stoplosses right! not too tight not too far off which may cause market structure shifts. SLs need to be absolutely perfect
Trade Explanation :
OANDA:XAUUSD should have used the 1D Bearish Order Block and we should have seen a fall or at least a decent enough retracement, but only 1 thing saved us, that is 15 min Bullish INDUCMENT and 1H BIAS . I never entered in a short trade!
I hope everyone saw these liquidity pools at the bottom and waited for them to get swept, but yeah, not always will liquidity be hunted right? Pools are areas with the most number of orders + stops. So aren't they supposed to be a good thing? :)
So, yes, DAILY bias is good, but again, LTF bias is also very necessary. Markets won't always respect the DAILY bias. Else, they would always be stuck in a sideways momentum right?
Think about it!
Also, do let me know in the comments what you feel about this trade and also share your analysis!

Buy Opportunity in USOILAn upside opportunity is being developed. Scenario.
1. Choch has happened and price retracing towards FVG.
2. it is also taking support from trendlines.
3. If price rejects with volume in FVG zone, it may lead to good upside trade.
P.s. - It is just analysis not trading recommendation.

EURJPY - SD + OTE + FVG Long EntryFX:EURJPY - Analysis on the 15min TimeFrame.
(Look at the charts for all the levels)
1. Bullish IDM
2. 15min Bullish FVG tapped
3. Optimal Trade Entry ( OTE ) level 0.5 tapped
4. Standard Deviation ( SD ) TP 1 will be used as Target
5. Bearish 15min Order Block is also aligned with SD and can be used as target as well
6. SL - just below last 15min Bullish Order Block
Entry is triggered, let's see if this trade hits TP or SL.
Also, I'd love to hear your analysis as well. What do you guys think? Let me know in the comments

USD/JPY SD + OTE + PD Array AnalysisStandard Deviation Entry Model on FOREXCOM:USDJPY
1. Inducement on 15min TF
2. Targets + Mini reversal zones marked out
3. 1H PD Array (FVG) Equilibrium tapped
4. Entry Triggered
5. 1st Target HIT
6. Waiting for Standard Deviation ultimate target to hit
I'll like to know more your thoughts on this!
Share your analysis as well!

XAUUSD - SD + OTE + PD Array Entry/ExitThis long trade in XAUUSD includes cumulative entry and exit models.
1. SD - Standard Deviation Target 1 - 3274
Standard Deviation Target 2 - 3408
2. OTE - Optimal Trade Entry ( Equilibrium + 40 pips)
3. PD Array - 4H/15m FVG (caused due to CPI news)
PD array + OTE overlapping perfectly, so there's double confirmation.
Last manipulative leg before IDM (Inducement) and MSS (Market Structure Shift) taken for predicting Standard Deviation Targets.
This is a 1D + 4H PD array at play, with Liquidity of previous weekly candle already taken. So it's very possible that trade hits both of our targets.
Already 333pips captured in this trade, waiting for more, let's see what happens!
Share your thoughts and analysis below in the comments.
I'd honestly like to know about your opinion :)

AUD/JPY SHORT Standard Deviation Projection TargetsThis analysis forcasts a current SHORT trade in AUD/JPY , with Standard Deviation targets + OTE model aliginging with PD Arrays.
1. SD Target 1 - 95.170
2. SD Target 2 - 94.085
Share your thoughts on this!
Follow for more!

BTC - OTE + SD Bearish Targets- As per my previous analysis, BTC Long targets were achieved perfectly and exactly from those levels a selling was expected. So, we hopped on to a SHORT trade at the TOP.
1. OTE (Optimal Trade Entry)
2. Bearish SD Targets (Standard Deviation Projections)
- Short Trade TP1 and TP2 are completed, which is almost 3000 points!
- Waiting for TP3
Do drop in your thoughts about this trade!
CRYPTO:BTCUSD Let's HODL!
