Tata Motors Ltd //1day Supoort and ResistanceAs of May 3, 2025, here are the key 1-day support and resistance levels for Tata Motors Ltd (NSE: TATAMOTORS):
📊 1-Day Support and Resistance Levels
Level Price (₹) Type
Support 1 703
Support 2 690
Support 3 683
Resistance 1 724
Resistance 2 731
Resistance 3 744
These levels are derived from the classic pivot point method and are crucial for traders to monitor, as movements beyond these points may indicate potential changes in the stock's trend.
🔍 Technical Indicators
As of the latest available data:
Relative Strength Index (RSI): 47.9, indicating neutral momentum.
Stochastic RSI: 0.33, suggesting a downtrend.
Commodity Channel Index (CCI): 32.01, reflecting neutral momentum.
Money Flow Index (MFI): 65.42, indicating an uptrend.
These indicators suggest a neutral to slightly bullish outlook for the stock.
📈 Strategy Considerations
Bullish Scenario: If the stock price maintains above the support levels, particularly Support 1 at ₹703, it may continue its upward movement towards Resistance 1 at ₹724.
Bearish Scenario: A drop below Support 1 could signal a potential reversal or consolidation phase.
Please note that these levels are based on historical data and should be used in conjunction with other technical analysis tools and market conditions.
IDFC

NIFTY 50 INDEX
NIFTY 50 | Impulse Rally Nearing Completion - Selling Can Start Soon! ▼
NIFTY 50 appears to be nearing the final stage of Wave 5 of the larger degree Wave 1. Price has reached the crucial Fibonacci resistance zone at 24679, and the broader 24700-24800 range is shaping up as a strong shorting zone. This area is technically significant and could trigger profit booking or fresh selling pressure as we approach the upper boundary of the wave count.
If the index closes near the day's high today, there's a strong possibility that Monday opens with a gap-up, but this is likely to face heavy selling within the first 1-2 hours. The momentum is stretched, and the current rally looks exhausted on the lower time frames.
As we step into the next phase, a corrective Wave 2 is expected to unfold, with downside potential towards 24000 and even 23600 as part of this pullback. This leg could provide better positioning for medium-term traders. The broader structure now signals that the impulse rally is overextended, and selling can begin soon from these stretched levels.

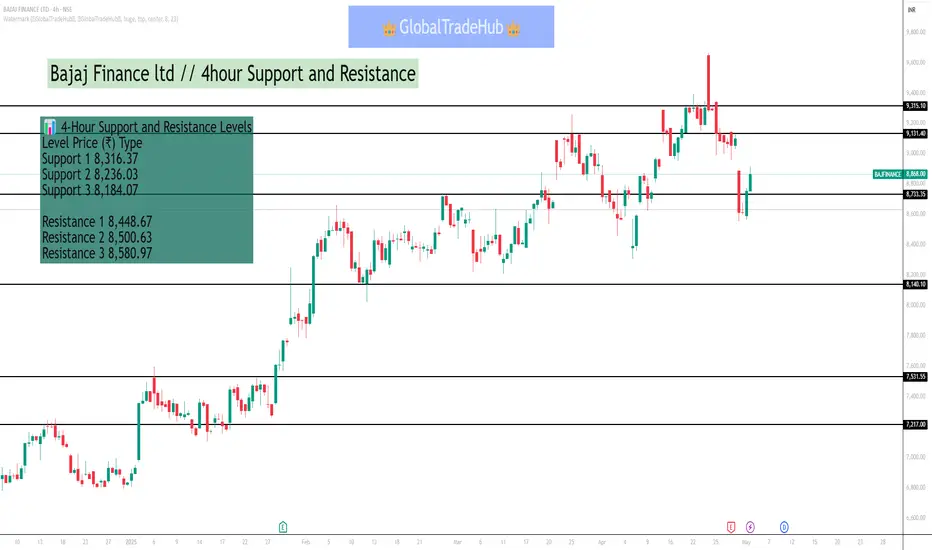
Bajaj Finance ltd // 4hour Support and ResistanceAs of May 3, 2025, Bajaj Finance Ltd (NSE: BAJFINANCE) is exhibiting the following key support and resistance levels on a 4-hour timeframe:
📊 4-Hour Support and Resistance Levels
Level Price (₹) Type
Support 1 8,316.37
Support 2 8,236.03
Support 3 8,184.07
Resistance 1 8,448.67
Resistance 2 8,500.63
Resistance 3 8,580.97
These levels are derived from the classic pivot point method and are crucial for traders to monitor, as movements beyond these points may indicate potential changes in the stock's trend.
🔍 Technical Indicators
As of the latest available data:
Relative Strength Index (RSI): 64.48, indicating an uptrend.
Stochastic RSI: 0.6, suggesting upward momentum.
Commodity Channel Index (CCI): 199.12, reflecting a strong uptrend.
Money Flow Index (MFI): 75.33, indicating strong buying pressure.
These indicators suggest a bullish trend, with the stock trading above its 20-day and 50-day Simple Moving Averages (SMA), and the 100-day and 200-day SMAs indicating an uptrend.
📈 Strategy Considerations
Bullish Scenario: If the stock price maintains above the support levels, particularly Support 1 at ₹8,316.37, it may continue its upward movement towards Resistance 1 at ₹8,448.67.
Bearish Scenario: A drop below Support 1 could signal a potential reversal or consolidation phase.
Please note that these levels are based on historical data and should be used in conjunction with other technical analysis tools and market conditions.
Support and Resistance part 2In technical analysis, support and resistance refer to price levels on a chart where the market's movement is expected to pause or reverse due to the forces of supply and demand. Support is a price level where the price has historically stopped falling, indicating that buyers are plentiful at that price point, and that the market is likely to bounce back upwards. Resistance, on the other hand, is a price level where the price has historically stopped rising, suggesting that sellers are abundant and the market is likely to fall back down.

Management and PsychologyTrading psychology refers to the emotional and mental state influencing a trader's decisions. It involves managing emotions like fear and greed, which can impact rational judgment and risk-taking, thus affecting trading outcomes. A disciplined mindset helps traders make logical decisions under pressure.

What are Financial Markets ?Financial markets are platforms where individuals and institutions buy and sell financial instruments like stocks, bonds, currencies, and derivatives. These markets facilitate the flow of capital, promote economic stability, and allow participants to manage risk.

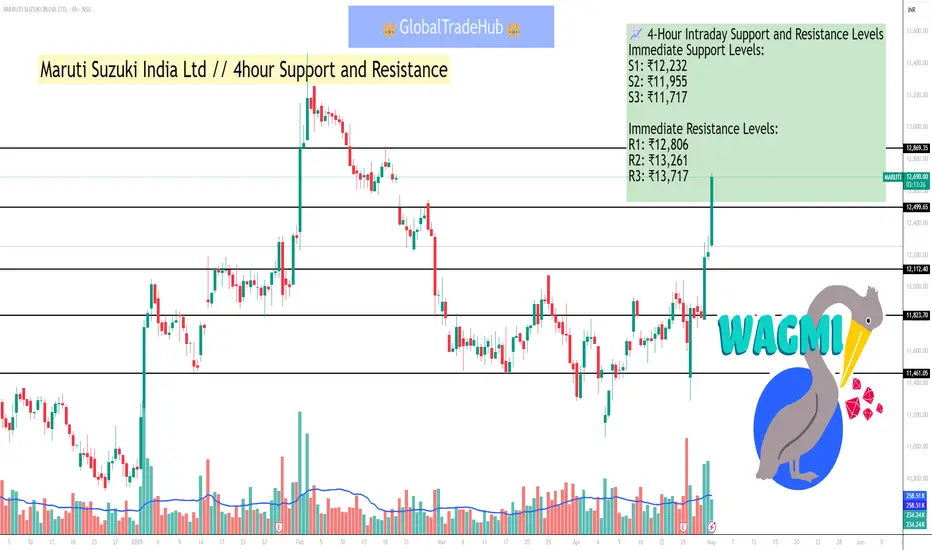
Maruti Suzuki India Ltd // 4hour Support and ResistanceAs of May 2, 2025, the 4-hour intraday chart for Maruti Suzuki India Ltd (NSE: MARUTI) indicates a bullish trend, with the stock trading at ₹12,257. The following support and resistance levels are derived from recent price action and technical analysis:
📈 4-Hour Intraday Support and Resistance Levels
Immediate Support Levels:
S1: ₹12,232
S2: ₹11,955
S3: ₹11,717
Immediate Resistance Levels:
R1: ₹12,806
R2: ₹13,261
R3: ₹13,717
These levels are based on recent price action and volume analysis, indicating potential breakout points and areas where the stock may find support.
🔍 Technical Indicators
RSI (14): 64.81, indicating bullish momentum.
MACD: 215.3, with a signal line of 116.03, suggesting upward momentum.
MFI (14): 76.87, indicating buying pressure.
EMA (50): ₹12,553.90, with the stock trading above this level, indicating a bullish short-term trend.
EMA (200): ₹12,348.91, with the stock trading above this level, indicating a bullish long-term trend.
These indicators suggest a continuation of the bullish trend, with potential for further upside movement.
📊 Chart Patterns
A recent Cup and Handle pattern has been observed, with the price breaking out from the handle formation. The measured move suggests a potential target of ₹13,280, contingent upon sustained volume and price momentum.
⚠️ Important Notes
Risk Management: Always use appropriate stop-loss orders to manage risk.
Market Conditions: Intraday levels are subject to change based on market conditions and news events.
Indian Oil Corporation LtdAs of May 2, 2025, the key intraday support and resistance levels for Indian Oil Corporation Ltd (NSE: IOC) are as follows:
Immediate Support Levels:
₹131.75
₹130.22
Immediate Resistance Levels:
₹138.63
₹146.46
These levels are derived from technical analysis and are subject to change based on market conditions.

NIFTYBANK INDEX#NIFTYBANK
Pre-Market Analysis for 02 May Nifty Bank
- *Gap-Up Opening*: GiftNifty indicates a gap-up opening.
- *Chart Analysis*:
- Clear selling indicates presence of sellers.
- Breakdown of 55000 level removed buyers and added fresh sellers.
- *Trading Strategy*:
- Consider staying on buying side, targeting sellers' stop-losses.
- Avoid selling in gap-down opening with negative movement, as there may not be sufficient downside buyers' stop-losses.
- *Important Reminders*:
Review the marked points on the chart for better understanding.
- Trade with proper confirmation and avoid trading in FOMO (Fear of Missing Out).
- Focus on making one well-planned trade per day.
- *Note*: This analysis is based on my perspective, and market situations can change quickly. Stay disciplined and prioritize risk management.

PRESTIGE ESTATES LTDPRESTIGE Estate Ltd view for Intraday 2nd May #PRESTIGE
Resistance 1385 Watching above 1387 for upside movement...
Support area 1360 Below 1360 ignoring upside momentum for intraday
Watching below 1358 for downside movement...
Above 1385 ignoring downside move for intraday
Charts for Educational purposes only.
Please follow strict stop loss and risk reward if you follow the level.

NIFTY 50 INDEX #NIFTY50 Analysis (02 May 2025):
• Pattern: Double Top near 24,520
• Resistance Zones:
* Major: 24,510 - 24,530
* Minor: 24,360-24,400
• Support Zones:
* Immediate: 24,150
* Strong: 24,000 - 23,840
(Bearish Reversal Indication)
RSI Divergence (not shown, assumed) hints at weakening momentum near top.
Fundamental Note: FIl flows, earnings season volatility, and U.S. Fed
commentary are driving current swings.

Divergence ConceptIn the stock market, divergence refers to a situation where the price of an asset (like a stock) is moving in the opposite direction of a technical indicator, such as an oscillator or momentum indicator. This discrepancy can signal a weakening trend or a potential reversal.

Database Trading part 3Trading data is a sub-category of financial market data. It provides real-time information about stock and market prices as well as historical trends for assets such as equities, fixed-income products, currencies and derivatives. Trading data also includes information about trades historically and over the course of a trading day, such as the latest bid, asking price and time of the last trade.

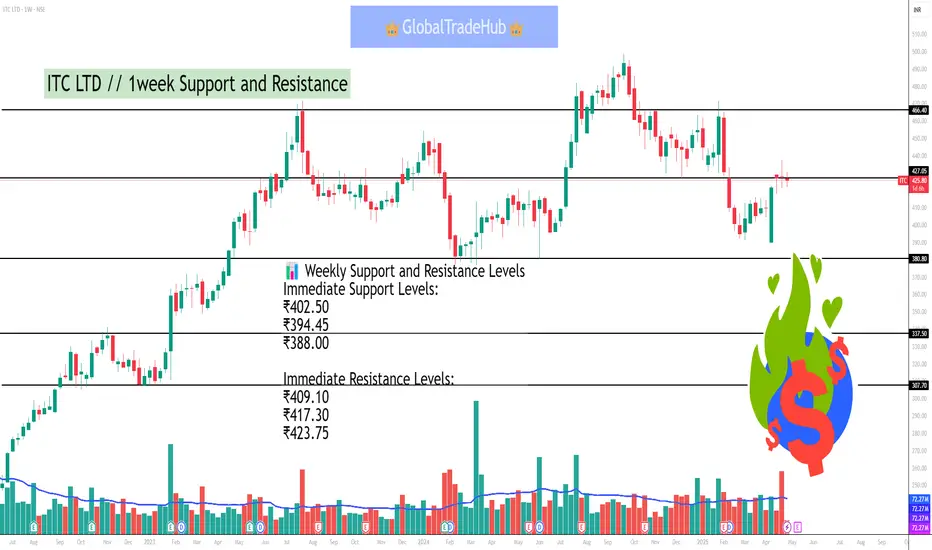
ITC LTD // 1week Support and ResistanceAs of May 1, 2025, at 10:20 AM IST, ITC Ltd (NSE: ITC) is trading at ₹403.05. Based on recent technical analysis, here are the key support and resistance levels for the stock on a weekly (1W) chart:
📊 Weekly Support and Resistance Levels
Immediate Support Levels:
₹402.50
₹394.45
₹388.00
Immediate Resistance Levels:
₹409.10
₹417.30
₹423.75
These levels suggest that if the stock price declines below ₹402.50, it may find support around ₹394.45 and ₹388.00. Conversely, if the price rises above ₹409.10, it could encounter resistance near ₹417.30 and ₹423.75.
🔍 Technical Indicators
ADX (Average Directional Index): 29.19 – indicates a trending market.
RSI (Relative Strength Index): 47.4 – suggests neutral momentum.
MACD (Moving Average Convergence Divergence): -4.66 – indicates a negative trend.
CCI (Commodity Channel Index): 2.74 – suggests neutral momentum.
These indicators suggest a neutral to slightly bearish outlook for ITC in the short term.
📈 Summary
ITC is currently trading near its immediate support levels. A break below ₹402.50 could lead to a decline towards ₹394.45 and ₹388.00. On the upside, resistance is observed at ₹409.10, ₹417.30, and ₹423.75. Traders should monitor these levels closely, as a decisive move beyond these support or resistance levels could signal the next directional move.
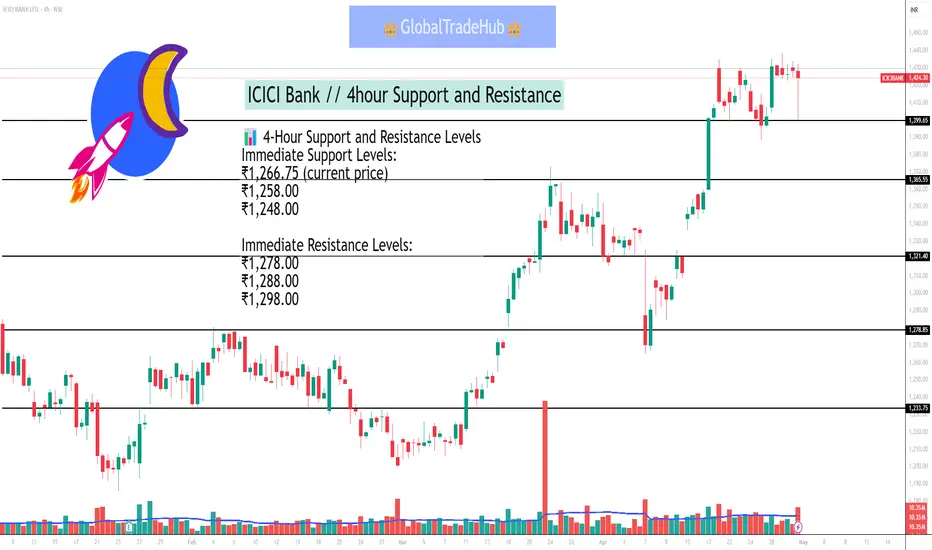
ICICI Bank // 4hour Support and ResistanceAs of May 1, 2025, at 10:08 AM IST, ICICI Bank Ltd (NSE: ICICIBANK) is trading at ₹1,266.75. Based on recent technical analysis, here are the key support and resistance levels for the stock on a 4-hour (4H) chart:
📊 4-Hour Support and Resistance Levels
Immediate Support Levels:
₹1,266.75 (current price)
₹1,258.00
₹1,248.00
Immediate Resistance Levels:
₹1,278.00
₹1,288.00
₹1,298.00
These levels suggest that if the stock price declines below ₹1,266.75, it may find support around ₹1,258.00 and ₹1,248.00. Conversely, if the price rises above ₹1,278.00, it could encounter resistance near ₹1,288.00 and ₹1,298.00.
🔍 Technical Indicators
ADX (Average Directional Index): 17.73 – indicates a weak trend.
RSI (Relative Strength Index): 55.87 – suggests neutral momentum.
MACD (Moving Average Convergence Divergence): 11.45 – indicates a positive trend.
CCI (Commodity Channel Index): 88.61 – suggests the stock is in an uptrend.
These indicators suggest a neutral to slightly bullish outlook for ICICI Bank in the short term.
MAX FINANCIAL SERVICES LTDAs of May 1, 2025, at 9:35 AM IST, here are the key daily support and resistance levels for Max Financial Services Ltd. (NSE: MFSL) based on recent technical analysis:
🔹 Support Levels
S3: ₹1,011.58
S2: ₹1,020.37
S1: ₹1,030.43
🔹 Resistance Levels
R1: ₹1,049.28
R2: ₹1,058.07
R3: ₹1,068.13
These levels are derived from the Classic pivot point method, calculated based on the price range of the previous trading day.
📊 Technical Indicators
RSI (14): 50.14 (Neutral)
MACD: 1.57 (Sell)
ADX (14): 22.20 (Neutral)
Williams %R: -51.44 (Buy)
CCI (14): 68.41 (Neutral)
ROC: 3.45 (Buy)
These indicators suggest a neutral to slightly bullish trend, with the stock trading near its 20-day moving average and showing mixed momentum signals.
📈 Moving Averages
20-day EMA: ₹1,073.42
50-day EMA: ₹1,109.36
100-day EMA: ₹1,118.91
200-day EMA: ₹1,086.00
The stock is trading below its 50-day and 100-day EMAs, indicating a potential resistance zone around ₹1,109.36.
Note: These levels and indicators are based on historical data and are subject to change with market conditions. It's advisable to monitor the stock's price movements and consult with a financial advisor before making any trading decisions.

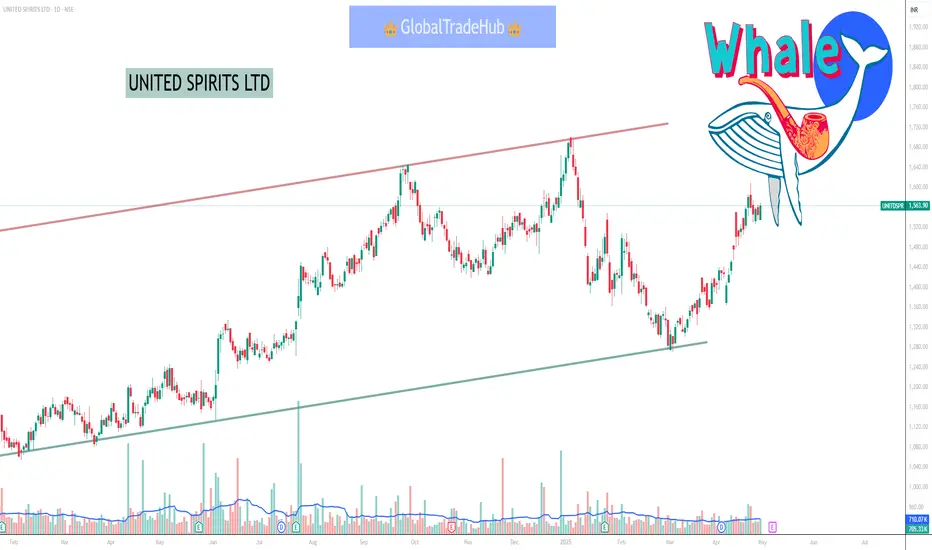
UNITED SPIRITS LTD As of May 1, 2025, here are the key support and resistance levels for United Spirits Ltd (NSE: UNITDSPR) based on the latest technical analysis:
🔹 Support Levels
S1: ₹1,322.63
S2: ₹1,297.97
S3: ₹1,271.98
🔹 Resistance Levels
R1: ₹1,373.28
R2: ₹1,399.27
R3: ₹1,423.93
These levels are derived from pivot point calculations and are commonly used by traders to identify potential price reversal zones.
Please note that these levels are based on historical data and are subject to change with market conditions. It's advisable to monitor the stock's price movements and consult with a financial advisor before making any trading decisions.
Option TradingOption trading involves buying or selling contracts that give the right, but not the obligation, to buy or sell an underlying asset (like a stock) at a specific price (strike price) by a certain date (expiration date). It allows traders to speculate on future price movements of an asset without actually owning it.

Nifty Financial Services Index//15min Support and ResistanceAs of April 30, 2025, the Nifty Financial Services Index (FINNIFTY) is exhibiting a bullish trend, with the current price at ₹23,512.80. Technical indicators such as moving averages and pivot points suggest potential support and resistance levels for short-term trading.
📊 Key Support and Resistance Levels
Based on recent analyses, here are the critical levels to monitor:
Resistance Levels:
R1: ₹23,571.52
R2: ₹23,630.23
R3: ₹23,695.77
Support Levels:
S1: ₹23,447.27
S2: ₹23,381.73
S3: ₹23,323.02
These levels are derived from pivot point calculations and are useful for intraday trading strategies.
📈 Technical Indicators
Moving Averages:
The index is trading above its 5-day, 10-day, and 20-day simple and exponential moving averages, indicating a bullish short-term trend.
Pivot Points:
The classic pivot point is at ₹24,264.15, with R1 at ₹24,397.3 and S1 at ₹24,175.85.
🧭 Trading Strategy
Given the current bullish momentum, traders might consider buying near support levels and targeting resistance levels for potential profits. However, it's essential to monitor market conditions closely, as breakouts above resistance levels could lead to further upward movement, while failures to hold support may indicate a reversal.
Please note that these levels are subject to change based on market dynamics and should be used in conjunction with other technical analysis tools for informed decision-making.

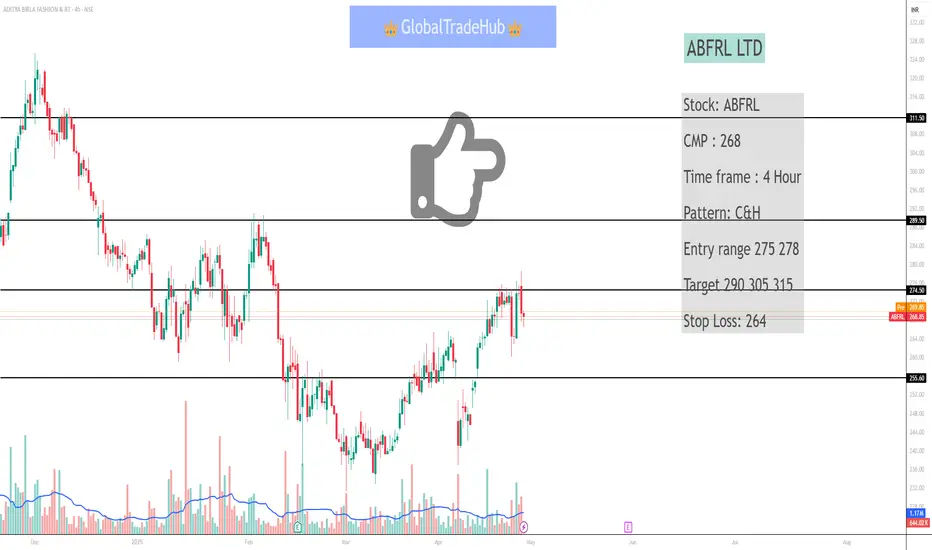
ABFRL LTDABFRL LTD
I'm not a SEBI - Registered advisor. All the information provided is for educational and information purposes only.
Note- This is not buy/sell recommendation, before investing discuss with your financial adviser
Stock: ABFRL
CMP : 268
Time frame : 4 Hour
Pattern: C&H
Entry range 275 278
Target 290 305 315
Stop Loss: 264
#ABFRL
Hindustan Aeronautics LtdHindustan Aeronautics Ltd
Hindustan Aeronautics Ltd (HAL) Analysis Pattern: Ascending Triangle Breakout
CMP: *4609.30
Intraday Setup:
Buy Above: *4630
Target: *4745
Stop Loss: *4545
Strong trendline support and breakout above horizontal resistance confirm bullish
momentum. Volume confirms breakout strength.

Explanation of Support and ResistanceSupport is a price point below the current market price that indicate buying interest. Resistance is a price point above the current market price that indicate selling interest.

Advanced Database TradingAdvanced database systems try to meet the requirements of present-day database applications by offering advanced functionality in terms of data modeling, multimedia data type support, data integration capabilities, query languages, system features, and interfaces to other worlds.
