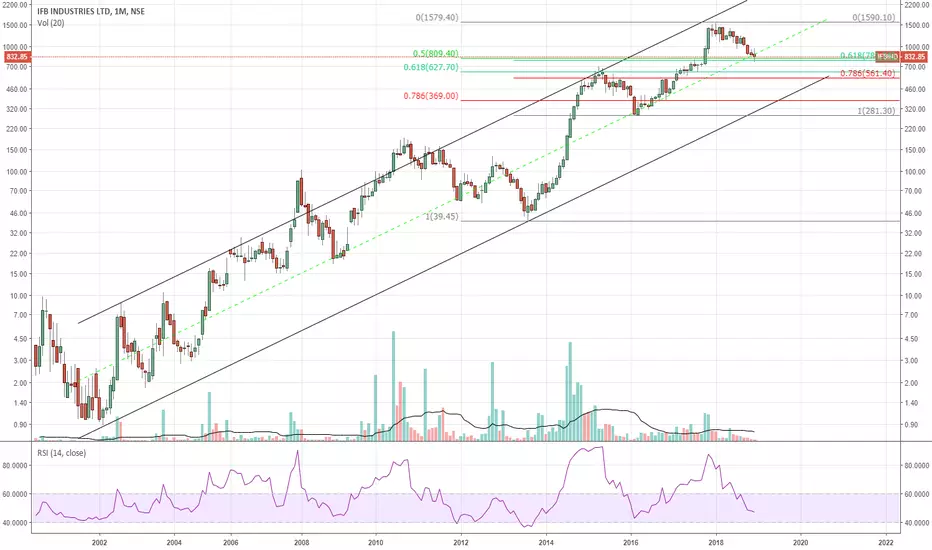
IFB Industries: 48% upmove possible➡️1000+ day descending channel breakout
➡️promoter holding ~75%
➡️debt reduction
➡️aims to achieve sustainable double-digit margins by the end of Q4
Cons:
➡️High P/E
➡️competitive segment
Ifb

IFB - Retesting for demandCategory: Continuation
Key Highlights:
1. Bullish market structure on HTF
2. Tapped into the demand zone
3. Massive volume on the creation of the demand zone
Disclaimer: This is NOT investment advice. This chart is meant for learning purposes only. Invest your capital at your own risk.
Rajat Kumar Singh (@johntradingwick)
NSE Certified Technical & Fundamental Analyst

IFB Industries bullish breakout observedIFB Industries has given a recent trendline breakout as well as breakout from a W pattern formation in Weekly and Daily charts.
This makes it bullish for in short term.
Entry-EXIT can be done as below:
BUY around 1260-1250 during retracement or RISKY traders can start accumulating above 1316
SL: 1220 below
Targets: 1399 as first target, a breakout with good volume above can take it to 1500+ levels
Risk-Reward ratio: 1:3+
Don't forget to keep revising SL once in profit.
** This is a good time for IFB considering festive season sales as well.

IFB | Looks Strong above 1130The stock was falling consistently and shown a strong up move, looks good to buy above 1130 for the marked levels on the chart.
To motivate me, Please like the idea If you agree with the analysis.
Happy Trading!
InvestPro India Team

Short IFB Below 1360Sell if sustains below 1360 for the targets of 1300, 1210, and 1120 until 1460 is intact on the upside.
To motivate me, Please like the idea If you agree with the analysis.
Happy Trading!
InvestPro India Team

IFB Industries - Study - Long above 720IFB looks bullish on charts above 720 for a target of 800, 885, 1005 & 1070.
Stoploss : 630

IFB Industries : A Good Move AheadIt's a Good Long weekend, Days like these are the most welcome ones & I also have sometime to pick n choose Mid-cap stocks which are far away from the line we play by. Cutting straight to the subject IFB Industries looks quite promising based on post above, A Good 2-Year Old resistance zone is broken very convincingly with great volume surge compared to previous weeks.
Even before the New high's in 2015 it consolidated for 84 days, Now after 2 years in 2017 , same thing repeats with 105 day consolidation and good breakout at the end of it. What else we can expect in a juicy trade setup ? I believe there is good potential for upside in this stock with 875's as first zone for target & final ones being 970's.
Final Note : I didn't check much of its fundamental, but compared to peers its good, So have a look at it's fundamental & try your own analysis too :)
Let Me know if you have some info on funda's or skewed news items or numbers.
Happy Extended Weekend !
