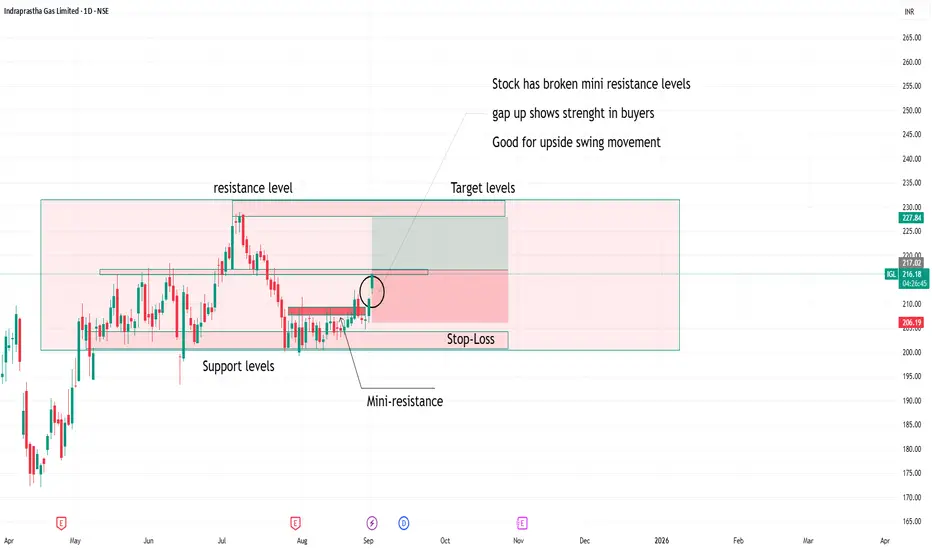
Igl good for upside swing movementstock has broken mini resistance levels
gapup shows strength
with strict stoploss and targets one can watch or observe this stock for upside
IGL
IGL may come down!We may have a C wave of a flat pattern currently unfolding in IGL. It can witness a correction for some time.
**This is an educational market outlook, not investment advice. Please consult a SEBI-registered advisor before taking any investment decisions.**

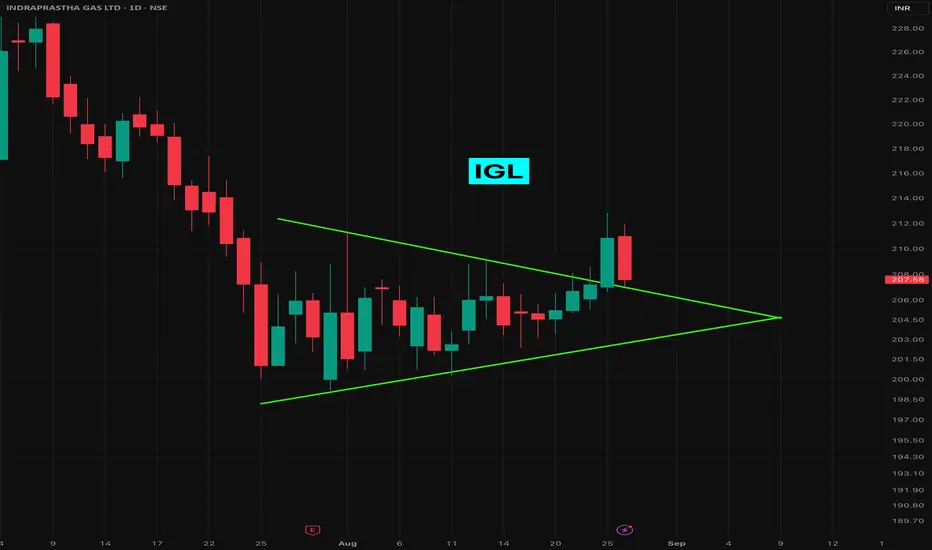
Indraprastha Gas IGL Out of Symmetrical TriangleOK! IGL finally breaks out of the Symmetrical Triangle pattern after close to month of side way movement, with decent volume.
The price retested the triangle top line as well, and I secured my long position before the closing bell today.
Motilal Oswal published a post confirming a bullish trade with Rs.250 as the LONG trade target. I never take trades based on other's work, but just thought you would want to know.
Indraprastha Gas's consolidated quarterly revenue has shown a steady increase over the last five quarters.
Long Correction is expected to take place in INDRAPRASATH GAS!Elliott Wave Analysis:-
In Correction wave a) wave took place and for retracement b) wave and still a little more correction was pending it seems to be. and the fall is expected from there.
i am not a SEBI registered advisor.
Before taking a trade do your own analysis or consult a financial advisor.
I share chart for education purpose only. I share my trade setup.

IGL looks good to buy at 205 levelsDate: 24-May-25
After hovering around 201 levels IGL has closed above 205. Trapped short sellers may rush to cover their positions if IGL sustains above 202 to 205 region.
In the coming week of 26th May onwards it is likely to touch 207.4 to 212.4

IGL - Testing ATH levels - Not very strong yet!Price Analysis & Overview:
1. Outlook is bullish but conviction is not string due to the price strength lack
2. Volumes are not great!
3. Price is not showing strength as expected.
4. Possibly it will retrace before bouncing back to breath the ATh levels
- Stay tuned for further insights, updates and trade safely!
- If you liked the analysis, don't forget to leave a comment and boost the post. Happy trading!
Disclaimer: This is NOT a buy/sell recommendation. This post is meant for learning purposes only. Views are personal. I share whatever I do. Please, do your due diligence before investing.
Thanks & Regards,
Anubrata Ray

IGL - On Radar for bullish biasAt strong support area
In strong accumulation
Breakout possible
Weak below 468
Possible upside 520-40

MACD Crossover Swing Trade - IGL📊 Script: IGL
📊 Sector: Gas Distribution
📊 Industry: Miscellaneous
⏱️ C.M.P 📑💰- 504
🟢 Target 🎯🏆- 535
⚠️ Stoploss ☠️🚫 - 489
⚠️ Important: Always maintain your Risk & Reward Ratio.
✅Like and follow to never miss a new idea!✅
Disclaimer: I am not SEBI Registered Advisor. My posts are purely for training and educational purposes.
Eat🍜 Sleep😴 TradingView📈 Repeat 🔁
Happy learning with trading. Cheers!🥂

IGL ready to run!Smaller inverted Head and Shoulder breakout done, retested and follow up move came. NSE:IGL is now ready for a bigger breakouts and further upmove in coming weeks.

Crossover - IGL📊 Script: IGL
📊 Sector: Gas Distribution
📊 Industry: Miscellaneous
Key highlights: 💡⚡
📈 Script is trading at upper band of BB.
📈 MACD is giving crossover .
📈 Double Moving Averages giving Crossover.
📈 Right now RSI is around 63.
📈 One can go for Swing Trade.
⏱️ C.M.P 📑💰- 472
🟢 Target 🎯🏆 - 508
⚠️ Stoploss ☠️🚫 - 458
⚠️ Important: Always maintain your Risk & Reward Ratio.
✅Like and follow to never miss a new idea!✅
Disclaimer: I am not SEBI Registered Advisor. My posts are purely for training and educational purposes.
Eat🍜 Sleep😴 TradingView📈 Repeat 🔁
Happy learning with trading. Cheers!🥂

Gas Distribution BreakoutCustom index created by top M.cap companies in gas distribution sector with Adani total gas, GAIL, Gujgas, IGL, Petronet.
Trendline breakout. Petronet already made ATH.

IGL broke the consolidation Range IGL has shown positive momentum and broke last few weeks Range
Let's Track the next movement, if it shows more upside rise or comeback into prev range again
* For Education Purpose
Practice and Learn price action setups

IGL - Swing Trade Analysis - 6th April #stocksIGL (1W TF) - Swing Trade Analysis given on 6th April, 2024
Pattern: SYMMETRICAL TRIANGLE
- Volume buildup at Resistance - Done ✓
- Trendline Resistance Breakout - In Progress
- Demand Zone Retest & Consolidation - In Progress
#IGL #ENERGY

IGL, Important levels to ConsiderHello traders,
Thanks for your support and love. Recently I got some questions on IGL, some of them are interested in bottom fishing and others want to accumulate at these levels. Before we start our analysis I like to declare that "I am holding this stock (IGL) in my personal portfolio.".
Let's start our technical analysis.
Time frame: Daily
Chart type : Heikin Ashi
Indicator: GMMA, RSI
Important Levels: Marked on the chart
As we are already 33% down from its high which was in September 2021. But this correction of 33% is very systematic and also I consider this as a good "Time wise correction". This stock respects the technical structure very well, I mean to say that the price follows the right charting behavior which is easy to analyse. Recently we have a strong breakdown in the structure of Heikin Ashi and a negative crossover in the Guppy's indicator which indicates a strong downtrend. But this break of structure happened just near the support zone and we see the price is consolidating at these levels but no sign of reversal. Also the relative strength index breaks down the level of 40, which is a negative signal. From some other technical aspects I think the price could experience high volatility in the range of 400 to 390 and 390 to 380.
So, my dear traders wait for the price to settle down. But keep this stock on your radar and keep tracking the price, soon we get the right opportunity to enter. I will keep posting the daily update on this stock so stay tuned. Happy trading.
Disclaimer: This is my pre market analysis and my trading journal. Not a suggestion to buy or sell.
Thanks
Er. Simranjit Singh Virdi
(Independent Trader)

Indraprastha Gas/ IGL Positional Long Setup - IGL is a stock which has a decent or sluggish movement
- Less volatility which also can reduce some volatile moves in your Portfolio
- From a positional perspective keep a stop loss of 390 if you entered around 403 with me
- I think this time the retracement can be a little small and demand-driven
- Enter partially at 406-408 keep your 50% fiat to enter around 394-401
- This way you will have a top-class average and a very good entry as well
- If you find this helpful kindly support.

IGL Swing Long Setup IGL is currently trading at a filtered demand zone
- From a Mid-Term perspective I am very bullish on this
- Accumulation Zones - 380-395
- SL shouldn't be more than 2-4%

IGL a clear reversal candidatereversal shown on chart with minimal SL for 10% and 20% gains in 6 months time frame

[POSITIONAL] IGL - LONG ABOVE 391- Long only if it breaks trendline and moves above inside bar high
- Entered demand zone and is currently indecisive, so Mon/Tue - if there is enough volume then it can break the trendline
- Respect Stop loss - new demand will be created if it breaks the stop loss

IGL: Bullish Falling Wedge Pattern IGL has constructed a falling wedge on the 1-day chart in which it has made continuous lower lows and lower highs.
The trend can change from bearish to bullish after the breakout of the resistance trendline. Buyers can expect a bullish move with the following targets: 483 & 504 . IGL Is Bearish below 458 .
Buyers have to break and stay above 504 to increase demand pressure.
Note: Do your own research / discuss it with your advisor

IGL Daily Chart suggest 10% upmove in 30 daysIGL Daily Chart shows new Upmove breakout with 10% upside in next 20-30 days
LTP 479
SL 470
Target 545+
Timeframe 20-30 Days

IGL: Flag Breakout#IGL (Daily) CMP 506
Flag pattern with Huge Volumes
Support- 490
Resistance- 525/535/550

IGLIGL:- Ascending triangle pattern has formed, wait for a proper breakout, till then keep an eye on the stock
Hello traders,
As always, simple and neat charts so everyone can understand and not make it too complicated.
rest details mentioned in the chart.
will be posting more such ideas like this. Until that, like share and follow :)
check my other ideas to get to know about all the successful trades based on price action.
Thanks,
Ajay.
keep learning and keep earning.

Indraprastha Gas Limited Consolidating in a narrow range after giving a strong impulsive move.
It would be interesting to see if it directly continues higher OR comes back to the demand zone before moving back up.
In any case, it should move higher in the coming weeks.
Disclaimer: This is NOT investment advice. This post is meant for learning purposes only. Invest your capital at your own risk.
