TATASTEEL | Weekly Chart | Breakout SetupTata Steel has shown a clear shift in market structure on the weekly chart. After spending several months in a broad consolidation phase, price has now broken above a major supply/resistance zone, indicating improving sentiment and possible trend continuation.
🔍 Price Structure & Trend Analysis
The stock was earlier trapped in a range between ₹150–160, acting as a strong supply zone.
Multiple rejections from this zone confirmed heavy distribution in the past.
Recent price action shows a decisive breakout with strong weekly closing, confirming acceptance above resistance.
The market has transitioned from distribution → accumulation → markup phase.
📐 Support & Resistance Mapping
Major Support Zone: ₹168 – ₹170
(Previous resistance now turning into demand — classic role reversal)
Intermediate Support: ₹160 (EMA cluster + price base)
Immediate Resistance: ₹185 (current price acceptance zone)
Upside Target Zone: ₹215 – ₹220
(Next weekly supply and measured move projection)
📈 Moving Average Structure
Price is trading above short-term and medium-term EMAs, reflecting bullish momentum.
EMAs are sloping upward, indicating trend strength rather than a dead-cat bounce.
Pullbacks towards EMAs are likely to act as dynamic support.
🔁 Retest & Risk Perspective
A healthy retest of the ₹168–170 zone would strengthen the breakout reliability.
Sustained trade below ₹160 would weaken the bullish structure and invalidate the breakout thesis.
As long as price holds above prior resistance, trend continuation remains the higher probability scenario.
🎯 Trade Planning Framework (Educational)
Bias: Bullish above ₹168
Opportunity Zone: Retest or consolidation above breakout level
Invalidation: Weekly close below ₹160
Trend Target: ₹215 – ₹220 (medium-term)
🧠 Big Picture Takeaway
This is a classic weekly breakout setup with:
✔ Strong structure
✔ Clear role reversal
✔ EMA alignment
✔ Defined risk levels
If volume expands on continuation, Tata Steel could enter a sustained markup phase rather than a short-term spike.
Indian

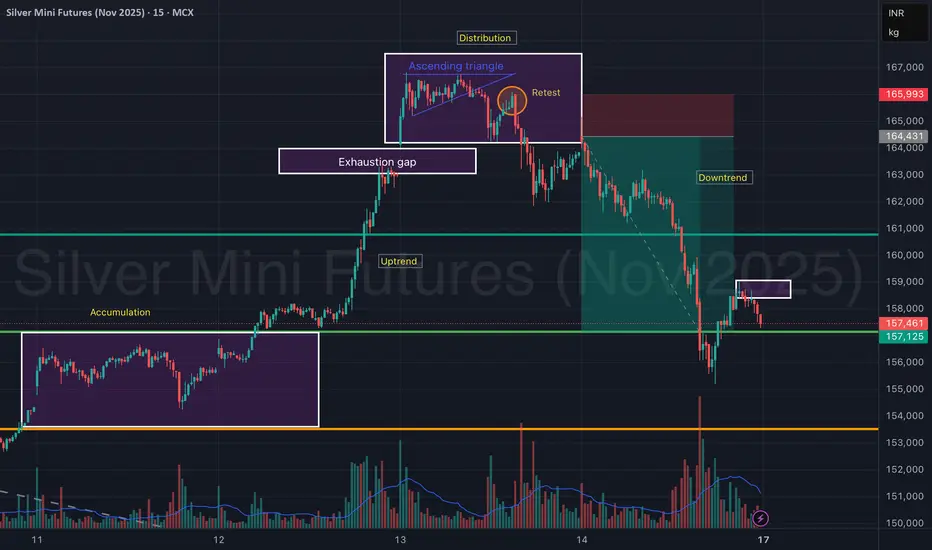
Silver Mini Futures (Nov 2025) – Accumulation to Distribution Silver Mini Futures on the 15-min chart clearly showcases a complete market cycle structure — transitioning from accumulation → uptrend → distribution → downtrend, providing an excellent study in price behavior and volume confirmation.
The move began with accumulation around ₹1,55,000, followed by a strong uptrend breakout, leading to a sharp rally. However, as price entered the ascending triangle near the ₹1,66,000 zone, momentum weakened, signaling distribution.
An exhaustion gap and a failed retest confirmed a reversal, leading to a steep downtrend, which remains active after a minor pullback.
📊 Phase Breakdown:
Accumulation Phase: ₹1,54,800 – ₹1,55,800
Sideways base formation with increasing volume at lows.
Uptrend Phase: Breakout above ₹1,56,000 triggered momentum.
Distribution Phase: Formed an ascending triangle with weak breakout follow-through.
Retest failure at ₹1,65,000 signaled exhaustion.
Downtrend Phase: Sharp decline with heavy volume, currently finding support near ₹1,57,000.
🎯 Key Technical Zones:
Resistance: ₹1,64,400 – ₹1,66,000 (supply zone)
Immediate Resistance (Retest Box): ₹1,58,200 – ₹1,58,800
Support Zone: ₹1,56,800 – ₹1,57,100
Major Support: ₹1,54,500
🧠 View:
Silver Mini Futures is currently in a downtrend continuation phase after a distribution top. A minor retest near ₹1,58,800 could invite short opportunities, while only a sustained move above ₹1,60,000 may signal trend reversal strength.
Gold shakes violently | Priority Buy on dip to support🟡 XAU/USD – 24/09 | Captain Vincent ⚓
🔎 Captain’s Log – Context & News
Geopolitics : Trump unexpectedly supported Ukraine reclaiming full territory and called on NATO to be tougher on Russia → defensive sentiment returned, supporting Gold.
US Economy : Housing data due today, no FED speeches.
Earlier: Weak US PMI + dovish FED tone → no momentum for a prolonged downtrend.
Price Action : Gold dropped more than 20 points overnight, then quickly rebounded to 3,76x → likely profit-taking pressure at higher levels.
⏩ Captain’s Summary : Main trend stays bullish, but the voyage will remain choppy as Gold absorbs profit-taking near resistance.
📈 Captain’s Chart – Technical Analysis (H45)
Golden Harbor (Support / Buy Zone)
Buy Scalp OB: 3,754 – 3,757
OB Harbor: 3,741 – 3,744
Storm Breaker (Resistance / Sell Zone)
Sell Scalp Zone: 3,797 – 3,800
Higher Sell Zone: 3,813 – 3,815
Market Structure
After the deep drop, Gold rebounded and held above 3,76x.
Bullish trend remains intact, but waves of volatility may occur near higher resistance zones.
🎯 Captain’s Map – Trade Plan
✅ Buy (priority)
Buy Scalp OB
Entry: 3,754 – 3,757
SL: 3,747
TP: 3,762 – 3,767 – 3,772 – 3,777 – 3,782
Buy Zone OB
Entry: 3,741 – 3,744
SL: 3,732
TP: 3,749 – 3,754 – 3,759 – 3,764 – 3,769
⚡ Sell (short scalp – lower RR)
Sell Scalp Zone
Entry: 3,797 – 3,800
SL: 3,806
TP: 3,795 – 3,790 – 3,785 – 3,780 – 3,775
Higher Sell Zone
Entry: 3,813 – 3,815
SL: 3,823
TP: 3,810 – 3,805 – 3,800 – 3,795 – 3,790
⚓ Captain’s Note
“The Golden ship rocked violently overnight but still anchored firmly at Golden Harbor 🏝️ (3,754 – 3,741) . Profit-taking waves may still rise at Storm Breaker 🌊 (3,797 – 3,815) , suitable for short Quick Boarding 🚤 scalps. Yet the main voyage continues north – Buy the Dip remains the compass to follow the strong winds.”
📢 If you find the Captain’s Log useful, don’t forget to Follow for the latest signals.
💬 Got your own view on Gold? Share it in the comments and join the crew discussion!

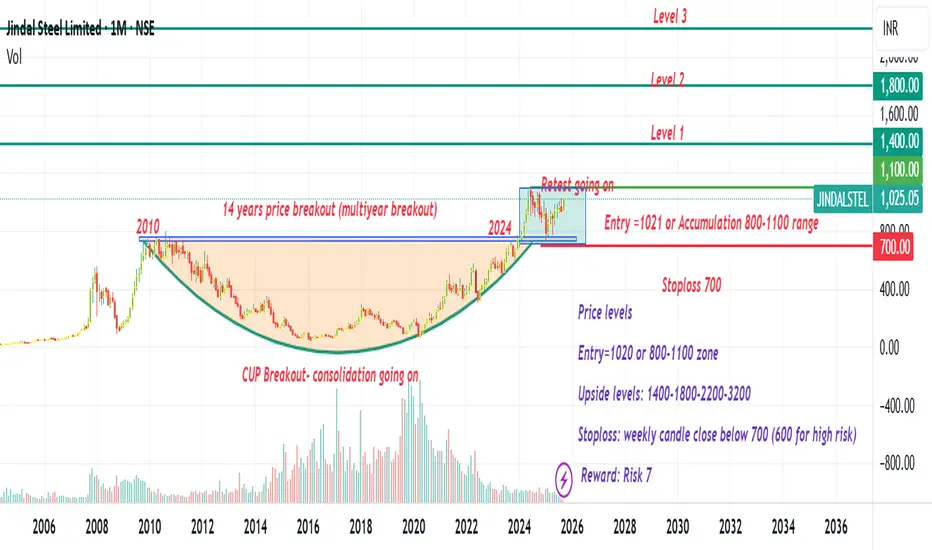
Jindal Steel multiyear price breakout #Nifty #JINDALSTELPrice is breaking out after 14 years, showing a multi-year price breakout.
Maybe a a Good chance for a Multi-bagger return
Entry: Current price or 800-1100 range
Stoploss: monthly or weekly close below 700
Upside levels: 1100-1400-1800-2200-3200
Analysis just for a learning point of view
Not a recommendation
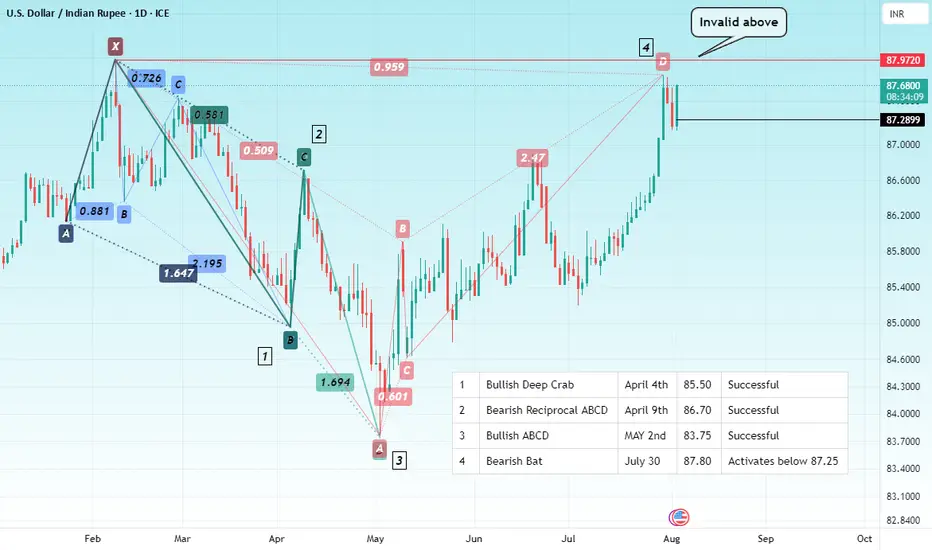
INDIAN RUPEE Hello & welcome to this analysis
$:INR has been swinging from a series of Harmonic Trading Patterns successfully this year as show in the chart.
With RBI POLICY coming up this week, will it be successful for the fourth time in a row?
Whatever it does, there is definitely going to be an impact of commodities particularly Crude, Gold & Silver that appear to be bullish.
All the best
BEPL Breakout soonBEPL about to breakout with 16% profit in short term with triangle pattern and also 55 ema has crossed 8,13,21 ema which shows strong uptrend on moving average
Hold duration around 1-2 month
Entry - 117
Target -138
Stock has good fundamentals
So I suggest to buy BEPL Bhansali eng. Polymers LTD

Adani power breakoutAdani power short term profit up to 35%
Hold duration of Adani power 1-2 month
Buy around - 590
Target -750
Adani power fundamentals are strong and just gave a breakout, might be possible to give profit in under 10-15 days

BAJAJ HOUSING FINANCE Camarilla BOThere has been downtrend in the stock and recently it has changed the trend for current monthly R3 & S3 is under previous month R3 & S3 which gives indication that there will move once R4 or S4 is broken.
However Yesterday R4 has broken which gives clear indication of upward movement.
Buy - 146.69
SL 138
Target 164.04
Timeframe 30 days
This idea is purely for educational purpose. Please do your due diligence before investing.

TRADE PLAN ON TITAN Titan Stock Swing Trade Idea
1. Trend Analysis: The stock is in a strong uptrend, indicating positive momentum and investor confidence.
2. Demand Zone: It has reached a strong demand zone, a key level where buying interest is likely to emerge, providing potential support for price recovery.
3. Technical Patterns:
Weekly Timeframe: A shooting star-like pattern indicates possible hesitation or reversal after a strong upward move.
Daily Timeframe: A bullish engulfing pattern signals a potential continuation of the upward trend, confirming buyer dominance near the support zone.
4. Moving Average Support: The stock is taking support at a key moving average , adding to the confluence of bullish signals.
Trade Plan:
Entry: Consider NSE:TITAN the current demand zone or after confirmation of bullish momentum (e.g., a breakout above recent highs).
Stop-Loss: Place below the recent swing low or moving average support for risk management.
Target: Aim for the next resistance zone or a measured move based on the uptrend continuation.
Risk Note: Watch for a confirmed breakout or breakdown from current levels, as the shooting star pattern in the weekly timeframe could indicate selling pressure if demand fails to
#stockmarket #nifty50 #swingtrade #titan

USDINR By KRS ChartsDate: 3rd July 2024
Time: 7:40 PM
Why USDINR?
1. Everyone know INR is getting weaker against USD day by day, and same thing happened here since Oct 2022 but inside Rising Wedge Pattern in Weekly TF.
2. In Bigger view This Rising Wedge Pattern has formed around resistance line off Bigger Flag in Monthly TF. (Red Doted Line)
3. This pattern can either Breakout or Breakdown any side but after considering above both points its likely to Breakdown rather than Breakout till green dotted support line.
Currencies movements are on many Factors so Thats my view on USDINR is Slightly more bearish than Bullish.
But I will appreciate your views on this too, what you guys are thinking?


ITC | Next Target 480Rs / 500Rs | T.A (Follow For More..)According to me if ITC breaks the Level of 445Rs in the upcoming days and closes the 2 bullish candles above the 445Rs price zone. So, the next 1st Target is 480Rs and
the 2nd Tagart Level is 500Rs.
Why? I'm Telling this!!
> Because BJP is won.
> The financial budget is coming soon. and I am pretty sure
financial minister talking about ITC.
> After the 4 June dump the stock fully recovered in just 2 Day's
So, After knowing this all things there is one think is confirm is ITC have lot's of bulls Volume
For Future UPDATES Follow and Give se Boots
So, I will time to time update you.

JSW Infrastructure Limited - Looks Good!Pattern : Symmetrical Continuation Triangle (Bullish)
The recent price action indicates a breakout from a consolidation phase, signaling a potential extension of the previous uptrend.
A Symmetrical Continuation Triangle (Bullish) is characterized by two trendlines converging as the price forms lower highs and higher lows. During this formation, trading volume tends to decrease as the price fluctuates within a narrowing range, reflecting uncertainty among market participants.
Prior to the triangle reaching its apex, there is a notable breakout above the upper trendline accompanied by a significant increase in trading volume.
This breakout serves as confirmation of the pattern, suggesting a continuation of the preceding uptrend.
Also there is divergence between Price and MACD.
PLEASE NOTE THAT:
This chart analysis is only for reference purpose.
This is not buying or selling recommendations.
I am not SEBI registered.
Please consult your financial advisor before taking any trade

Bullish on Sbi Card Any one who wants to invest in credit card companies can go with sbi card as you see in chart that this share has starts fall from jun 2023 and now almost in ends .
this is trading bet as well as long term for 1 year . . .
this share forms a pattern of falling wedge so accurate
Discalimer:- i am not sebi registered all loss as well as profit both is solely yours . i am not responsbile for any kind of loss or profit solely you are respobile for that .

CHANNEL BREAKOUT IN INDIANB (INDIAN BANK)INDIAN BANK has got a strong channel breakout with heavy Volumes and RSI. Stock is also favourable as per technical analysis, Bollinger Bands, and other tools.

USD INR Weekly Brackout 🙄The USD INR brackout is negative for the import company & also the Fiscal Deficit increse, but this is good for exporting company: my view this brackout is not good for the indian economic.

Indian Overseas BankIOB Long targets are ploated
SL @ 26.
Only for education purpose do own research before investing in stock market.

Indian Railway Finance Corporation LtdThis will boom.
Increasing profit
Increasing dividend
Only concern in Debt to equity.
Buy at 44
Stop loss at 40
Only for education purpose do own research before investing in stocks.

BANKNIFTY | D TF | bullish viewanother bullish view for Bank nifty, currently at support and we can see that it's trying to take support, expecting 47000 before oct.

USDINR Possible Elliott wave counts Hello Friends
Here we had shared possible Elliott wave counts on chart of USDINR, which is clearly showing that on bigger scale we are in 5th wave of some higher degree, in which we had finished wave (1)-(2)-(3) and currently we are in either in wave (4) or in wave 2 of wave (5).
Also both scenarios are discussed in this video post, you can go through this video post which is explained in best possible way for Educational purpose only.
I am not Sebi registered analyst.
My studies are for educational purpose only.
Please Consult your financial advisor before trading or investing.
I am not responsible for any kinds of your profits and your losses.
Most investors treat trading as a hobby because they have a full-time job doing something else.
However, If you treat trading like a business, it will pay you like a business.
If you treat like a hobby, hobbies don't pay, they cost you...!
Hope this post is helpful to community
Thanks
RK💕
Possible scenario
Alternate scenario
Disclaimer and Risk Warning.
The analysis and discussion provided on in.tradingview.com/u/RK_Charts/ is intended for educational purposes only and should not be relied upon for trading decisions. RK_Charts is not an investment adviser and the information provided here should not be taken as professional investment advice. Before buying or selling any investments, securities, or precious metals, it is recommended that you conduct your own due diligence. RK_Charts does not share in your profits and will not take responsibility for any losses you may incur. So Please Consult your financial advisor before trading or investing.

EURUSDthe price is trading lower forming lower highs and lower lows so i would probably look for entries in the lower highs . so lets wait and react to the market
for educational purpose only.

DXYlets wait and react to the the market price currently its at the top near the level 105 and in daily it shows some rejection candles if it gives any entry near the yellow zone i could probably enter in a trade. look into monday open and will goooo.
educational purpose only not financial advise.

