HDFC BANK LTD PARALLEL CHANNEL BREAKOUTHDFC BANK was traded in channel from past few years and made a breakout with good volume. Entry price at ₹990, with a STOPLOSS ₹940 and TARGET ₹1,190
Indiastocks

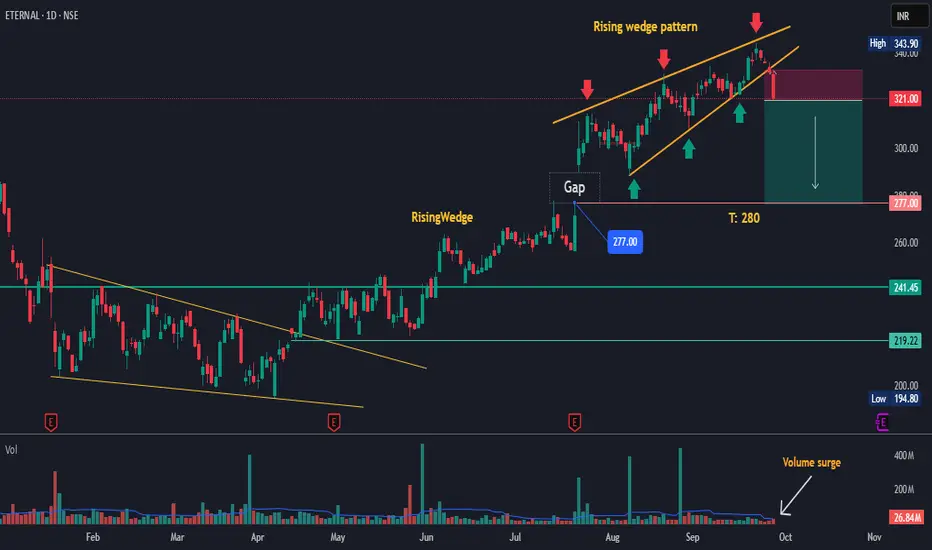
ETERNAL – Rising Wedge Breakdown Setup | Target: 280The stock has formed a Rising Wedge pattern after a strong rally, with multiple rejections from the upper trendline (marked by red arrows). previous price action shows weakness near the resistance zone, indicating a potential breakdown.
🔹 Key Highlights:
Rising Wedge Pattern visible on the daily chart – a bearish reversal setup.
Volume surge in recent sessions signals distribution at higher levels.
Gap Support at 277 – likely to be tested once breakdown confirms.
Immediate Target: 280, aligning with horizontal support.
Risk-to-Reward favored on the short side as price rejects resistance.
🔻 Breakdown Confirmation:
277 (Gap level)
241.45
219.22
This setup offers a clean technical short opportunity if downside momentum continues. Suitable for traders looking to capitalize on wedge breakdowns with volume confirmation.
Disclaimer : Risk management is crucial in this volatile market, so keep position sizing appropriate. This analysis is intended for educational purposes and not financial advice.
CHOLAFIN Technical & Trade AnalysisCHOLAFIN Technical & Trade Analysis
1️⃣ Price Action
CHOLAFIN surged +4.31% to close at ₹1,583.10, marking a strong bullish candle on the daily chart. Price action shows a clean breakout attempt, with momentum reclaiming higher zones. The stock is now eyeing ₹1,662 → ₹1,737 → ₹1,845 as upside targets, while support holds near ₹1,536 – ₹1,490 – ₹1,463.
Key Levels:
🔴 Resistance: 1,609 | 1,635 | 1,681
🟢 Support: 1,536 | 1,490 | 1,463
________________________________________
2️⃣ Volume Analysis
Breakout is strongly backed by heavy volume. On breakout day, traded volume stood at 3.34M shares, almost 3.89× its 20-day average (1.15M shares). Such abnormal activity indicates institutional participation, confirming this is not a random spike but a move with strong backing.
________________________________________
3️⃣ Technical Indicators
✅ RSI: 65 → Bullish but not overbought yet
✅ MACD: Daily & Weekly bullish crossover confirmed
✅ CCI: 152 → Shows overbought momentum, supports trend
✅ Stochastic: 97 (Daily) → High momentum zone, short-term overheated
⚡ Multi-timeframe View: Daily & Weekly bullish, Monthly still sideways → Good for swing traders, long-term investors should stagger entries
________________________________________
4️⃣ Trade Setup
📈 Daily Closing Basis Trade
Entry: ₹1,588.20
SL: ₹1,513.77
Target 1: ₹1,662.63
Target 2: ₹1,737.06
⚖️ Risk–Reward: ~1:2 | Momentum strongly in favor
📊 Swing Trade Setup
Entry: ₹1,588.20
SL: ₹1,489.40
Target 1: ₹1,687
Target 2: ₹1,785
🚀 Higher potential: ₹1,845 (Fib extension)
Intraday Pullback level: 1560
Swing Pullback level: 1577
________________________________________
5️⃣ Investment Outlook
📈 Bullish Case – Why CHOLAFIN may go up
Strong bullish candle with massive volume (3.89× avg.)
RSI breakout with MACD crossover
Sectoral momentum in NBFC/finance space
Strong support zone near 1,490–1,460 ensures limited downside
📉 Bearish Case – Watch out for
Overheated stochastic (near 97) may cause short-term pullback
Resistance around ₹1,681–1,735 is critical supply zone
Broader market weakness could stall momentum
________________________________________
⚡ Final Outlook
Momentum: Strong | Trend: Bullish | Risk: Low | Volume: High
________________________________________
💡 Learning Note
This setup is a classic high-volume breakout trade → when price action, RSI, MACD, and volume align, probability of success is high. NBFC sector plays like CHOLAFIN can deliver strong short-term swing moves when backed by 3–4× volume spikes.
________________________________________
📈 Chart Pattern Analysis
CHOLAFIN on the daily timeframe has given a Double Bottom / Inverse Head & Shoulders–type breakout, a classic bullish reversal setup. The two key lows were formed near the ₹1,470–1,490 zone, showing strong demand absorption at that level. The neckline breakout came around ₹1,544–1,550, confirmed with a big green candle and 3.89× average volume, which validates institutional participation. This breakout indicates that sellers failed to push the stock lower twice, and buyers have now taken control, shifting momentum firmly to the upside. Based on the pattern projection and Fibonacci extensions, the upside potential extends towards ₹1,684 → ₹1,760 → ₹1,800, aligning with the 1.0 and 1.272 Fib levels.
________________________________________
⚠️ Disclaimer – Please Read Carefully
The information shared here is meant purely for learning and awareness. It is not a buy or sell recommendation and should not be taken as investment advice. I am not a SEBI-registered investment advisor, and all views expressed are based on personal study, chart patterns, and publicly available market data.
Trading — whether in stocks or options — carries risk. Markets can move unexpectedly, and losses can sometimes exceed the money you have invested. Past performance or past setups do not guarantee future results.
If you are a beginner, treat this as a guide to understand how the market works — practice on paper trades before risking real money. If you are experienced, always assess your own risk, position sizing, and strategy suitability before entering trades.
Consult a SEBI-registered financial advisor before making any real trading decision. By engaging with this content, you acknowledge full responsibility for your trades and investments.
💬 Found this useful?
🔼 Give this post a Boost to help more traders discover clean, structured learning.
✍️ Drop your thoughts, questions, or setups in the comments — let’s grow together!
🔁 Share with fellow traders and beginners to spread awareness.
👉 “If you liked this breakdown, follow for more clean, structured setups with discipline at the core.”
🚀 Stay Calm. Stay Clean. Trade With Patience.
Trade Smart | Learn Zones | Be Self-Reliant 📊

LT - Technical & Trade Analysis📊 Larsen & Toubro (L&T) – Technical & Trade Analysis
________________________________________
1️. Price Action
L&T has displayed a powerful bullish move, closing at ₹3,667.80 (+2.28%) with a strong green candle on the daily chart. The price has broken above the neckline at 3,649, which coincides with the 0.786 Fibonacci retracement level, confirming a bullish reversal from recent lows. With this breakout, the stock is now well-placed to test higher levels at ₹3,731, ₹3,802, and eventually ₹3,931, while key support zones remain intact near ₹3,615 – ₹3,535. This price action clearly indicates a shift in momentum from weakness to strength.
Key Levels:
🔴 Resistance: 3696.83 | 3725.87 | 3777.73
🟢 Support: 3615.93 | 3564.07 | 3535.03
________________________________________
2️. Volume Analysis
The bullish breakout is strongly validated by volume data. On the breakout day, L&T recorded a traded volume of 2,928,060 shares, which is more than 2.38 times its 20-day average volume (1,376,896 shares). Such a significant spike in activity signals institutional buying and strong market participation, a hallmark of reliable breakouts. A VolX reading of 2.38 highlights that the move is not a random uptick but a surge backed by heavy accumulation, adding conviction to the ongoing rally.
________________________________________
3️. Technical Indicators
The technical setup offers multiple confirmations for the bullish bias. The yellow-tagged highlights show that the stock has given an RSI breakout, MACD crossover, Bollinger Band breakout, bullish VWAP signal, and a BB squeeze release, all pointing towards the start of a momentum expansion phase. Additionally, the multi-timeframe indicator table on the top right reinforces this view: Stochastic and CCI are bullish across daily and weekly timeframes, while the MACD is bullish on daily and weekly but still bearish on the monthly, hinting at some caution for long-term investors. Meanwhile, RSI at 61 signals healthy strength without yet entering overbought territory. Together, these indicators align to support the short-term bullish momentum in L&T.
________________________________________
4. Latest Update
Larsen & Toubro (L&T) has been in the spotlight recently with a series of significant developments. The company’s Heavy Civil Infrastructure vertical secured a “significant” order worth ₹1,000–2,500 crore from NPCIL for the Kudankulam Nuclear Power Project (Units 5 & 6) in Tamil Nadu, while it also bagged a major contract from NHSRCL to construct 156 km of ballastless track for the Mumbai–Ahmedabad bullet train corridor. On the flip side, L&T has expressed its intent to exit the Hyderabad Metro Phase I operations citing financial and operational challenges and confirmed it will not participate in the Phase II expansion. Financially, the company posted nearly 30% YoY profit growth in Q1FY26, supported by strong execution and a robust order book, further boosted by these fresh wins. Meanwhile, Chairman S. N. Subrahmanyan highlighted long-term succession planning and clarified remarks on work culture that recently drew public debate.
________________________________________5. Investment Outlook
📈 Bullish Case – Why L&T could go up
Breakout above neckline with volume confirmation
RSI & MACD both turning positive on Daily
Strong support zone at 3615–3560 ensures limited downside
Sectoral rotation into infra/engineering plays could fuel upside
📉 Bearish Case – Potential downside risks
Heavy resistance around ₹3,731–₹3,777 (previous supply zone)
If it fails to hold above ₹3,649, profit booking may drag it back to ₹3,585 / ₹3,535
Macro headwinds (interest rate or project delays) could stall the momentum
⚡ Momentum Case – Short-term Trading Edge
Current move shows "Buy Today – Sell Tomorrow" setup
Entry @ ₹3,674, SL @ ₹3,590.44, Target 1: ₹3,757.56, Target 2: ₹3,841.12
Risk Reward is favorable, supported by strong bullish volume
________________________________________
📅 Short-term vs Long-term Perspective
Short-Term (Swing Trade): Strong bullish case, momentum intact, low risk with clear entry/SL/targets.
Medium-Term (1–3 months): Stock can test ₹3,900–₹4,000 zone if momentum sustains.
Long-Term: Monthly MACD still bearish; investors should add gradually only above ₹3,800+ confirmation.
________________________________________
📝 STWP Trade Analysis
📊 Daily Closing Basis Trade
Entry 3,674, SL 3,590.44, T1 3,757.56 (R:R 1:1), T2 3,841.12 (R:R 1:2).
📊 Swing Trade Setup
Entry 3,674, SL 3,545.40, T1 3,802.60 (R:R 1:1), T2 3,931.20 (R:R 1:2).
Pullback level for Intraday Traders: 3643
Pullback level for swing Traders: 3585
________________________________________
Final Outlook
Momentum: Strong | Trend: Bullish | Risk: Low | Volume: High
________________________________________
💡 Learning Note
This setup demonstrates the power of combining price action, Fibonacci levels, and volume confirmation. A bullish breakout above the neckline with heavy volume plus indicator alignment is one of the most reliable swing trade setups. Double Bottom breakouts with neckline retests + volume confirmation are among the highest probability setups in technical trading
________________________________________
📈 Chart Pattern Analysis
L&T on the daily timeframe has given a Double Bottom Pattern breakout, a classic bullish reversal setup. The two bottoms were formed near the 3,535–3,560 zone, showing strong demand absorption at that level. The neckline breakout came at 3,649, confirmed with a big green candle and 2.38× average volume, which validates institutional participation. This pattern indicates that sellers failed to push the stock lower twice, and buyers have now taken control, opening the path for higher targets. Based on the pattern projection, the upside potential extends towards 3,802 → 3,931, aligning with the Fibonacci extension levels.
⚠️ Disclaimer – Please Read Carefully
The information shared here is meant purely for learning and awareness. It is not a buy or sell recommendation and should not be taken as investment advice. I am not a SEBI-registered investment advisor, and all views expressed are based on personal study, chart patterns, and publicly available market data.
Trading — whether in stocks or options — carries risk. Markets can move unexpectedly, and losses can sometimes exceed the money you have invested. Past performance or past setups do not guarantee future results.
If you are a beginner, treat this as a guide to understand how the market works — practice on paper trades before risking real money. If you are experienced, always assess your own risk, position sizing, and strategy suitability before entering trades.
Consult a SEBI-registered financial advisor before making any real trading decision. By engaging with this content, you acknowledge full responsibility for your trades and investments.
💬 Found this useful?
🔼 Give this post a Boost to help more traders discover clean, structured learning.
✍️ Drop your thoughts, questions, or setups in the comments — let’s grow together!
🔁 Share with fellow traders and beginners to spread awareness.
👉 “If you liked this breakdown, follow for more clean, structured setups with discipline at the core.”
🚀 Stay Calm. Stay Clean. Trade With Patience.
Trade Smart | Learn Zones | Be Self-Reliant 📊

Global Tariff Relief? These Indian Equities Could Shine Bright!Hello Traders!
Big news from the global front — talks of tariff relief between major economies are heating up again. If these discussions progress, it could bring a wave of positivity across the global markets. More importantly, India stands to benefit as a strong alternative in the supply chain realignment story. So let’s explore which Indian sectors and stocks may shine the brightest if this global tariff relaxation becomes reality.
Why Tariff Relief Could Boost Indian Equities
Lower Global Tensions = Higher Risk Appetite: Markets generally rally when trade tensions reduce, boosting FII confidence.
India as a Trusted Export Partner: Global firms are shifting away from China. Tariff easing may boost Indian exports in sectors like textiles, pharma, and chemicals .
Better Margins for Exporters: Reduced tariffs mean better profitability for Indian companies with international exposure.
Sectors to Watch if Tariffs Ease Globally
Textiles & Apparel: India could become a preferred manufacturing hub.
Specialty Chemicals: Key beneficiary as India already replaces China in global supply chains.
Pharmaceuticals: Low-cost, high-quality drugs from Indian firms may find smoother access to developed markets.
Auto Ancillaries & Electronics Manufacturing: Benefit from stable trade policies and global outsourcing.
Rahul’s Tip
Tariff relief = margin relief. Focus on companies with strong exports, lean cost structures, and consistent order books. That’s where the real swing is.
Conclusion
While global headlines may seem distant, their impact on Indian markets is direct and powerful. With global tariff relief on the table, sectors like textiles, chemicals, and pharma are likely to benefit first. Keep an eye on these sectors — and get ready to ride the trend if it confirms.
What are your top stock picks for a global trade bounce-back? Let’s chat in the comments!

US Tariffs on China: A Golden Opportunity for Indian Stocks?Hello Traders!
Big global events often bring hidden opportunities — and the rising US tariffs on Chinese goods might just be one of them. As the US tightens its trade policies, many global companies are rethinking their dependence on China. This shift can open the doors for India to emerge as a strong alternative in the global supply chain .
Let’s break this down in simple terms and understand how this could impact Indian stocks — and where you should keep your eyes!
Why US Tariffs on China Matter
Higher tariffs = Higher costs for Chinese goods: This forces US and global companies to find new, cheaper sources of manufacturing.
India as a rising alternative: With strong IT, pharma, textiles, and manufacturing sectors — India becomes a natural choice for global diversification.
Make in India boost: Govt. schemes like PLI (Production Linked Incentives) are encouraging companies to build and scale within India.
Sectors & Stocks to Watch in India
Textiles & Apparel: With global buyers moving away from China, Indian textile giants may see export growth.
Auto Ancillaries & Electronics Manufacturing: Sectors supported by PLI schemes and rising domestic demand.
Pharma & Chemicals: Global shift in supply chain dependence can benefit Indian API and specialty chemical makers.
IT Services: Increased outsourcing opportunities as companies look to optimize global operations.
Rahul’s Tip
When the world shifts — smart traders shift focus too. Don’t just watch the headlines — dig deeper to see who benefits indirectly from global tensions.
Conclusion
The US-China trade tensions could be a game changer for Indian industries. As supply chains move, India stands to gain — and as traders, we must stay ready. Track sectors that are export-heavy, backed by govt support, and showing rising demand.
Do you think India can rise as a global manufacturing hub? Share your thoughts in the comments below!

HSCL - LETS SET A TARGETNSE:HSCL
Himadri Speciality Cheimical Limited , formerly Himadri Chemicals & Industries Limited, is engaged in the business of manufacturing various grades of coal tar pitch and other byproducts derived during the distillation process.
TTM EPS: 1.70
TTM PE: 41.59
Sector PE: 79.00
Book Value Per Share: 42.78
P/B: 1.66
Face Value: 1
Mkt Cap (Rs. Cr.): 2,962
Dividend Yield: 0.21
Some Positives:
New 52 Week High
Good quarterly growth in the recent results
Growth in Net Profit with increasing Profit Margin (QoQ)
Company with Low Debt
Increasing Revenue every quarter for the past 2 quarters
Book Value per share Improving for last 2 years
Company with Zero Promoter Pledge
FII / FPI or Institutions increasing their shareholding
Stock gained more than 20% in one month
Strong Momentum: Price above short, medium and long term moving averages
My Opinion: It is a Stage 2 stock. I won't be surprised if it gives 2x 3x returns. Keep a eye on 50-200 EMA crossover also in future.
NOT A RECOMMENDATION. JUST FOR EDUCATION. Thanks.


Negative Divergence in Nifty Daily on 13th Sept HighNifty Daily creates a negative divergence on 13th Sept, where price attains a HH without RSI follows it (see the brown circles in price/RSI).
Per common wisdom, negative divergence needs to correct below the previous swing low (29th Aug @ ~17200) to correct the divergence.
Now how far?
Well the next Fib support is at golden ratio ~17000.
Just empirical - whatever eyes see in chart.

Live Challenging Signal BUY INDIA NIPPON @ 376.20
Signal Specification
Pair: INDIA NIPPON
Entry Type: Buy
Entry1: 376.20
ENTRY2: 210.20
Tp1&2: 592.80
Sl1: 311.50
Sl2:133.05
R/R: 4.97
Our Unique Features:
—————————————————————
1. Follow our 15 signals ….10% equity will increase in your account for sure.
2. We are not Trailing stop! or average the trades.
3. 2% Risk Management Per trade.
4. Risk vs Reward up to 1:7.
Note:
Trade signals would usually have a risk to reward ratio of 1:2.
It means that even 2 out of 4 signals hits their SL marks, the other two would have closed with profit.
This allows you to be good in overall pips profit.
Signals are usually inter-day (Based on the daily candle) therefore, trades would usually have a holding time of an average minimum of 24 hours.
Note: Everything works with Best money management.
Note: Please leave comments for any query.
Disclaimer: This is my trading experience, it is not an invite or recommendation to trade.
Best Wishes
Forex Tamil

Pullback Expected in Banknifty tomorrowMarket cannot move in one direction
Back to back 4 green candles on daily timeframe
Pullback & profit booking required for fresh buying
RSI Divergence

Pullback ExpectedA divergence in the volume shows chances of a pullback to continue the upwards movement! 17500 was a strong psychological resistance acc. to option chain which was broken today by good movement and there has been a heavy call OI build up qt 18000, suggesting some Call Writing in heavy quantity which indicates a psychological resistance at that level according to the option chain. Do not underestimate the pullbacks in a trend! Go for CE and hold the positions until expiry or until it reaches 18000.

IDFC 3 week tight closesIDFC looks good at CMP with an 8% stop. The only concern I have here is the upcoming earnings release.
I

TATAPOWER exactly bounce from final support.expecting pull-back in price up to 39 above is easy after already taken support as 31.45 .
This stock is also good for the investor's portfolio and I have uploaded levels for it in the last post.

BSE: Possible BUY on the back of misfortunes of NSEBSE is no threat to NSE on any possible metric. After NSE's listing, it will benefit only to the extent that NSE will be listed on BSE !
Its in a parallel channel since April.
Now at 572, its a buy.

TAMO TATAMOTORS should breakout to the 360 areaTATAMOTORS has been moving sideways charting out a triangle. Looks all set to breakout to the 360 region.
TLong

Apollo hospitals 15 mins Flag and pole Please refer to chart for the analysis .
Share your ideas ,like and subscribe
@Note : Not responsible for any loss / damage ,refer to your analysis/stock analyst before initializing

NIFTY 50 DAILY CHARTMarket follow elliott wave theory on the daily chart. Down trend is not confirm at this time if it break its lower low then we can say downtrend is confirm

BSE:SENSEX is at ATH but rejected by a 15 month old trendlineBSE:SENSEX has recorded a All Time High today(26-Nov-19) but it was rejected by a trendline that extends from August 2018 till today. If this trendline is broken on a daily closing basis then I am expecting SENSEX to continue to the upside.

IndiaCem Buy Setup!IndiaCements Stock looks good after a 50% retracement from the recent rally. The stock could start going higher from current levels or retrace a little more till 61.8% fib levels and then going higher towards the target of 95 and 100. Keep a stoploss just below 75 levels.
#indiacements #nifty50 #nseindia #bseindia

VPDDS Methodology Trade - ADANIENT Trade Planned on 20th June 2019 using Volume Profile Driven Demand and Supply.
Trade Entry, StopLoss and Target details
Entry Planned @ 146.15, StopLoss Planned @ 145.05, Target Planned 150.65
Trade Executed on 21st June 2019 9:15 AM and Target Achieved..

INFY, price overlapping seen in it.Our last research was INFY achieved the target, click here .
--------------------------------------------------------------------------------------------------------------------
Closely analyzed about price overlap . Buying really good as per last overlapped and close with higher of closed from a prior high of the candle. Its indicate that you may see a spike on it which mean big move in price.
I don't recommend to buy below 728 .
If you are buying this stock, then exit at your suitable price for profit .
Term of Overlapping: Buyers are fearing to take a long position, that why we see price overlapping with low volume. any side breakout in the price possible big because fear will go.

RAMCOSYS Long ideaRamcosys given very nice breakout with super volumes ...cmp 411..go long for 500..
