INDUSINDBK


MOMENTUM TRADE IN INDUSIND BANK (FUT)MOMENTUM TRADE IN INDUSIND BANK (FUT)
BUY @1454
STOP@1436
TARGET@1474-84
LOT:400
QTY:2

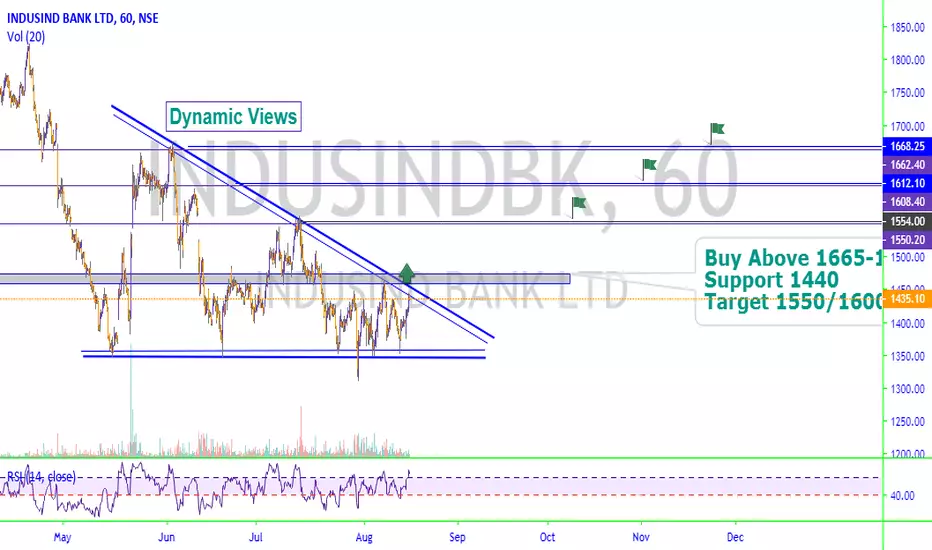
DESCENDING TRIANGLE PATTERNBUY ABOVE 1454 STOP 1440 THE CHART FORMS A DESCENDING TRIANGLE PATTERN ON A BEAR TREND ACCOMPANIED WITH DESCENDING VOLUMES. THE BREAK OUT WOULD BE MOST POSSIBLE ON THE UPSIDE. NEVER SELL THE STOCK AS FAR AS THE NIFTY IS BELOW 10800 AS THE STOCK MIGHT BOUNCE BACK HEAVILY. IF BOTH PARAMETERS OF BELOW 1350 IN THE STOCK AND 10750 IN THE NIFTY IS DONE.. THE SELLING WOULD START AND POSSIBLE TARGET WOULD BE 1170 ON THE DOWNSIDE.. AT PRESENT BE BULLISH ON THE STOCK FOR AN UPSIDE TARGET OF 1550

INDUSIND BANK - 15MIN - Short Trade with a good R/RIndusind bank is hovering just below its previous broken trendline. The stock is in a 15min correction just below the trendline indicating a potential drop. This trade has a good risk-reward ratio with a tight stoploss.
Entry - Only after 1385 has been broken to the downside.
Stop - 1410
Target 1 - 1351
Target 2 - 1312
Disclaimer
This content is for information and educational purposes only and should not be considered as a piece of investment advice or an investment recommendation. Past performance is not an indication of future results. All trading carries risk. Only risk capital which you are prepared to lose.

Keep Eagle EyeKeep an eagle on Indusind bank
Key level - 1350 (If it manages to break it then my first target will be 1250 and final target will be 1050)


Indusind bank- Trading ABCD patternLets have a look what we got for trading
For Bulls -->
We already mentioned 2 targets in our previous idea of the indusind bank for targets 1550/1650, first target was achieved and it fell from the same levels as it had major resistance of 200 and 100 Dma and kumo cloud, now the daily chart might not look great for bulls, but lets see how we might see this as a reversal point for bulls to go long.
1. Formed ABCD pattern
2. EW rule --> corrective wave doesn't breach start of wave 1
3. Fibonacci cluster retracement and extension at current level
For Bears -->
Since it fell from 200 and 100 DMA and after filling the gap at 1550 level, breaching 1399 may push the scrip towards 1375/1350, but bears got nothing to trade till it doesn't fall below 1348 levels, which is major support level.
Trading Plan for bulls -->
Keeping the fact that this scrip is trading below important moving averages indicating weakness, we have many other factors for bull to make a strong comeback as mentioned above.
Trading/holding above 1400 levels for targets --> 1485/ 1555/ 1600/ 1655
SL - 1399
Here, trading above 1400 means different for individual trade, can use own strategy, an individual can also wait for whole trading session to see what candlestick pattern it makes.
No trading if falls below 1399
Regards,
Sharma Yogesh


INDUSIND bank Buyers are in ControlBuy at CMP 1470 Stoploss 1430 Target 1540-1570 Reasons for Trade- 1. Weekly Chart has formed good Base with strong candlestick pattern 2. On Daily Chart price has closed above important support lvele. 3.Price has taken support on 200 EMA on Daily Chart. 4. Risk Reward is 1:3

Indusind Bank : Break of long term trendlineIndusind Bank has broken long term trendline on weekly chart. It has also started making lower top lower bottom structure on closing basis. Trend has changed to down. On lower side supports are at 1333 & 1265. Short term bounce can be expected from 1250-1270 zone towards 1550.


INTRADAY INDUSIND BK buy above 1670 target 1684,1699 sl 1658
sell below 1640 target 1626 1610 sl 1653


Indusind Bank - Tweezers Bottom candlestick pattern formationIndus-Ind Bank has formed Tweezers Bottom candlestick pattern after a good downtrend.
Buy above - 1445.50
Target - 1461, 1483, 1508
SL - 1430
