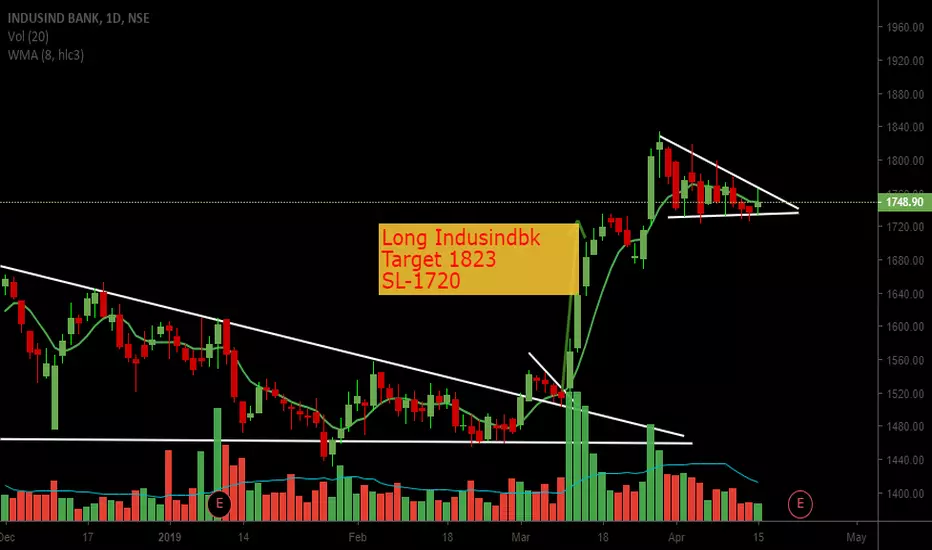
INDUSINDBK


Bank Nifty ATH: Soon to be witnessedNifty made an All Time High (ATH) of 11810 on April 16, 2018, however Bank Nifty is catching up, it first has to touch its previous high of 30646 levels and then surpass that level to make a ATH.
According to me the ATH in Bank Nifty would soon be conquered at 31070-31100 levels. Its a matter of when and not how.
Well the set up seems to be quite robust, given the uptrend in various individual Banks, I have posted the charts for each individual Bank as well.
Well HDFC Bank is also in a clear uptrend, though a clear pattern couldn't be spotted (on hourly basis), hence I did not put that chart here.
P.S. These are my views, doesn't mean anyone should take random trades basis this. Please do your own analysis or consult a reliable adviser.

Bullish Gartley IndusInd Bank Bullish Gartley IndusInd Bank
Prz - 1704 - 1714.50
Sl - 1697
Target 1 - 1731
Target 2 - 1743

INDUSINDBK descending triangle INDUSINDBK is near its support and forming descending triangle. If given breakout, we can go short.


MOMENTUM TRADE IN INDUSIND BANK APR FUT) MOMENTUM TRADE IN INDUSIND BANK
APR FUT
STOCK NEEDS A CONDITIONAL STOP ABOVE 1800
FUTURES CHART BUY
BUY@1795(ABOVE1790 CLOSE REQUIRED)
STOP@1775
TARGET@1825
LOT:300
QTY:3

Looking Like Picture Perfect #Zigzag Formation!!!NSE:INDUSINDBK Bears Are Still There !!! After This Bear Pump, Bulls Are Going To Dump !!! :)


INDUSINDBK | More StrengthINDUSINDBK has crossed important resistance of 1645-50. and closed above it. One can try long into it at around 1650-60 with SL below 1622 (Close). for Targets 1755 and 1880.


INDUSIND BANK DAILY SYMMETRIC TRIANGLEINDUSIND BANK, DAILY symmetric triangle, end is nearing soon
I expect the break towards downside. views are welcome


Indusind Bank trying to break down.NSE:INDUSINDBK
Closely track this counter.
If closes below trendline then there is more pain.
View negates if closes within triangle range.

INDUSIND BANK , Support & Resistance Area , 19 Feb 2019I would greatly appreciate , if you give me LIKE .
Follow NEVADA TRADING to get notification at e mail - for all new Trading ideas
Idea is for positional trading not Intraday trading.


Descending Triangle Breakout - Bearish Continuation PatternIndusindbk Short below 1471
Stop-loss 1490
Target 1406
Risk 1.29% And Reward 4.42%
RR Ratio 1: 3.42
Bearish Continuation Pattern
Descending Triangles
In this “flat-bottom” triangle, the bottom trendline is horizontal and the top trendline slopes downward. The pattern illustrates lows occurring at a constant price level, with highs moving constantly lower.

Indusind Bank : Sell Below 1545, SL 1610, Target 1470, 1360Indus bank is in the consolidation phase after a big downfall. If this triangle consolidation breaks on the downside downtrend will continue.
