INDUSINDBK

!!SYMMETRICAL TRIANGLE FORMATION IN INDUSIND BANKS!!SYMMETRICAL TRIANGLE FORMATION IN INDUSIND BANK
JAN FUTURES
PATTERN IS VISIBLE IN THE DAILY CHART
HAS A NEARBY RESISTANCE AND SUPPORT
VOLATILITY AFTER RESULTS SHOULD NOT BREACH THIS LEVELS
!!PLEASE NOTE THAT!!
BREAKING OUT OF PATTERN ON FINANCIAL RESULTS ALWAYS
RESULTS IN CLEAR DIRECTION AND TREND FOR MEDIUM
TERM!!
!!TODAYS BREAKOUT WILL BE A DIRECTIONAL BREAKOUT!!

INDUSINDBK (Indusind Bank Ltd) #SELL BELOW BELOW 1550INDUSINDBK (Indusind Bank Ltd) #SELL BELOW BELOW 1550


Indusind result rally on 15-10-2018Roller coaster or one way direction on result day..!
Note : Not for trading
Advice - New traders or Safe traders dont touch the result rallies..!

MyAlgo : xMRSI-Progresser: Intraday : 05Oct-INDUSINDBK-ShortBased on my xMRSI-Progresser predictive trading methodologies, its going to be a RED candle on 05-Oct-2018 for INDUSINDBK
Sell Below(5Min candle close): 1585.5 for targets -
T1: 1573.6
T2: 1566.5
T3: 1559
SL: 1598.2
Note: These calls are based on my own analysis. It may or may not work well for you.So please carefully consider whether it is suitable for you and please do your own research before attempting any. The profit/loss made by you due to this call, is solely your own responsibility. Thanks, All the best. Happy Trading. :-)

#banknifty levels and views for october#BANKNIFTY for me risk reward i see good on long side , thus its better for me to go long with stop below 24800.

Idea#6 Opportunity in INDUSIND BANKINDUSIND BANK is trading near to 300 EMA and also in oversold zone as per RSI.
Here is an opportunity to make long or short the IndusInd Bank. Below are the stats for your consideration:
Buy Side Stats:
CMP: 1762.45
Buy above: 1760
SL: 1750
TGT: 1810
Sell Side Stats:
CMP: 1762.45
Sell below: 1750
SL: 1760
TGT: 1660
Note: Do not trade without Stop Loss


MyAlgo:xMRSI-Progresser:Intraday call:18Sep-INDUSINDBK-LongBased on my "xMRSI-Progresser" predictive trading methodologies, its going to be a GREEN candle on 18-Sep-2018 for INDUSINDBK
Buy Above(5Min candle close): 1881.7 for targets -
T1: 1895.8
T2: 1904.3
T3: 1913.1
SL: 1866.6
Note: These calls are based on my own analysis. It may or may not work well for you.So please carefully consider whether it is suitable for you and please do your own research before attempting any. The profit/loss made by you due to this call, is solely your own responsibility. Thanks, All the best. Happy Trading. :-)

INDUSIND BANK TrendlineINDUSIND BANK i bouncing off Trendline . Made Doji_Cross at support n trendline inter$ection . Awaiting breakdown/Reversal

Long INDUSINDBK above 1874Enter Long in INDUSINDBK above 1874
Target - 1880, 1886,1892 & 1900
Sl- 1863


Indus Ind Bank support and resistance level Chances of volatility is probably high on any result/earnings day.
Better to know the resistance and support levels if anyone is trading with these stocks so that the enter/exit points are known and stop loss can be calculated in advance to avoid losses/make gains.

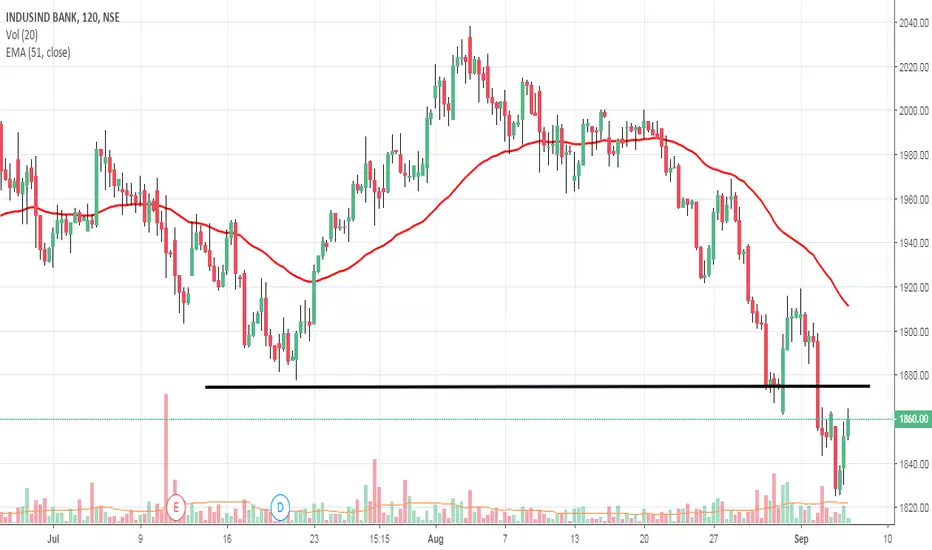
Short IndusindbkEntry levels Mentioned on chart.
I will go Short in INDUSINDBK below support levels for further downside.
****Might be retraced back from 1928-26 as having strong support at those levels****

Short Indusindbk Entry levels Mentioned on chart.
I will go Short in INDUSINDBK below support levels for further downside.
****Might be retraced back from 1928-26 as having strong support at those levels****
