Infy: Follow NEWS & be reactive or follow Charts & be a ahead !!Infy
This is not a fresh recommendation. This is just a follow up to our post on 09th April 2021. This is what we had posted
Observations
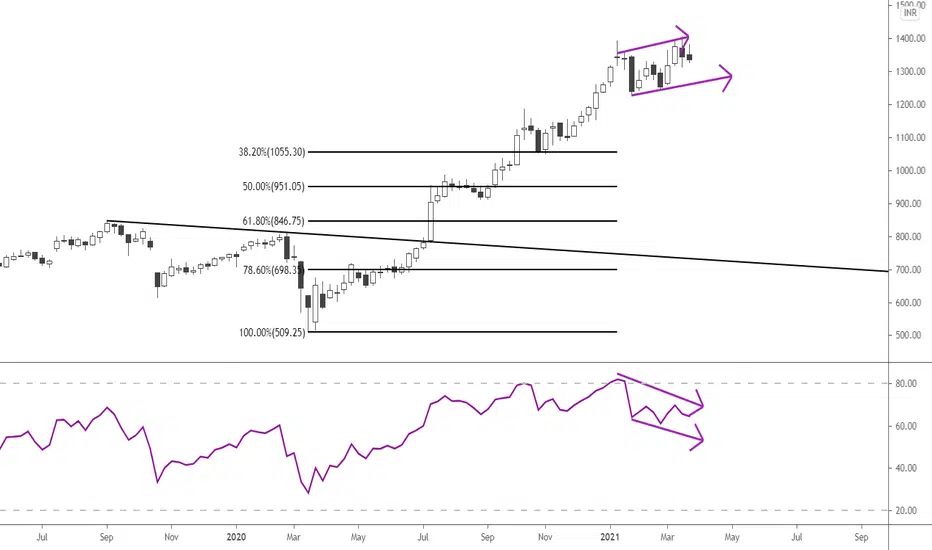
- Infy trading in the yellow channel from July 2020
- on previous 2 occasions, before the result announcement we observe Infy near the channel top
- Infy makes a high on result announcement at the top end of the channel and then drops down
- after Jan 2021 result announcement, we observe the yellow channel being breached twice temporarily
Is this a cue that strength of the buyers getting weaker...???
if we observe Infy getting rejected at the median of the red channel, then there is a possibility of Infy shifting to lower blue channel
Infy had a NEWS event - Result announcement on April 14, 2021.
If you have read the analysis in the above post, see the Infy price movement and Notice how charts revealed every thing before the NEWS event.... and worked to perfection....
That's the magic of Technical Analysis...!!!
Charts do try to tell us a lot.... Are you ready to listen... ???
Choice is yours
Was it a good analysis...?
Do Comment, Like and Follow...
Have a good day
INFY

Infy: Result, Chart set up and trading strategyInfy (CMP 1444)
We have INfY result announcement next week on 14 April. Results are expected to be good.
Let us look at what the chart is saying...
Observations
- Infy trading in the yellow channel from July 2020
- on previous 2 occasions, before the result announcement we observe Infy near the channel top
- Infy makes a high on result announcement at the top end of the channel and then drops down
- after Jan 2021 result announcement, we observe the yellow channel being breached twice temporarily
Is this a cue that strength of the buyers getting weaker...???
if we observe Infy getting rejected at the median of the red channel, then there is a possibility of Infy shifting to lower blue channel
Given the chart set up, Trading strategy for Infy
One may consider selling Infy 29-April 2021 expiry
1540 Call option currently trading around 20
Max profit potential in the strategy Rs 12000/- per lot
More importantly the strategy has an in built stop loss protection up to 1560 till 29 April expiry day
(Channel top around 13 April comes to 1560 level)
Take care & safe trading...!!!
Disclaimer :
- The view expressed here is my personal view
- Past performance is not a guarantee for future predictions
- Use this for educational purpose
- Any decision you take, you need to take responsibility for the same
- It's your hard earned money. Treat it wisely
- Trade / Invest keeping in mind your trading style, goals and objectives, time horizon & risk tolerance
- if trading in F&O, understand that F&O trading involves risk
- Do take proper risk management measures
- Do your own analysis and consult your financial adviser if need be

INFOSYSY detailed harmonic rule studyThe pattern you are seeing is "THE PERFECT" crab pattern which is rarely seen . Now as a rule D point must complete at 1.618 levels and is combined with 3.14 of BC . Then, immediately as the market opened a large red candle at D was made you can see time is 9:15 AM it may have gapped up and fell. We need to be careful if at POTENTIAL REVERSAL ZONE there is a gap , long tail or very large price action .Now the next rule tells it must fall or retrace till 50% as a result it came up again from 1375(though it is .618 level) but recovered quickly and reached 50%.
Now according to me it must reach and retest previous high which is our large candle at D
Now let it first reach 1462 again then we will continue our view with new target with new highs.
good luck
Maintain stop loss of 1344
disclaimer: i bought today at 1398 you can long too at your own RISK :)

INFYinfy currently forming channel structure and also announced 4th quarter result so take your position carefully.

INFY ON HOURLY CHARTINFY on hourly chart is sustain above 200 EMA indicating that stock is still in uptrend. Also observing closely we saw that 200 EMA and Fibonacci 61.8% acted as a very strong support for the stocks. Now talking about oscillator, MACD is giving a really good Divergence between price and momentum. Macd divergence with reversal from levels with good volume is indicating that we can look for long setup. Intraday targets are given on chart. Trade at your own risk. Play safe. Strongly maintain your stoploss .


INFY RETEST AND BREAKOUTINFY has already given a breakout on daily TF. According to 15min TF it has given breakout of the trendline. can buy this stock for intraday tomorrow for target of 1425, and if it sustains above 1425, can take it into swing position also.

Infosys - Cup and Handle indicates strengthThe Infosys chart shows a very clearly visible Cup and Handle pattern - indicating continuing strength. Look for new highs towards the indicated target region

Infy BreakoutINFY gave break out from a bullish cup & handle pattern. Breakout with good volume. Can give good returns of 8-10% in short term, If dollar & CNXIT stays strong.
Support: 1385-1390 & 1320-1330 levels.

INFY LONGInfosys gave breakout from an bullish cup & handle pattern with good volume, strong dollar will back it up!!

Infosys_10% upside for a target of 1550Date: 05 April 2021
Infosys has formed a bookish cup and handle pattern. It can give 10% upside.

INFY1405.90 has STRONG RESISTANCE, BUY ONLY IF BREAKS THIS LEVEL, and 1405.90 will become SUPPORT and STOP LOSS.
OR else Go for SHORT if Breaks SUPPORT (Blue line) STOP LOSS 1405.90.
NOTE: These targets are for only POSITIONAL traders/LONG Term Investors not for Intraday traders.

INFY | Breakout | Swing TradeTech giant INFY is about to break out and could trade at an all-time high price.
1D TF suggests consolidation inside the big green mother candle.
Breakout:
Major supply/resistance zone
High of the mother candle
Psychological level (1400)
Keep it on your watchlist!

INFY : Possible breakout in daily & weekly chartsFor educational purpose only!
A breakout is possible as per daily & weekly charts.. wait for 1400 levels for confirmation.. follow strict stop-loss as per risk appetite..

INFOSYS LTDINFOSYS LTD is on the verge of Breakout.
Setup- Cup&Handle Pattern
Keep on Radar.
Getting Ready for Breakout
Entry After Breakout and Again enter at retest Set Up Prepare
Stop Loss for Short Term 1340
Stop Loss for Mid Term 1300
Stop Loss for Long Term 1230
I am not a SEBI registered adviser. All the information provided by me are for educational/informational purposes only. Never invest more then 2 % Capital In Single trade. Trade on your own Risk and analysis
@CapitalGain360


Infosys - Cup and Handle PatternNote: This is for educational purpose only. Please do not trade in F&O based on this analysis.
There seems to be a cup & handle formation with RSI just crossing 60. Nifty IT is outperforming Nifty Index today as well. Price above 1400₹ should see more upside.
SL: 1315₹

Investing OppurtunityInfosys has just taken a support from its long on going trend line. Expected to reach 1400 by March end.

Stock looks weak below 1325NSE:INFY
The stock looks weak below 1325 might head lower towards 1300/1275/1230 levels in the coming days.
--Sell below = 1325
--Target = 1300 | 1275 | 1230
--Stop-loss = 1360
--Expected Profit = ( 7 % )
--Expected Holding = 10-15 days only
All ideas shared are for educational purposes.

INFOSYSExpect good profit booking in this counter in coming days. If some 1 is holding position then he/she must exit it.
Infosys - Wednesday Trade | 24th MarStock is trading in a channel - move on either side of channel (5 min candle close) can give decent movement in intraday.

Is Infy going to test 1250 odd levels?The stock seems to form the double top pattern and it may test 1250 levels soon. If it breaks it we would see a further bounce.
To motivate me, Please like the idea If you agree with the analysis.
Happy Trading!
InvestPro India Team

Beginner's analysis. Hey Traders,
Infy made butterfly bearish Harmonic pattern.
We an expect correction here.
Have an eye.
Keep supporting and guide me if there's any mistake or improvement needs to be done.
