#ADANIPOWER – Double Top Danger Zone!📉⚡ #ADANIPOWER 🚨
ADANIPOWER has formed a monthly double top 🔝 near the 179–183 (ATH) zone and is now slipping toward its rising trendline 📉
Price is also trading inside the September monthly candle (182.70–120.00). MCB or sustained close below 120 will signal major weakness ⚠️👇
If selling continues, price may head toward 112.50–124, 92–96 , and the breakout retest supports at 83–87 .
Bulls must defend the trendline to avoid a deeper correction 🛡️🔥
Resistances: 151.20 / 179–183 (ATH)
#ADANIPOWER #PriceAction #DoubleTop #ChartPattern #InsideBar #CandlestickPattern
📌 #Disclaimer: This analysis is shared for educational purposes only. It is not a buy/sell recommendation. Please do your own research before making any trading decisions.
Inside Bar

How to Backtest, Create a Strategy and Execute a Trade In this video I have showed a good trade is executed with proper planning and mindset .
Charts Used in this video are older than 3 months . Only for educational content .

Master Inside Bar Strategy with this Twist ( Wtf edition )Learn how to create a simple strategy and simply backtest it on Trading view .

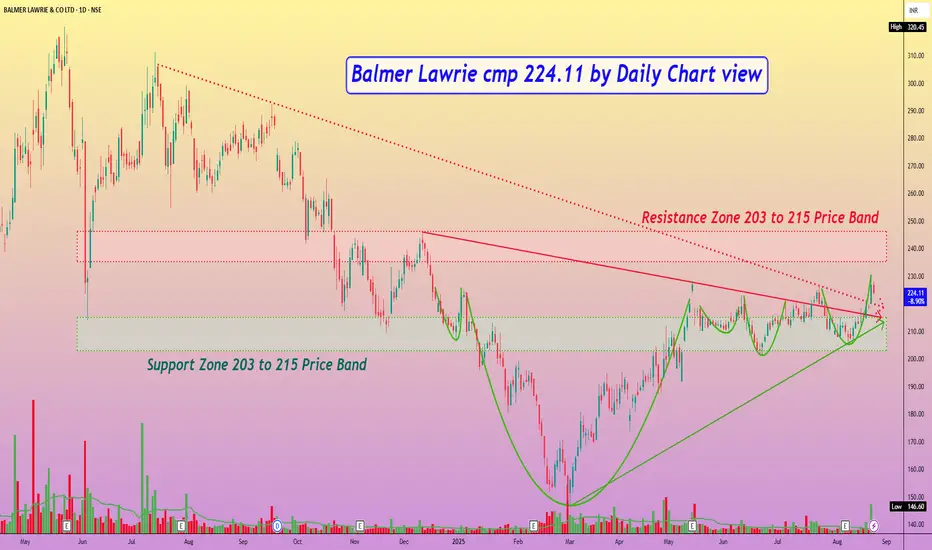
Balmer Lawrie cmp 224.11 by Daily Chart viewBalmer Lawrie cmp 224.11 by Daily Chart view
- Support Zone 203 to 215 Price Band
- Resistance Zone 203 to 215 Price Band
- Multiple Bullish Rounding Bottoms around Support Zone
- Both Falling Resistance Trendlines Breakout seems sustained
- Heavy Volumes surge on Friday post close sync with avg traded qty
- Upwards Price momentum has well respected the Rising Support Trendline
- [ b]*Inside Bar made on Friday closure, indicates observing caution either a Breakout or Breakdown*
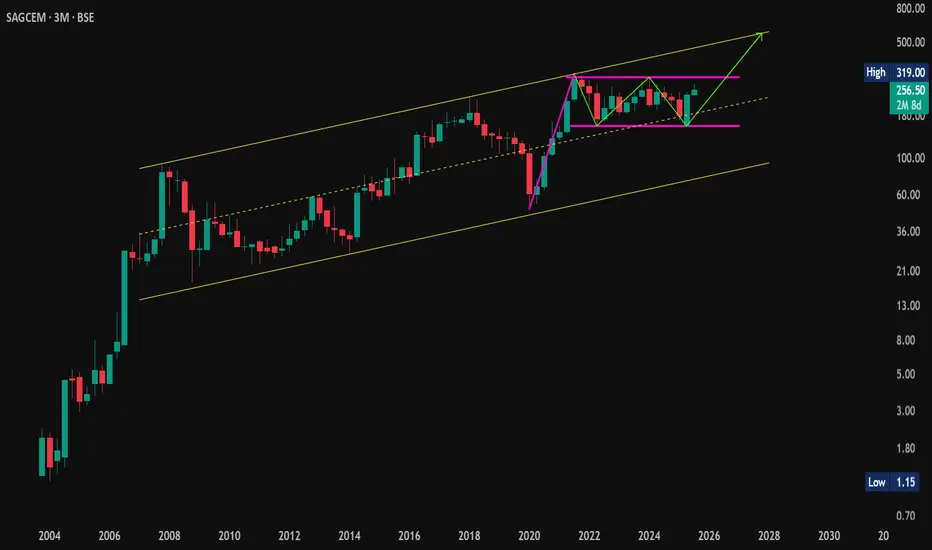
Flag + W Pattern Combo on Monthly! | #SagCem On Radar🔍 #OnRadar
#SagCem (Sagar Cements Ltd.)
🚩 Flag + W Pattern Combo on Monthly!
📈 Chart Timeframe: Monthly & Quarterly (Educational Observation Only)
📊 Technical Structure Overview:
A rare confluence of bullish patterns spotted:
🚩 #FlagPattern — classic continuation structure
🔻🔻 #WPattern (Double Bottom) — bullish reversal signal
🔼 Both developing inside a long-term #AscendingChannel
🎯 Potential Pattern Projections:
Flag Target: 560+
W Pattern Target: 450+
🛡 Support Zones:
255
234–209 (Demand cluster)
❌ Pattern Invalidation:
Below 155 on Monthly Closing Basis (MCB)
🧠 Educational Note:
When multiple bullish structures align on higher timeframes, they often lead to explosive moves—if validated by breakout and volume.
⚠️ Disclaimer:
This is not a buy/sell recommendation. Shared strictly for educational and technical study purposes. Always consult your financial advisor before acting on any market insights.
#PriceAction | #TechnicalAnalysis | #ChartPatterns | #FlagPattern | #Wpattern | #AscendingChannel | #InsideBar | #LongTerm
Inside Bar Reloaded: 5 Years of Silence Before the Storm?🔍 #OnRadar
#SagarCem (Sagar Cements Ltd.)
Inside Bar Reloaded: 5 Years of Silence Before the Storm?
CMP: 264
📊 Technical Structure (For Educational Purposes Only):
The stock has formed a repeating #InsideBar pattern, a price action setup often observed during consolidation phases.
🔄 Pattern History:
📍 Previously, the stock consolidated for 9 years within a defined Inside Bar range (also called the #MotherBar ) before giving a +240% breakout move .
📍 Currently, it's again consolidating for the past 5 years within a similar Mother Bar structure.
🔑 Key Levels:
Inside Bar Range: 128 – 319
Breakout Level (Above Mother Bar): 319
Pattern Projection (If Breakout Happens): ~510 (Range Projection)
📎 Observation Note:
While history doesn’t always repeat, price structures like these are closely watched for signs of momentum post-breakout.
⚠️ Disclaimer: This is not a buy/sell recommendation. Shared strictly for educational and observational purposes. Consult your financial advisor before making any investment decisions.
#TechnicalAnalysis | #ChartPatterns | #InsideBar | #MotherBar | #PriceAction | #LongTerm

Powergrid - 10% Upmove possible?!!!Chart patterns suggest me the above titled opinion
1. Monthly chart shows a Mother baby candle (feb and march 2025)
2. Weekly chart too shows a good inside bar candle with good volume support and Breakout visible (shown below)
3. In daily time frame, there is an expanding channel pattern... . Higher high formed indicates a bulls edge .
4.Let's wait for the Breakout and enter the trade
5.Target levels mentioned @ chart.
This is just my opinion...not a tip nor advice...
Thank you!!!!

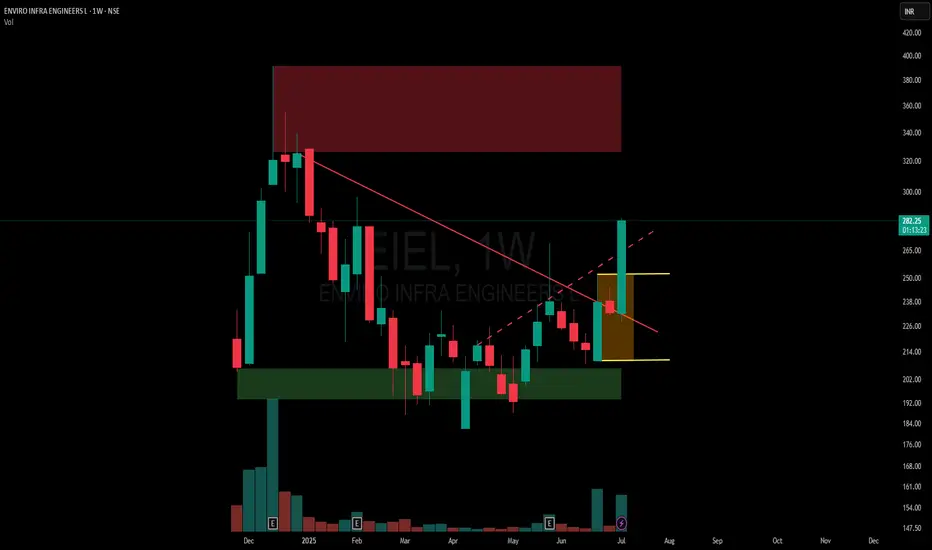
Inside Bar Ignites a Clean Breakout🟢 Simple Breakout Structure | Supply-Demand Flip
✅ Strong demand zone formed after multiple rejections
🔻 Previous supply zone clearly respected
📉 One active counter-trendline broken
🔍 Breakout of mother candle with an inside bar setup
📈 Volume expansion on breakout
🟠 Also broke a hidden resistance line, adding confluence
🧭 Chart structure remains smooth and clear, respecting zones well
No predictions. Just structure.
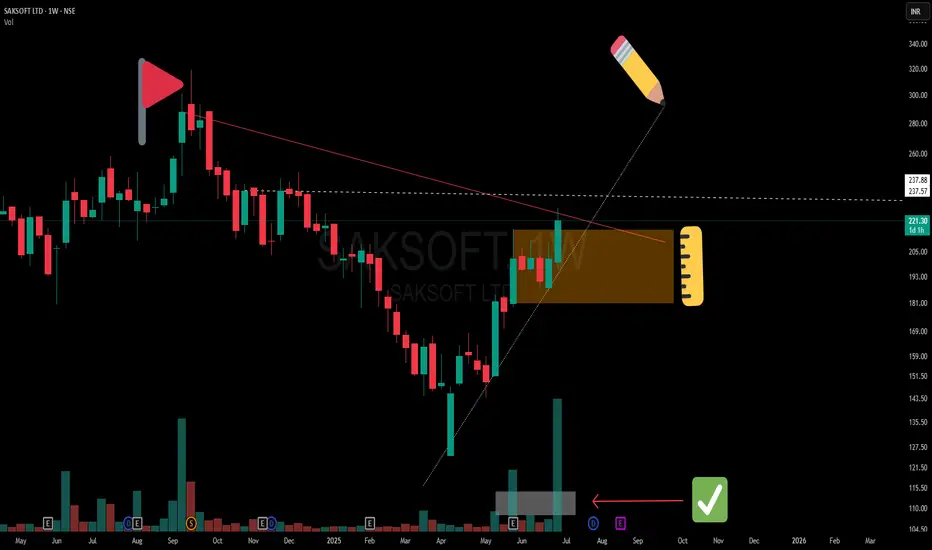
Precision Meets Patience | SAKSOFT Chart WTF🔻 A clean Control Trendline (CT) drawn from the all-time peak (🔺) on the Weekly Time Frame (WTF) shows a long-term price memory resistance finally getting tested.
📏 Overlapping that is a hidden horizontal resistance (⚪ dotted white line), representing the final hurdle before the stock can challenge the supply zone.
🟧 Mother Candle Structure: A powerful consolidation candle has now been broken with strength, giving us structure + intent in one move.
🔊 Volume speaks! We’ve seen two separate clusters of high volume, confirming active participation—not a lonely breakout.
📈 The trendline from bottom left is giving both body and wick supports—a technically clean angle where structure meets sentiment.
📝 Note:
This is a structural breakdown meant for educational and analytical purposes. Not a forecast or recommendation.
Inside Bars After High Volume – CERA Setting Up Near Key CT📌 Timeframe: Weekly (WTF)
📌 Type: Technical Observation / Swing Structure
📌 Concept: Counter Trendline Breakout Setup
CERA is currently navigating a highly constructive zone from a swing trading lens. Here's what's developing technically:
🔹 Higher Low Formation:
The stock has established a higher low structure, with the white internal trendline offering visible support across recent weeks. Interestingly, this aligns perfectly with the 200-period EMA on the weekly timeframe, enhancing its significance as a dynamic support layer.
🔹 Volume Clues:
Two of the highest volume candles on the weekly chart have now been followed by inside bars, a potential sign of absorption or base building. This tightening within volume zones signals institutional interest and a possible buildup phase.
🔹 Supply Zone Identified:
An overhead supply (marked in orange)
🔹 EMA Context: The blue 200 EMA further reinforces the idea of Supportive price behavior around this line validates its role.
🔍 This post is for educational discussion only. No recommendation or forecast is implied. Please conduct your own due diligence.

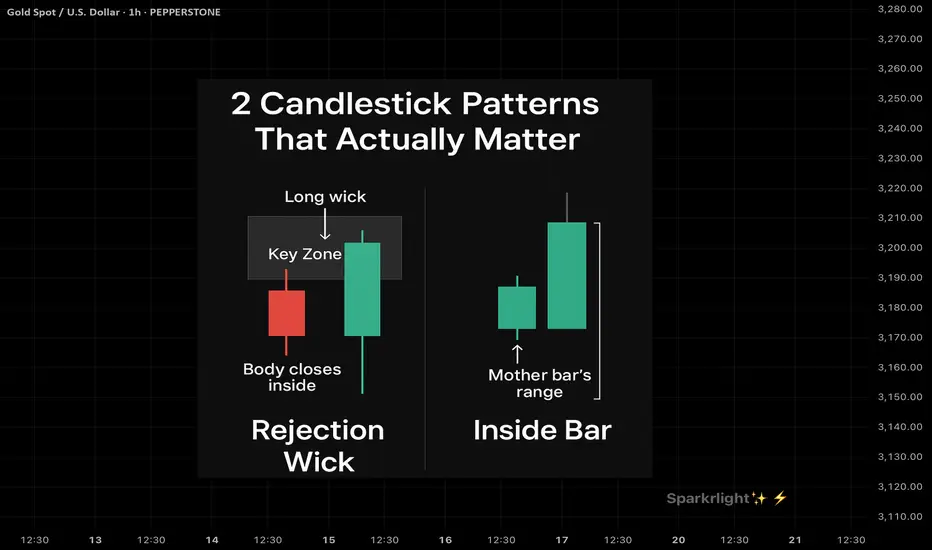
2 Candlestick Patterns That Actually Work — when used right !Intro:
Most traders learn candlestick patterns from cheat sheets —
Engulfing, doji, hammer, shooting star…
But not all patterns are created equal.
The key isn’t memorizing names — it’s understanding which ones hold real weight when used with structure.
Here are 2 powerful candlestick patterns that can shift the game — if you know when to trust them.
⸻
1. The Rejection Wick with Body Close Inside Structure (a.k.a. Rejection Candle)
What It Looks Like:
• A long wick that pierces above/below a key zone
• Candle body closes back inside the range
• Usually forms at OB, FVG, or liquidity sweep zones
Why It Works:
• It shows trapped traders and smart money rejection
• Confirms a false breakout and reclaim of intent
• Often leads to strong reversals or clean follow-throughs
When To Use It:
• After liquidity sweep
• Near HTF zone (OB / supply-demand)
• When followed by structure shift or BOS
Pro Tip: Combine with session awareness (NY / London open) for killer confluence.
⸻
2. The Inside Bar (Breakout Continuation Bar)
What It Looks Like:
• A small candle completely inside the range of the previous candle
• Price consolidates within one bar’s high-low range
• Often signals coiled pressure
Why It Works:
• It shows price resting before continuation
• When it forms near structure (OB or demand), the breakout that follows is often explosive
• Stop-loss is easy to place (above/below the mother bar)
When To Use It:
• After a BOS or clean impulse
• As a continuation signal on HTF
• Inside compression → expansion zones
Pro Tip: Trade the breakout of the inside bar with bias confirmation — not in both directions.
⸻
Final Word:
Candlestick patterns don’t work on their own.
They work when:
• Context is clear
• Liquidity has been handled
• Market structure aligns
If you trade candles without logic, you’re reacting to emotion.
But when you pair them with narrative and zones?
They become weapons.
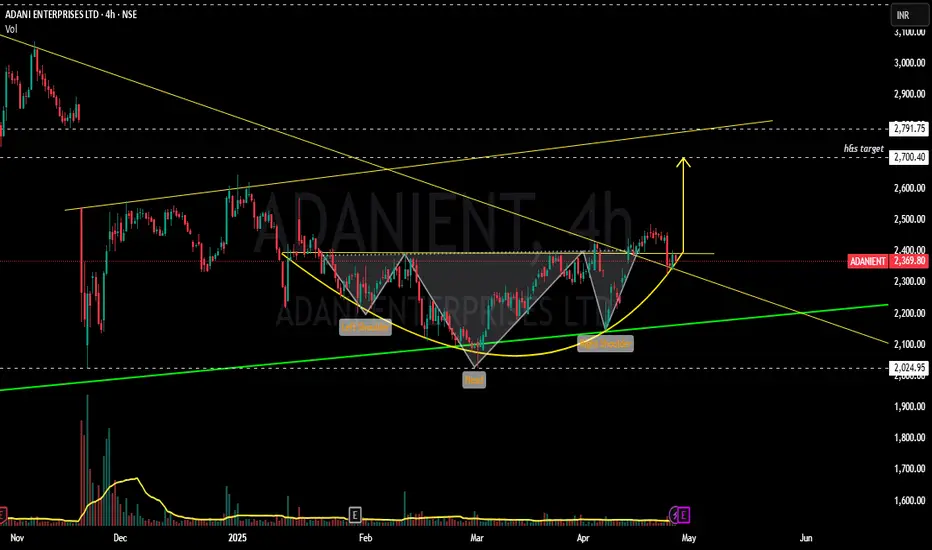
ADANIENT - Bulls getting ready to bump up ?????!!!Y essss!!! !
Chart patterns inculcating me the above titled opinion.
1. Monthly timeframe shows the symmetrical triangle pattern from 2020 till now, now the stock at support line(chart image shown below)
2. Weekly time frame shows us the INSIDE BAR candlestick pattern(mother baby pattern) with good volumes....with the low umtested till now.(made the low of 2025 on 22 nov 2024)
3. Daily time frame shows the Breakout attempt out of the 11 month old trendline.
4. Now, with the results on may 1, we can expect a volatile move.... .with the inverted h&s pattern around the corner.
Voluminous Entry can be made after the BREAKOUT WITH GOOD VOLUMES...
will update once the breakout happens.
Just add it to your watchlist and keep an eye on it.
THIS IS JUST MY OPINION..NOT A TIP NOR ADVICE.
Thank you .
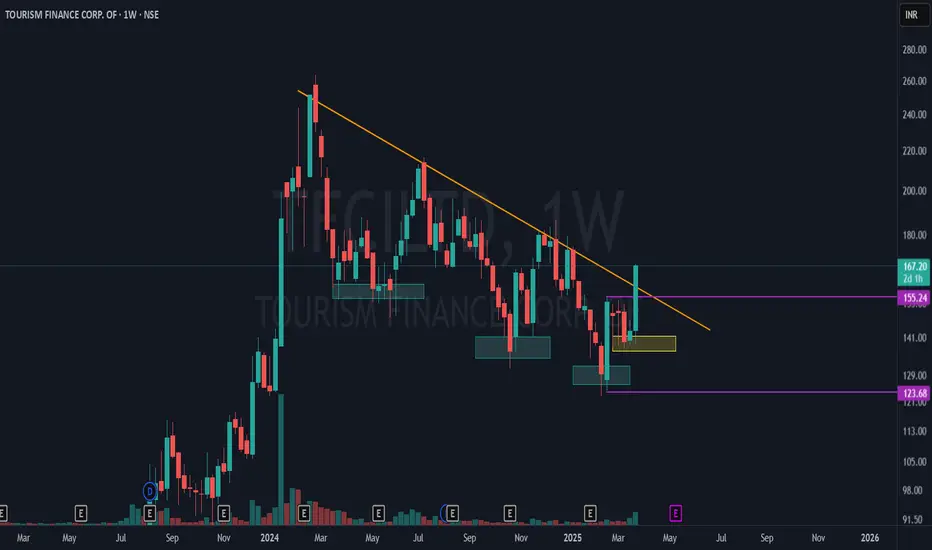
Tourism Finance Corp - Major Breakout in Progress!TFCI is showing a significant market structure shift on the weekly time frame (WTF) with strong confluence of technical signals! 📊
🔹 Lower Lows to Higher Low Transition:
Blue boxes indicate a series of lower lows, reflecting a prior downtrend.
The yellow box highlights a higher low, signaling a potential trend reversal!
🔹 Mother Candle Breakout:
The purple lines mark the high and low of the mother bar (key range).
Price is now breaking out from the upper side of the mother candle, confirming bullish momentum.
🔹 Counter Trendline (CTL) Breakout:
The orange line represents the main CTL on the weekly timeframe.
Price is successfully breaking out, indicating a potential trend shift to bullish!
Comment below your thoughts
#SRF - Potential STAGE 1 Break Out (Multi Year Consolidation)📊 Script: SRF
Key highlights: 💡⚡
📈 STAGE 1 - Accumulation formation in Weekly chart.
📈 Price gave a good up move, then went Side Ways
📈 Multi year Price consolidation
📈 Multiple Inside Bars formed in Daily chart
📈 Enter on BO when spike in Volume is seen
📈 MACD Cross Over
📈 One can go for Swing Trade.
BUY ONLY ABOVE 2700 DCB
⏱️ C.M.P 📑💰- 2583
🟢 Target 🎯🏆 – NA%
⚠️ Stoploss ☠️🚫 – NA%
⚠️ Important: Always Exit the trade before any Event.
⚠️ Important: Always maintain your Risk & Reward Ratio.
✅Boost, Like and follow to never miss a new idea! ✅
Disclaimer: I am not SEBI Registered Advisor. My posts are purely for training and educational purposes.
Eat🍜 Sleep😴 TradingView📈 Repeat 🔁
Happy learning with MMT. Cheers!🥂

2 Breakout trades for 25 Nov Markets I make educational content videos for swing / positional trading

3 Amazing swing trading ideas for 21 Nov Markets I make educational content videos for swing / positional trading

2 Amazing swing trading ideas for 17 October Markets I daily make educational content videos for swing / positional trading


Inside bar rises the bar Can go long above the high of the candle
safe traders can exit at the mentioned target
Stoploss can be little down at the previous swing low but its for high capital traders

bullish candle at the major supportGo long to capture some upward movement as inside candle appeared at
support line

2 Amazing swing trading ideas for 20 June marketsI daily make educational content videos for swing / positional trading

2 Amazing Swing trading ideas for 11 June I daily make educational content videos for swing / positional trading

TexRail, Strong stock from strong sector-Posted Good results, EPS YoY 132% n 43% QoQ growth (thats type of growth in earnings you want to see in stocks you want trade)
TA:
- Mother Candle: 4 days Insidebar Candle
-Green Vol > Red Vol
-Consolidating near previous high BO level = constructive sign
-Good flushing of sellers
-Good Shakeouts, when price go below major ema, here both 21/50 emas, n rally back upside.
-Making HLs
Overall high priority stock for trade, buying above 202
Note: No buy/sell recommendation
