2 Candlestick Patterns That Actually Work — when used right !Intro:
Most traders learn candlestick patterns from cheat sheets —
Engulfing, doji, hammer, shooting star…
But not all patterns are created equal.
The key isn’t memorizing names — it’s understanding which ones hold real weight when used with structure.
Here are 2 powerful candlestick patterns that can shift the game — if you know when to trust them.
⸻
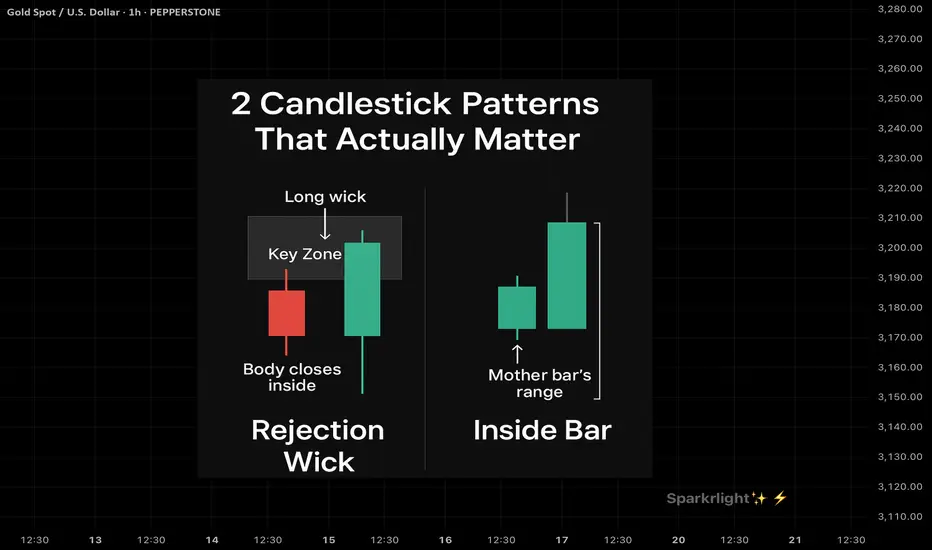
1. The Rejection Wick with Body Close Inside Structure (a.k.a. Rejection Candle)
What It Looks Like:
• A long wick that pierces above/below a key zone
• Candle body closes back inside the range
• Usually forms at OB, FVG, or liquidity sweep zones
Why It Works:
• It shows trapped traders and smart money rejection
• Confirms a false breakout and reclaim of intent
• Often leads to strong reversals or clean follow-throughs
When To Use It:
• After liquidity sweep
• Near HTF zone (OB / supply-demand)
• When followed by structure shift or BOS
Pro Tip: Combine with session awareness (NY / London open) for killer confluence.
⸻
2. The Inside Bar (Breakout Continuation Bar)
What It Looks Like:
• A small candle completely inside the range of the previous candle
• Price consolidates within one bar’s high-low range
• Often signals coiled pressure
Why It Works:
• It shows price resting before continuation
• When it forms near structure (OB or demand), the breakout that follows is often explosive
• Stop-loss is easy to place (above/below the mother bar)
When To Use It:
• After a BOS or clean impulse
• As a continuation signal on HTF
• Inside compression → expansion zones
Pro Tip: Trade the breakout of the inside bar with bias confirmation — not in both directions.
⸻
Final Word:
Candlestick patterns don’t work on their own.
They work when:
• Context is clear
• Liquidity has been handled
• Market structure aligns
If you trade candles without logic, you’re reacting to emotion.
But when you pair them with narrative and zones?
They become weapons.
Inside Bar
'Inside' Story of 'Inside' Candle !!!! -> Definition of Inside Candle
As the name suggests, an inside bar chart pattern engulfs the inside of a large candle, some call it a mother bar. It’s a pattern that forms after a large move in the market and represents a period of consolidation.
The inside bar pattern can be a very powerful price action signal if you understand how to trade it properly. Matching lows and highs are acceptable, however, the inside bar’s range must not be outside of the mother candle by even 1 point.
-> Facts about Inside Candle
Inside bar pattern within the trading range (or shadow) of the preceding bar.
It is at least a two candlestick formation.
Mother candlestick can be either bullish(green) or bearish(red).
The inside bar chart pattern can be bullish or bearish.
Inside bar setup.
-> Procedure to trade Inside Candle
Entering: – When the price action completes an inside candlestick chart pattern, you should mark the low and high of the Inside Bar consolidation range. These two levels are used to trigger a potential trade.
Remember, the inside candle clues us into the eventual breakout and likelihood of a continuation outside the range in the direction of the break, however, it doesn’t give us information about the direction of the breakout through the range, prior to the actual move.
In simple terms, if the price action interrupts the range upwards, then you should go long. If the price action breaks the range downwards, then you should trade the short side.
Exiting: – Projecting the potential move with Inside Bar Breakouts can be challenging. Often inside bar trades can lead to a prolonged impulse move after the breakout, so employing a trailing stop loss after the price has moved in your favor is a smart trade management strategy.
Stop Loss: – In either case (If you are Long or short), your stop should be located below the bottom of the range, as stated in the picture below. There can be a buffer of 1% below the range.
-> Inside Candle helps to identify change in trend
The inside bar candlestick pattern is such a valuable tool because it tells us that the market is not as bullish or bearish as it was in the preceding period.
Being able to identify periods of market expansion and contraction will help any trader improve their odds of finding a winning trade because we know from history that expansion and contraction can only last so long.
When either of those market phases ends, the resulting moves can be explosive!
My OBSERVATION -> It is more effective if used with RSI i.e. when RSI is greater then 70 and inside candle is formed , that spot is best for shorting,
and if RSI is less then 30 and inside candle is formed , that spot is best to go long.

How to trade like a PRO on the basis of Technical Analysis. In this analysis we'll look how the Professional Trader explore the chart before executing their Trade.
Demand Zone -
Fib Retracement -
Candlesticks -
Divergence - Divergence warns that the current trend is getting weakening and it might possible that the trend get changed in up coming session.
Volume Profile - POC - Point Of Control
It's the Big guys who moves and manipulate the market, The Retail Traders can't.
This is Not investment advice. It's just for learning purpose. Invest your capital at your own risk.
Please like, share & follow.

Bata Candlestick Interpretation Candlestick Interpretation
After a downtrend ; Bullish Hammer , Bullish Engulfing , Inside bar , accumulation zone are formed as a act of Fibonacci retracement in Daily chart.
Which gave a nice 11.8% profit with 3% stoploss.

INSIDE BAR STRATEGY I've never been a fan of fancy indicators because price action is best leading indicator out there.
This is one of the most popular and effective strategies for short term.
I prefer the 3 candle compression because it works for me more often.
One can experiment as per their liking with just 2 candles or more than 3 candles.
Strategy is once the first 2 candles are formed, the Inside Bar Strategy is activated. All you need to do then is to place a Buy Trigger above the High of the Mother Candle.
Not all inside bar candles work all the time and quickly. Sometimes it can test your patience. The position where it has occurred, the trend of the stock, sector, market also have to be considered.
The innumerous requests asking for ready made screeners can implement this and create a screener for yourself but when and how to effectively use it will only come with experience when you put in the hard hours understanding price action.
Good Luck !


Inside Mother candle rangeNIIT TECH trading in a range from past 6-7 days.....A close above or below the range needs to be looked into. RANGE 1131 -1061
NEducation

Nifty Inside Bar and Divergence ComboWe can clearly see the price struggling to breakout of the Weekly Levels. In the Daily, we can see a Negative Divergence with RSI (orange line) followed by Double Red Inside Bar. If today, the price breaks below the yesterday's range, we can expect quick down move.


KAJARIACER Looks Good For Swing TradingKAJARIACER: Daily Chart
Price took support on Weekly support.
Price broke through trendline and also 50 EMA.
Currently, Price is in pullback mode and formed Inside Bar.
There is divergence in RSI and Price Action, Price making lower low and RSI making higher.
It can move upside if successfully breaks out of Inside Bar.
Education purpose only.
