Part 1 Institutional vs. Technical What Is an Option?
An option is a contract that gives you the right, but not the obligation, to buy or sell an underlying asset at a specific price before a specific time.
There are two types:
• Call Options
A call gives you the right to buy the asset at a predetermined price.
You buy calls when you expect the market to go up.
• Put Options
A put gives you the right to sell the asset at a predetermined price.
You buy puts when you expect the market to go down.
The price at which the transaction occurs is called the strike price, and the last date the option is valid is the expiry.
Institutional_trading

Part 3 Learn Institutional Trading Call Options (CE)
A Call Option Buyer expects the market to go up.
A Call Option Seller expects the market to stay below the strike or fall.
1. CE Buyer Example
Nifty = 22,000
You buy 22,100 CE at ₹50 premium.
If Nifty closes at 22,300 on expiry:
Intrinsic value = 22,300 - 22,100 = 200
Profit = (Intrinsic - Premium) = 200 - 50 = 150
Your profit is ₹150 × lot size.
If Nifty stays below 22,100:
Your loss = premium = ₹50
2. CE Seller Example
You sell 22,100 CE at ₹50
If Nifty stays below 22,100 → Full premium is your profit.
If Nifty goes above 22,100 → You lose point by point.
Seller risk = unlimited.

Part 3 Learn Institutional Trading Risks in Option Trading
1. Time Decay
Every day the option loses some value.
2. Volatility Crush
After major events (e.g., RBI policy, Budget), IV drops, reducing premium.
3. Wrong Direction
Small directional mistakes = big losses for buyers.
4. Unlimited Loss for Sellers
If market moves violently, sellers may face huge losses.
That’s why sellers usually hedge their positions.

Part 6 Learn Institutional Trading Key Terminology in Option Trading
Before diving deeper, let’s understand some crucial terms used in options:
Underlying Asset: The financial instrument (like a stock, index, or commodity) on which the option is based.
Strike Price (Exercise Price): The price at which the underlying asset can be bought (for a call) or sold (for a put).
Expiration Date: The date when the option contract ends. After this date, the option becomes worthless if not exercised.
Option Premium: The price paid by the buyer to the seller for acquiring the option.
Intrinsic Value: The amount by which an option is in profit if exercised immediately.
Time Value: The extra value in the option premium due to time left before expiration.
In-the-Money (ITM): When the option already has intrinsic value (profitable if exercised now).
Out-of-the-Money (OTM): When the option has no intrinsic value.
At-the-Money (ATM): When the strike price equals the current market price of the underlying.
Example:
If a stock is trading at ₹1000 and you buy a call option with a strike price of ₹950, your option is in the money.
If you buy a call with a strike price of ₹1050, it’s out of the money.

Part 3 Learn Institutional Trading Introduction to Option Trading
Option trading is one of the most powerful tools in the financial markets. It allows traders and investors to speculate on price movements, hedge risks, and generate income in various market conditions. Unlike traditional stock trading—where you buy or sell shares directly—option trading gives you the right but not the obligation to buy or sell an asset at a predetermined price within a specified period.
In simple words, options give you flexibility. You can profit whether the market goes up, down, or stays flat—if you know how to use them properly. However, this flexibility also brings complexity. To understand option trading deeply, one needs to grasp how options work, the factors affecting their price, and the strategies traders use to make consistent returns.

TVSMOTOR 1D Time frame🔢 Current Level
Trading around ₹3,525 – ₹3,530
🔑 Key Resistance & Support Levels
Resistance Zones:
₹3,550 – ₹3,560: Near-term resistance; breakout above this may lead to further upside.
₹3,600: Stronger resistance above.
Support Zones:
₹3,500 – ₹3,510: Immediate support; failure to hold above this may lead to a decline.
₹3,450: Short-term support; a break below this could indicate weakness.
₹3,400: Deeper support zone if price dips further.
📉 Outlook
Bullish Scenario: If TVS Motor holds above ₹3,510, upward momentum may continue. Break above ₹3,560 can open the way toward ₹3,600+.
Bearish Scenario: A drop below ₹3,450 may signal further downside potential.
Neutral Zone: Between ₹3,510 and ₹3,560, TVS Motor may consolidate before a directional move.

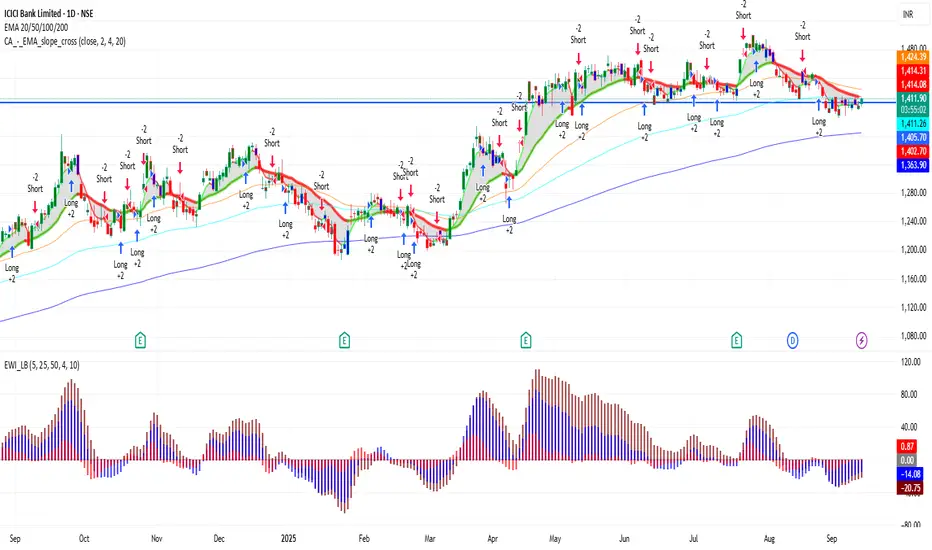
ICICIBANK 1D Time frame🔢 Current Level
ICICIBANK is trading around ₹1,401 – ₹1,412
🔑 Key Resistance & Support Levels
Resistance Zones:
₹1,407 – ₹1,415 (near-term resistance)
₹1,416 (next resistance level)
Support Zones:
₹1,390 – ₹1,392 (immediate support)
₹1,360 – ₹1,365 (stronger support if price dips further)
📉 Outlook
Bullish Scenario: If ICICIBANK holds above ₹1,392, upward momentum may continue. Break above ₹1,410 – ₹1,414 can open the way toward higher levels.
Bearish Scenario: If it falls below ₹1,360, risk increases toward ₹1,340 – ₹1,345.
Neutral / Range: Between ₹1,392 – ₹1,410, ICICIBANK may consolidate before a directional move.
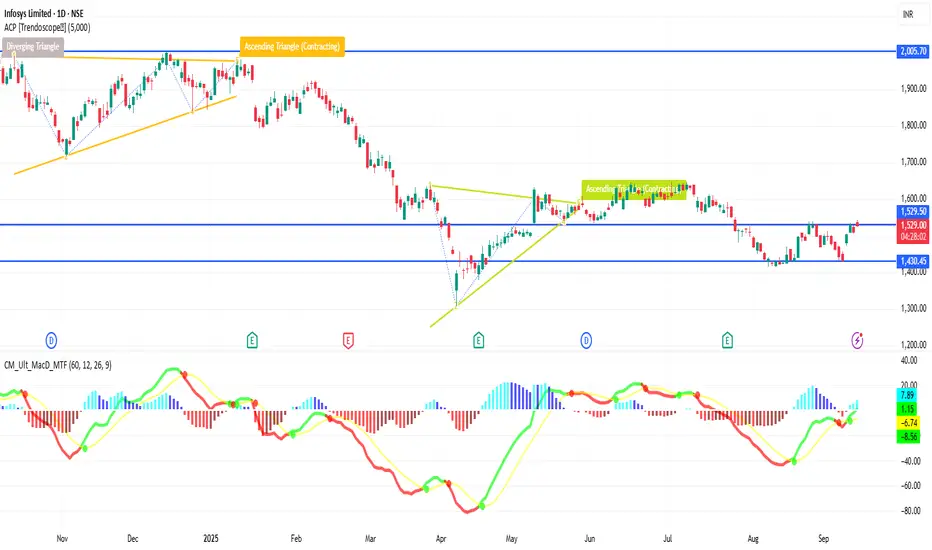
INFY 1D Time frame🔢 Current Level
INFY is trading around ₹1,510 – ₹1,529
🔑 Key Resistance & Support Levels
Resistance Zones:
₹1,518 – ₹1,520 (near-term resistance; breakout above this may lead to further upside)
₹1,530 (stronger resistance above)
Support Zones:
₹1,484 – ₹1,485 (immediate support)
₹1,481 (stronger support if price dips further)
₹1,470 – ₹1,472 (deeper support zone)
📉 Outlook
Bullish Scenario: If INFY holds above ₹1,485, upward momentum may continue.
Breakout Scenario: A move above ₹1,520 can open the way toward ₹1,530+.
Bearish Scenario: If it falls below ₹1,481, risk increases toward ₹1,470 – ₹1,472.
BANKNIFTY 1D Time frame📍 Current Price Action
Level: ~54,670
Day’s Range: 54,402 – 54,757
52-Week Range: 47,703 – 57,628
⚙ Technical Indicators
RSI (14): ~60 → bullish momentum, not overbought yet
MACD: Positive → supports uptrend
Moving Averages:
Short-term (5, 10, 20-day): Bullish signals
Medium-term (50, 100-day): Supportive of trend
Long-term (200-day): Slight resistance near current level
Stochastic Oscillator: In overbought zone → strong momentum but risk of pullback
📊 Support & Resistance
Immediate Support: ~54,400
Immediate Resistance: ~54,750 – 55,000
Pivot Point: ~54,550
🧠 Summary
Bank Nifty is in a bullish short-term trend. Holding above 54,400 keeps momentum positive, while a breakout above 55,000 could open room for more upside. If resistance holds, the index may consolidate or retest lower supports.

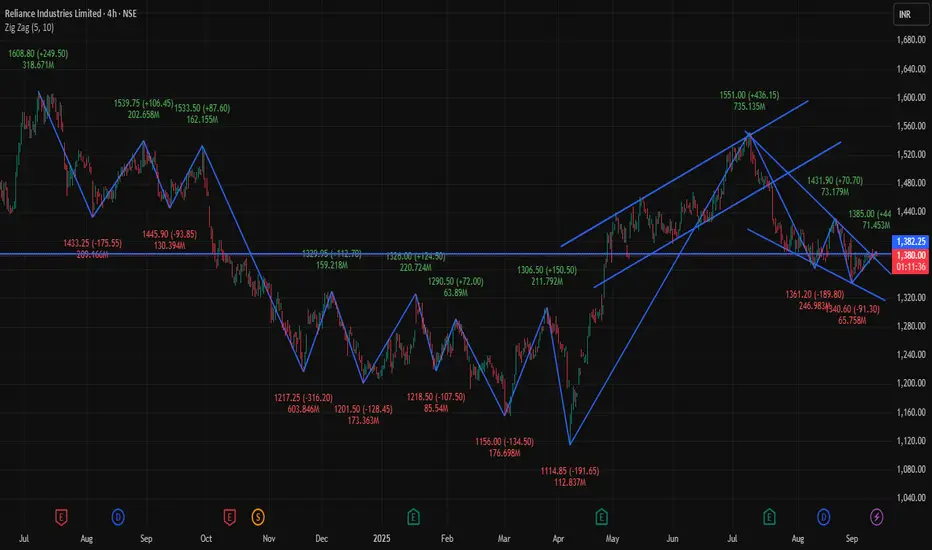
RELIANCE 4Hour 📊 Current Snapshot
Current Price: ₹1,380📈 Trend & Indicators
Trend: Neutral to mildly bullish; trading near short-term resistance.
RSI (14): Neutral zone.
MACD: Positive → indicating mild bullish momentum.
Moving Averages: Short-term averages indicate neutral to slightly bullish outlook.
🔮 Outlook
Bullish Scenario: Break above ₹1,385.50 with strong volume could target ₹1,390.00.
Bearish Scenario: Drop below ₹1,375.00 may lead to further decline toward ₹1,370.00.
Neutral Scenario: Consolidation between ₹1,375.00 – ₹1,385.50; breakout needed for directional move.
📌 Key Factors to Watch
Economic Indicators: Interest rates, inflation, and RBI policy updates.
Sector Performance: Trends in the energy and petrochemical sectors.
Global Cues: Global market trends, US indices, crude oil, and currency movements..90
Day’s Range: ₹1,375.00 – ₹1,385.50
Previous Close: ₹1,377.00
Opening Price (4H): ₹1,376.00
Volume: Approximately 371,445 shares traded
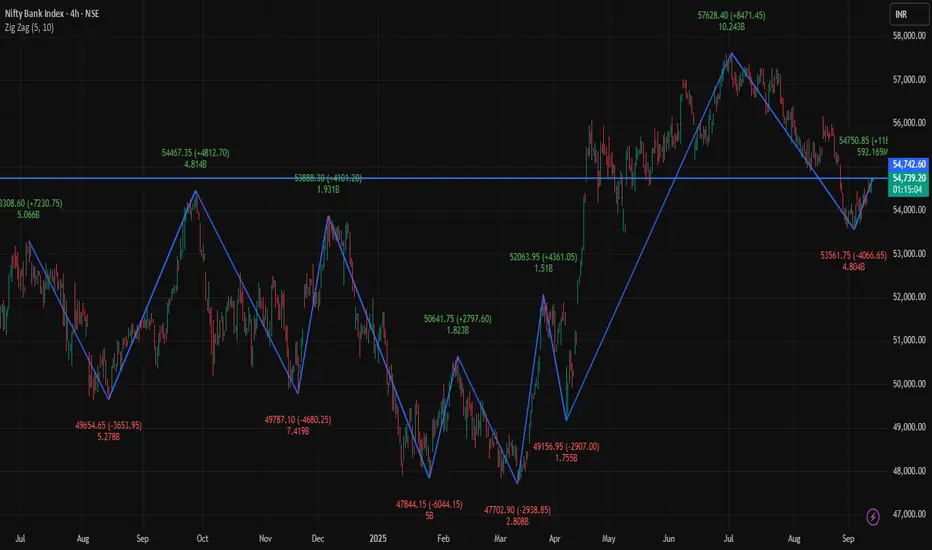
BANKNIFTY 4Hour Time frame📊 Current Snapshot
Current Price: ₹54,731
Day’s Range (4H): ₹54,600 – ₹54,800
Previous Close: ₹54,228
Opening Price (4H): ₹54,350
Volume: Moderate
🔑 Key Support & Resistance Levels
Immediate Support: ₹54,650
Next Support: ₹54,600
Immediate Resistance: ₹54,800
Next Resistance: ₹54,900
📈 Trend & Indicators
Trend: Mildly bullish; trading near short-term resistance.
RSI (14): ~64 – Neutral to slightly bullish.
MACD: Positive → indicates bullish momentum.
Moving Averages: Short-term averages indicate bullish bias.
🔮 Outlook
Bullish Scenario: Sustained move above ₹54,800 may push toward ₹54,900–₹55,000.
Bearish Scenario: Drop below ₹54,650 could lead to retracement toward ₹54,600.
Neutral Scenario: Consolidation between ₹54,650 – ₹54,800; breakout needed for directional move.
SENSEX 4Hour📊 Current Snapshot
Current Price: ₹81,561.00
Day’s Range: ₹81,235.42 – ₹81,643.88
Previous Close: ₹81,101.32
Opening Price (4H): ₹81,504.36
Volume: Approximately 6.16 million shares
📈 Trend & Indicators
Trend: Neutral to mildly bullish; trading near 50-hour and 200-hour moving averages.
RSI (14): Neutral zone.
MACD: Positive → indicating mild bullish momentum.
Moving Averages: Short-term averages indicate neutral to slightly bullish outlook.
🔮 Outlook
Bullish Scenario: Break above ₹81,643.88 with strong volume could target ₹81,917.15.
Bearish Scenario: Drop below ₹81,235.42 may lead to further decline toward ₹81,101.32.
Neutral Scenario: Consolidation between ₹81,235.42 – ₹81,643.88; breakout needed for directional move.
📌 Key Factors to Watch
Economic Indicators: Interest rates, inflation, and RBI policy updates.
Sector Performance: Trends in the IT and financial sectors.
Global Cues: Global market trends, US indices, crude oil, and currency movements.

NIFTY 4H Time frame📊 Current Snapshot
Current Price: ₹24,976 - ₹25,006
Day’s Range (4H): ₹24,945 – ₹25,008
Previous Close: ₹24,973
Opening Price (4H): ₹24,991
Volume: Moderate
🔑 Key Support & Resistance Levels
Immediate Support: ₹24,945
Next Support: ₹24,900
Immediate Resistance: ₹25,008
Next Resistance: ₹25,050
📈 Trend & Indicators
Trend: Neutral to mildly bullish; trading near 50-hour and 200-hour moving averages.
RSI (14): 61 – Neutral zone.
MACD: Positive → indicating mild bullish momentum.
Moving Averages: Short-term averages suggest neutral to slightly bullish outlook.
🔮 Outlook
Bullish Scenario: Break above ₹25,008 with strong volume could target ₹25,050.
Bearish Scenario: Drop below ₹24,945 may lead to further decline toward ₹24,900.
Neutral Scenario: Consolidation between ₹24,945 – ₹25,008; breakout needed for directional move.
📌 Key Factors to Watch
Overall market sentiment.
Economic indicators: interest rates, inflation, RBI updates.
Global cues: US indices, crude oil, and currency movements.
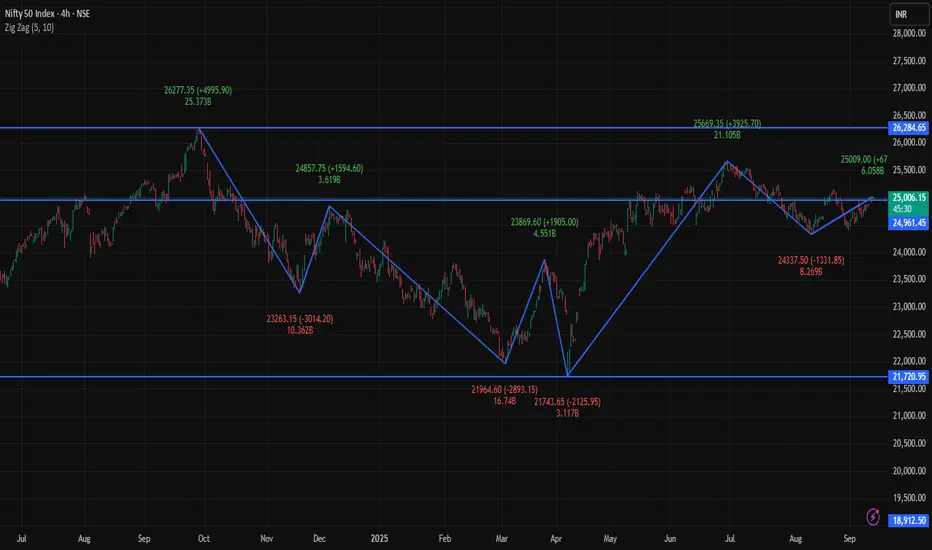
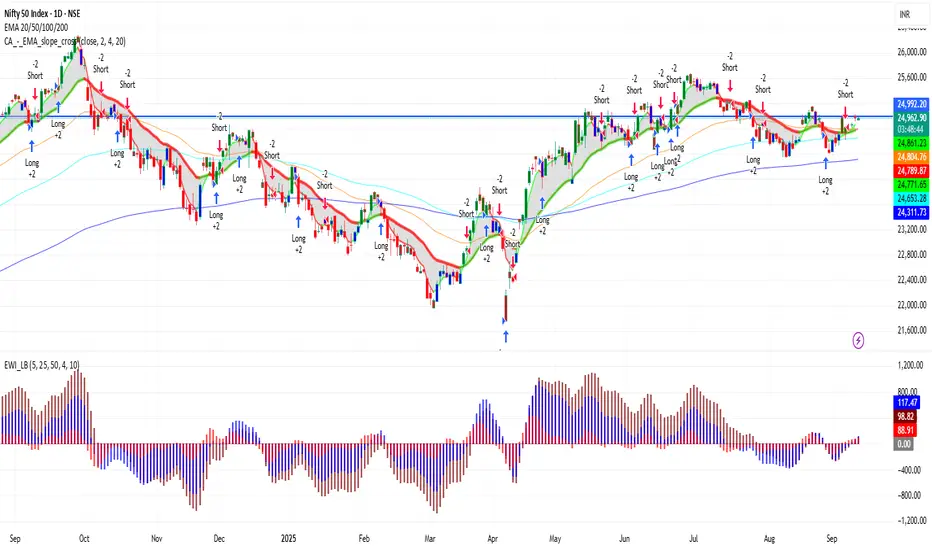
NIFTY 1D Time frame📊 Current Snapshot
Current Price: ₹24,981
Previous Close: ₹24,960.15
Day’s Range: ₹24,915 – ₹25,035
52-Week Range: ₹21,743 – ₹26,277
Market Cap: Approx. ₹21.5 lakh crore
Volume: ~1.8 crore shares
🔑 Key Support & Resistance Levels
Immediate Support: ₹24,900
Next Support: ₹24,500
Immediate Resistance: ₹25,050
Next Resistance: ₹25,200
📈 Trend & Indicators
Trend: Neutral to mildly bullish; trading near 50-day and 200-day moving averages.
RSI (14): 65 – approaching overbought zone.
MACD: Positive, indicating bullish momentum.
Moving Averages: Short-term moving averages suggest neutral to slightly bullish outlook.
🔮 Outlook
Bullish Scenario: Break above ₹25,050 with strong volume could push Nifty toward ₹25,200.
Bearish Scenario: Drop below ₹24,900 may lead to further decline toward ₹24,500.
Neutral Scenario: Consolidation between ₹24,900 – ₹25,050; breakout needed for directional move.
📌 Key Factors to Watch
Broader market sentiment.
Economic indicators such as interest rates and inflation.
Global cues affecting investor confidence.
TVSMOTOR 1D Time frameCurrent Snapshot
Last Traded Price: ₹3,495.30
Day’s Range: ₹3,455.50 – ₹3,502.40
52-Week Range: ₹2,171.40 – ₹3,602.70
Market Cap: ₹1.64 lakh crore
Volume: 159,624 shares
VWAP: ₹3,474.60
📈 Trend & Indicators
Trend: Neutral to mildly bullish; trading above 20-day and 50-day EMAs.
RSI (14): Around 68 – approaching overbought territory.
MACD: Positive → indicates bullish momentum.
Moving Averages: Short-term MAs suggest neutral to slightly bullish outlook.
🔮 Outlook
Bullish Scenario: Break above ₹3,502 with strong volume could target ₹3,550.
Bearish Scenario: Drop below ₹3,455 may lead to further decline toward ₹3,400.
Neutral Scenario: Consolidation between ₹3,455 – ₹3,502; breakout needed for directional move.
📌 Key Factors to Watch
Market Sentiment: Broader market moves can impact TVS Motor.
Economic Indicators: Interest rates, fuel prices, and inflation affect automotive stocks.
Company News: Any financial results or strategic announcements can influence price.

SENSEX 1H Time frameCurrent Snapshot
Sensex Last Price: around 81,425
Intraday High (1H): near 81,580
Intraday Low (1H): around
📈 Trend View (1H)
Above 81,580 → 82,000 = bullish momentum likely.
Below 81,225 → 81,000 = bearish sentiment can increase.
Staying between these = sideways consolidation.
📊 Trend & Bias
Above 81,600–82,000 → bullish breakout, upside momentum likely.
Below 81,000 → bearish pressure, possible drift toward 80,500.
As long as price holds higher lows on 1H candles, trend stays mildly positive.
⚠️ Risk Factors
Sudden global news or domestic policy updates may cause sharp reversals.
If volume is weak during up-moves, breakouts may fail.
Overbought conditions on momentum indicators (RSI/MACD) could slow the rally.

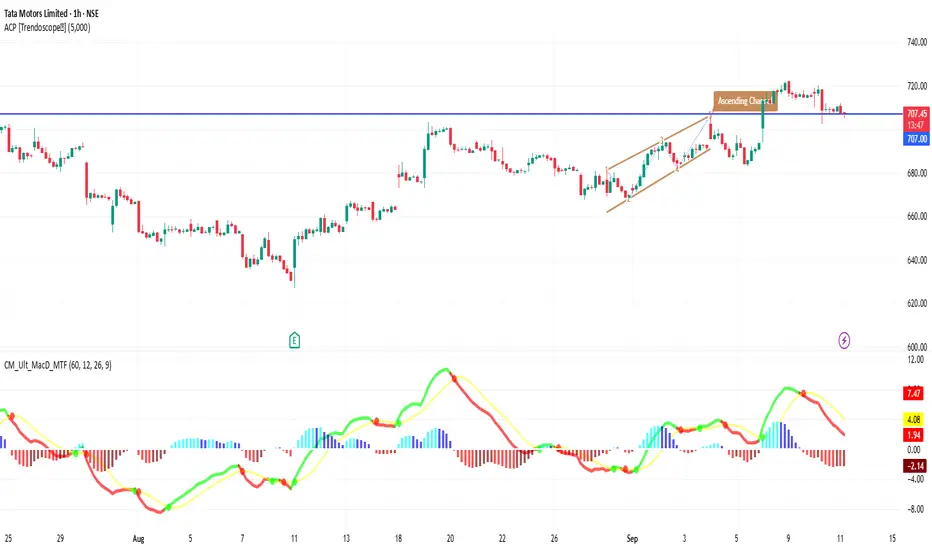
TATAMOTORS 1H Time frameMarket Snapshot
Current Price: ~₹708
Intraday Range: ~₹706 – ₹712
Bias: Sideways to mildly bullish
📈 Moving Averages (1H)
20-hour MA: ~₹707 → acting as short-term support
50-hour MA: ~₹704 → supportive level below
200-hour MA: ~₹699 → strong base, long-term intraday support
All moving averages are aligned above each other → bias is bullish.
🔎 Indicators
RSI (14, hourly): ~59 → Momentum positive, not overbought
MACD (1H): Bullish crossover, showing upward momentum
ADX: ~20 → Trend strength is still weak to moderate
Stochastic: Near overbought → caution for minor pullback
🔧 Key Levels
Support: ₹705 → first support, then ₹700 as stronger base
Resistance: ₹712 → immediate resistance, next at ₹715
🧭 Short-Term Outlook
Bullish Case: Break above ₹712–715 zone could push price toward ₹720+.
Bearish Case: Failure at resistance + RSI overbought may drag it back to ₹705 or even ₹700.
Overall Bias: Slightly bullish, but resistance is close and strong.
Master Institutional Trading🎯 Master Institutional Trading
Master Institutional Trading means learning to trade like the top financial institutions – with precision, strategy, and data-driven decisions. It’s the highest level of trading where you think and act like banks 🏦, hedge funds 📊, and investment firms 💼.
This mastery involves:
🔍 Understanding how smart money moves
📈 Analyzing volume, liquidity zones, and order flow
💹 Executing large trades without impacting the market
🛡️ Applying risk-controlled option & futures strategies
🧠 Using advanced tools, indicators, and market depth
🔄 Adapting to news, events, and institutional triggers
To master this skill, traders must develop:
📊 Strong technical + fundamental analysis
🧘 Discipline and emotion control
🧾 A solid, backtested trading system
💬 Knowledge of macroeconomic impacts
🧮 Command over greeks, derivatives, and hedging
📌 In simple words:
Mastering Institutional Trading means stepping into the shoes of the pros – learning how the big money operates, and trading with structure, edge, and confidence.

Institution Option Trading📈 Institutional Option Trading – Complete Detailed Guide
Institutional Option Trading refers to how big financial institutions, such as banks, hedge funds, and proprietary trading firms, use options strategically in the market to manage risk, maximize profits, and control large positions with precision. This approach is highly systematic, data-driven, and based on volume, volatility, and liquidity analysis — very different from how retail traders trade options.
💡 What is Institutional Option Trading?
Institutions don’t gamble with options — they use options for:
✅ Hedging — Protecting big portfolios from market drops.
✅ Income Generation — Earning regular profits through premium selling.
✅ Directional Bets — Placing large directional trades with minimal risk.
✅ Volatility Trading — Making profits from changes in volatility without caring about market direction.
📚 Key Features of Institutional Option Trading
1. Focus on Liquidity
Institutions trade highly liquid options, usually:
Index Options (NIFTY, BANKNIFTY, SPX)
Blue-Chip Stocks (Apple, Reliance, TCS, Infosys)
Commodity Options (Gold, Crude Oil)
They avoid low-volume contracts and always trade in markets where they can enter and exit positions without slippage.
2. Use of Option Greeks
Institutions are masters of Option Greeks:
Delta for direction,
Theta for time decay profits,
Vega for volatility play,
Gamma for adjusting positions dynamically.
They don’t trade blindly but monitor how their positions react to price, time, and volatility changes.
3. Premium Selling Bias
Most institutional setups involve selling options (not just buying).
✅ Credit Spreads, Iron Condors, and Covered Calls are preferred.
Why? Because time decay works in their favor, giving consistent income.
4. Hedging Big Positions
Institutions always hedge their trades.
✅ Example: They may hold large stock positions and sell Covered Calls or buy Protective Puts to reduce risk.
✅ This creates balanced portfolios, minimizing market shocks.
✅ Institutional Trading Tools
Open Interest Analysis
Option Chain Data
IV (Implied Volatility) charts
Volume Profile & Market Profile
Real-time Greeks exposure tools
Delta-neutral hedging platforms
📝 Example of Institutional Option Trade
Scenario: NIFTY at 22,000, sideways expectation for next week.
✅ Strategy: Sell 22,500 Call, Sell 21,500 Put (Iron Condor).
✅ Buy hedges: 23,000 Call, 21,000 Put.
✅ Profit Range: If NIFTY stays between 21,500-22,500 → Max Profit.
✅ Risk Managed: Losses capped, steady time decay profit.
🚀 Benefits of Learning Institutional Option Trading
✅ Consistent income instead of gambling
✅ Risk protection using proper hedging
✅ Trade size management for scalability
✅ Ability to handle big accounts with steady growth
✅ Professional market understanding

Learn Institutional Trading Part-3🔍 What You'll Learn:
✅ Market Structure Mastery
Understand how price moves through different phases — accumulation, manipulation, expansion, and distribution — and how institutions position themselves at each level.
✅ Order Flow & Liquidity Concepts
Institutions focus on liquidity. Learn how they seek out stop-losses and resting orders to fill large positions without moving the market too much.
✅ Smart Money Concepts
Identify where "smart money" (institutional money) is entering and exiting the market using tools like:
Fair Value Gaps (FVG)
Order Blocks
Breaker Blocks
Liquidity Pools
Inducement and Mitigation zones
✅ Volume & Open Interest Analysis
Discover how volume analysis and options open interest reveal institutional footprints in futures and options markets.
✅ Institutional Risk Management
Learn how institutions manage massive portfolios with strict risk control, position sizing, and hedging techniques.
✅ High Probability Trade Setups
Master trade setups based on institutional logic — including trap setups, liquidity grabs, and imbalance trades — with better reward-to-risk ratios.
🧠 Why Learn Institutional Trading?
Retail traders often fall prey to emotional trading and market manipulation. Institutional traders, however, rely on logic, data, and strategy. By learning institutional trading:
You'll stop chasing price and start anticipating moves.
You'll learn to trade with the big players, not against them.
You'll gain confidence by using smart money principles instead of random indicators.
🚀 Who Should Learn This?
Day traders looking to level up
Swing traders aiming for high precision
Option traders focusing on large-scale setups
Anyone who wants to understand how real money moves the market
📈 Ready to Ride the Big Moves?
“Learn Institutional Trading” is your pathway to mastering the strategies that drive the global markets. Say goodbye to confusion and emotional trades — and start thinking like a professional.

Trade Like Istitution Why Learn to Trade Like Institution?
Financial markets are not random. They are highly manipulated and structured systems, controlled by major financial entities. When you trade like institution, you stop guessing and start understanding:
Where the big players place their orders.
How liquidity zones work.
Why certain price levels are targeted before major moves.
How you can identify smart money footprints and follow the dominant trend.
This approach teaches you to trade strategically, patiently, and professionally — eliminating the emotional rollercoaster most traders experience.
What You Will Learn in “Trade Like Institution”
✅ Smart Money Trading Concepts
Understand how institutions manipulate markets, create liquidity, and trap retail traders. Learn the basics of accumulation, manipulation, and distribution phases.
✅ Market Structure and Order Flow
Read the market from an institutional perspective using pure price action and market structure analysis. Identify break of structure (BOS) and change of character (CHoCH) signals that reveal when the market is about to move.
✅ Order Block Identification
Learn to locate order blocks, where institutions place their large orders. These zones are often the key areas where price reverses or explodes in a specific direction.
✅ Liquidity Zones and Stop-Loss Hunting
Discover how to identify liquidity pools, understand stop-loss hunting techniques, and position yourself for trades after liquidity grabs.
✅ Risk Management Like Institutions
Master the art of risk management, learning how big players manage risk efficiently to stay profitable long-term, even after losses.
✅ High-Probability Trade Setups
Get access to reliable entry techniques with precise stop-loss placement and optimal reward-to-risk setups that minimize risk and maximize returns.
✅ Live Market Application
Learn through real-world market examples, live sessions, and chart analysis to see how institutional concepts apply in active markets like forex, stocks, indices, and crypto.
Who Should Learn to Trade Like Institution?
This course is designed for:
📊 New traders who want to start the right way without falling into retail traps.
💡 Intermediate traders who have experience but struggle with consistency.
💼 Full-time or part-time traders who wish to level up their skills.
📈 Investors who want to actively manage and grow their wealth.
🎯 Ambitious traders who want to make trading a serious and professional income source.
Benefits of Trading Like Institution
✅ Stop being a victim of market manipulation and start trading with the market movers.
✅ Eliminate confusion, follow clean price action, and trade with confidence.
✅ Avoid low-probability trades by understanding where the real market action happens.
✅ Build strong discipline and follow a professional trading process.
✅ Achieve long-term profitability by managing risk like professionals.
✅ Become a confident, independent trader capable of thriving in any market condition.
Trading success comes from learning the truth behind market movements and following the professional path. This course will completely transform your approach to the markets. With Trade Like Institution, you’ll stop guessing, start predicting, and trade with an edge just like the top institutional traders do every single day

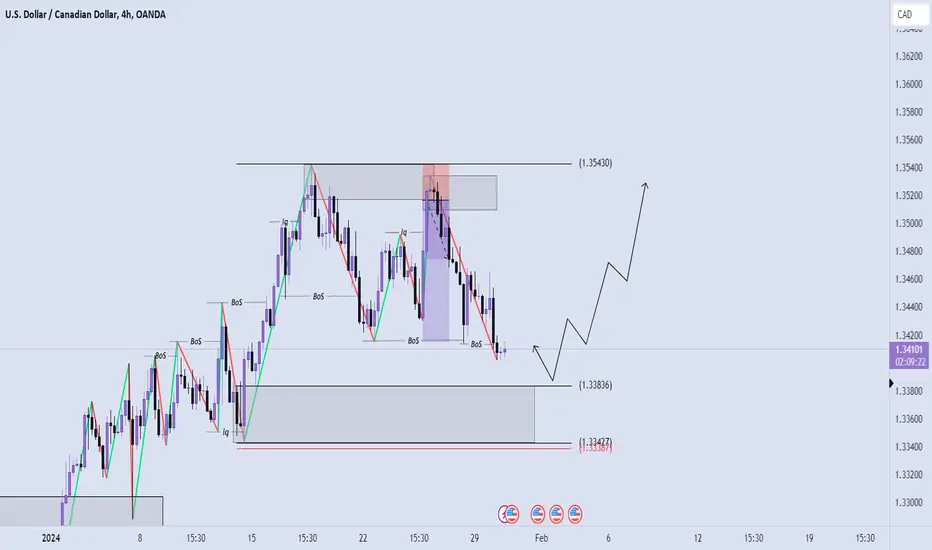
USDCAD TRADE IDEApossible USDCAD trade scenario enter with ltf confirmation if taken direct entry manage your risk properly 1:2-3 RR as this week is full of HIGH IMPACT NEWS enter at your own risk
indicator based SMC approach. follow and like for more such setups
NZDCHF TRADE IDEApossible NZDCHF trade scenario will look for entry from above zone
enter with ltf confirmation if taken direct entry manage your risk properly 1:2-3 RR
Indicator based SMC approach. follow and like more such smc setups
