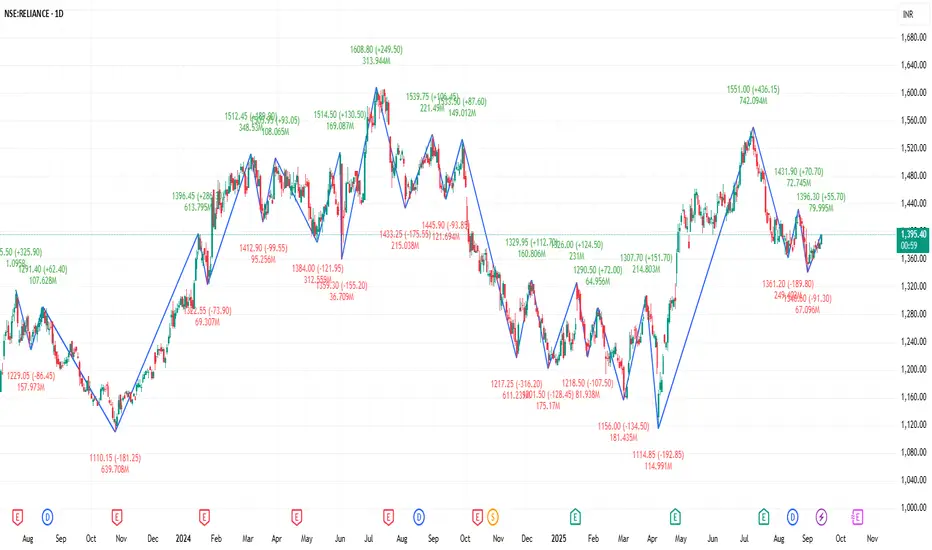
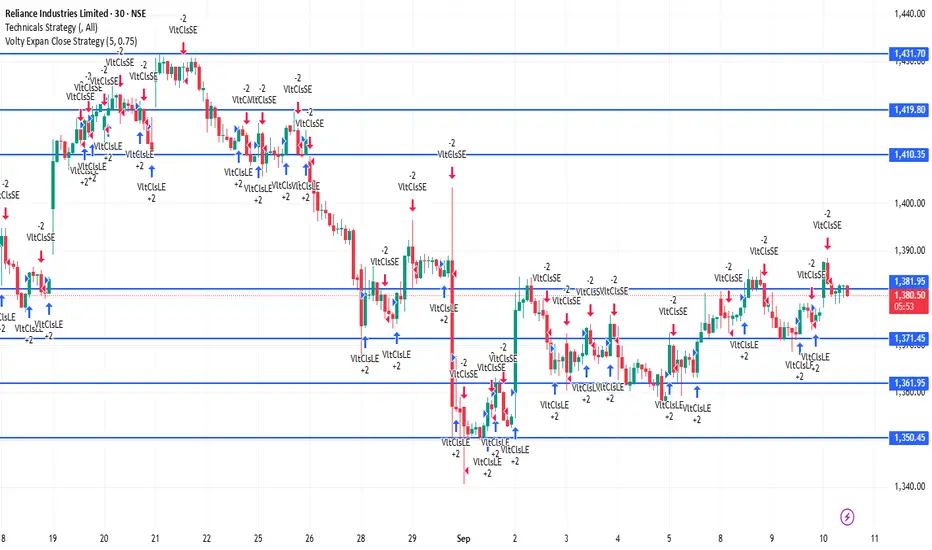
RELIANCE 1D Time frame🔢 Current Level
Trading around ₹1,393 - ₹1,395
🔑 Key Resistance & Support Levels
Resistance Zones:
~ ₹1,400 – ₹1,431 (immediate resistance band)
~ ₹1,440 – ₹1,460 (higher resistance if momentum continues)
Support Zones:
~ ₹1,380 – ₹1,370 (short-term support)
~ ₹1,360 (important support below)
📉 Outlook
Bullish Scenario: Holding above ₹1,400 and breaking past ₹1,431 can open the path toward ₹1,440–₹1,460.
Bearish Scenario: A fall below ₹1,370–₹1,360 increases risk of deeper decline.
Neutral / Range: Between ₹1,360–₹1,431, Reliance may move sideways until a clear breakout happens.
Intraday
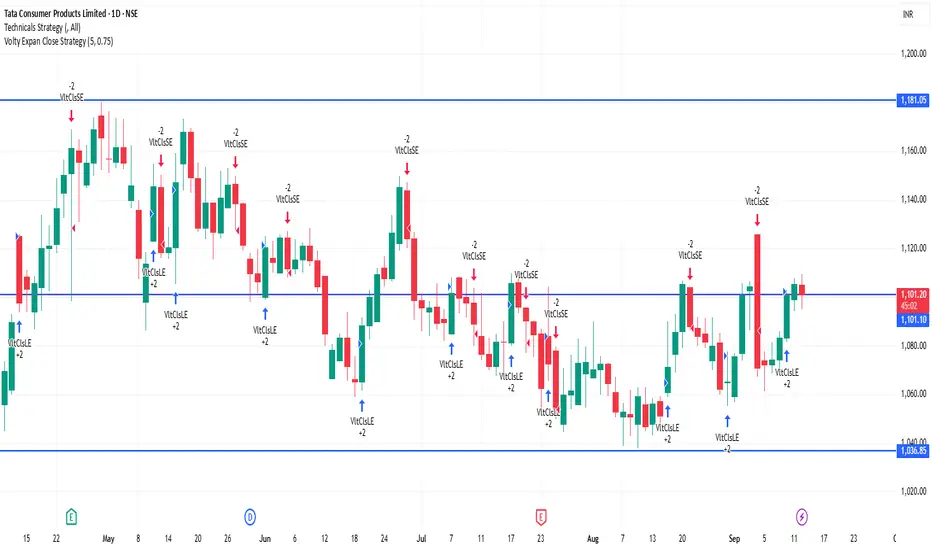
TATACONSUM 1D Time frame🔢 Current Level
Trading around ₹1,101.30
🔑 Key Resistance & Support Levels
Resistance Zones:
₹1,110 – ₹1,115 (recent highs; breakout above this may lead to further upside)
₹1,120 (psychological resistance)
₹1,130 – ₹1,140 (stronger resistance above)
Support Zones:
₹1,095 – ₹1,100 (immediate support; failure to hold above this may lead to a decline)
₹1,085 – ₹1,090 (short-term support; a break below this could indicate weakness)
₹1,070 – ₹1,080 (deeper support zone if price dips further)
📉 Outlook
Bullish Scenario: If Tata Consumer holds above ₹1,100, upward momentum may continue. Break above ₹1,115 can open the way toward ₹1,120+.
Bearish Scenario: If it falls below ₹1,085, risk increases toward ₹1,070 – ₹1,080.
Neutral / Range: Between ₹1,100 – ₹1,115, Tata Consumer may consolidate before a directional move.
TVSMOTOR 1D Time frame🔢 Current Level
Trading around ₹3,525 – ₹3,530
🔑 Key Resistance & Support Levels
Resistance Zones:
₹3,550 – ₹3,560: Near-term resistance; breakout above this may lead to further upside.
₹3,600: Stronger resistance above.
Support Zones:
₹3,500 – ₹3,510: Immediate support; failure to hold above this may lead to a decline.
₹3,450: Short-term support; a break below this could indicate weakness.
₹3,400: Deeper support zone if price dips further.
📉 Outlook
Bullish Scenario: If TVS Motor holds above ₹3,510, upward momentum may continue. Break above ₹3,560 can open the way toward ₹3,600+.
Bearish Scenario: A drop below ₹3,450 may signal further downside potential.
Neutral Zone: Between ₹3,510 and ₹3,560, TVS Motor may consolidate before a directional move.

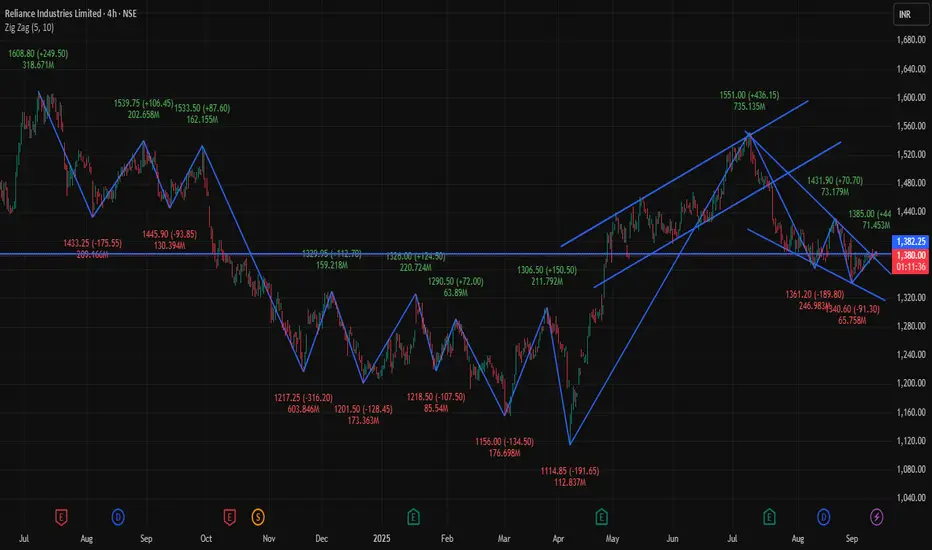
RELIANCE 4Hour 📊 Current Snapshot
Current Price: ₹1,380📈 Trend & Indicators
Trend: Neutral to mildly bullish; trading near short-term resistance.
RSI (14): Neutral zone.
MACD: Positive → indicating mild bullish momentum.
Moving Averages: Short-term averages indicate neutral to slightly bullish outlook.
🔮 Outlook
Bullish Scenario: Break above ₹1,385.50 with strong volume could target ₹1,390.00.
Bearish Scenario: Drop below ₹1,375.00 may lead to further decline toward ₹1,370.00.
Neutral Scenario: Consolidation between ₹1,375.00 – ₹1,385.50; breakout needed for directional move.
📌 Key Factors to Watch
Economic Indicators: Interest rates, inflation, and RBI policy updates.
Sector Performance: Trends in the energy and petrochemical sectors.
Global Cues: Global market trends, US indices, crude oil, and currency movements..90
Day’s Range: ₹1,375.00 – ₹1,385.50
Previous Close: ₹1,377.00
Opening Price (4H): ₹1,376.00
Volume: Approximately 371,445 shares traded
SENSEX 4Hour📊 Current Snapshot
Current Price: ₹81,561.00
Day’s Range: ₹81,235.42 – ₹81,643.88
Previous Close: ₹81,101.32
Opening Price (4H): ₹81,504.36
Volume: Approximately 6.16 million shares
📈 Trend & Indicators
Trend: Neutral to mildly bullish; trading near 50-hour and 200-hour moving averages.
RSI (14): Neutral zone.
MACD: Positive → indicating mild bullish momentum.
Moving Averages: Short-term averages indicate neutral to slightly bullish outlook.
🔮 Outlook
Bullish Scenario: Break above ₹81,643.88 with strong volume could target ₹81,917.15.
Bearish Scenario: Drop below ₹81,235.42 may lead to further decline toward ₹81,101.32.
Neutral Scenario: Consolidation between ₹81,235.42 – ₹81,643.88; breakout needed for directional move.
📌 Key Factors to Watch
Economic Indicators: Interest rates, inflation, and RBI policy updates.
Sector Performance: Trends in the IT and financial sectors.
Global Cues: Global market trends, US indices, crude oil, and currency movements.

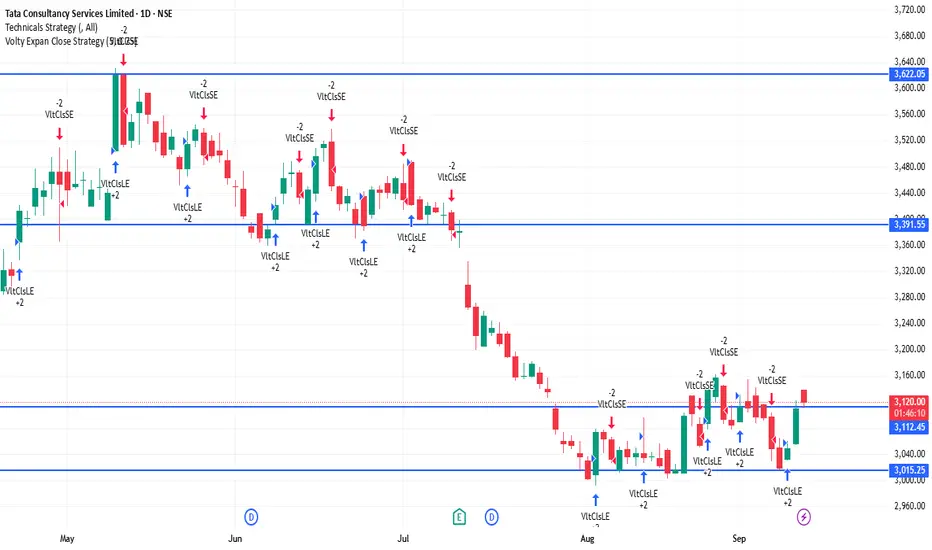
TCS 1D Time framePrice Action (Daily Chart)
Current price is around ₹3,117 - ₹3,120
Price is consolidating near support zones after a recent upward move.
Candle structure shows buying interest at lower levels, but resistance is capping the upside.
📊 Indicators
Moving Averages (MA):
Short-term MAs (5-day, 10-day) are slightly mixed.
Medium to long MAs (20, 50, 100, 200-day) are in buy zone, showing broader uptrend strength.
RSI (14-day): ~62-65 → indicates mild bullish momentum, not yet in overbought zone.
MACD: Shows positive crossover, momentum favors bulls but losing some strength.
⚖️ Key Levels
Immediate Resistance: ₹3,135 – ₹3,140
Next Resistance: ₹3,170 – ₹3,200
Immediate Support: ₹3,100 – ₹3,110
Strong Support: ₹3,050 – ₹3,000
📈 Outlook
Short-term sentiment: Neutral to slightly bullish as long as price holds above ₹3,100.
A breakout above ₹3,140 may open room toward ₹3,170–₹3,200.
A breakdown below ₹3,100 may drag price to ₹3,050–₹3,000.
Overall trend on daily timeframe is still uptrend, but near resistance, so caution is needed.
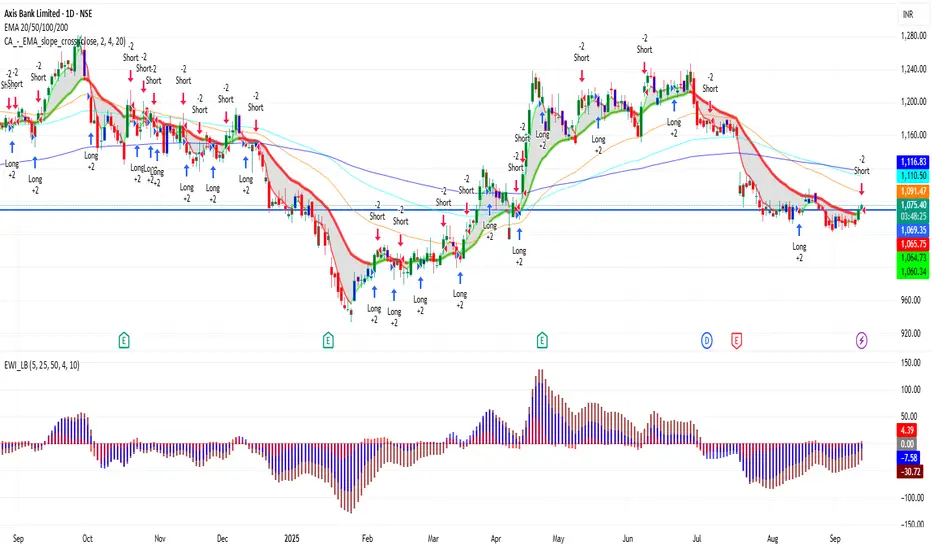
AXISBANK 1D Time frame📊 Current Snapshot
Current Price: ₹1,073.50
Day’s Range: ₹1,069.00 – ₹1,073.20
52-Week Range: ₹934.00 – ₹1,281.75
Previous Close: ₹1,070.10
Opening Price: ₹1,069.00
Market Cap: Approx. ₹3.32 lakh crore
Volume: ~1.65 lakh shares
📈 Trend & Indicators
Trend: Neutral to mildly bullish; trading near 50-day and 200-day moving averages.
RSI (14): 60 – Neutral; no immediate overbought or oversold conditions.
MACD: Positive → indicates bullish momentum.
Moving Averages: Short-term moving averages suggest neutral to slightly bullish outlook.
🔮 Outlook
Bullish Scenario: Break above ₹1,075 with strong volume could target ₹1,090.
Bearish Scenario: Drop below ₹1,065 may lead to further decline toward ₹1,050.
Neutral Scenario: Consolidation between ₹1,065 – ₹1,075; breakout needed for directional move.
📌 Key Factors to Watch
Market Sentiment: Overall market trend and investor behavior.
Economic Indicators: Interest rates, inflation, and RBI policy updates.
Global Cues: Global market trends, US indices, crude oil, and currency movements.
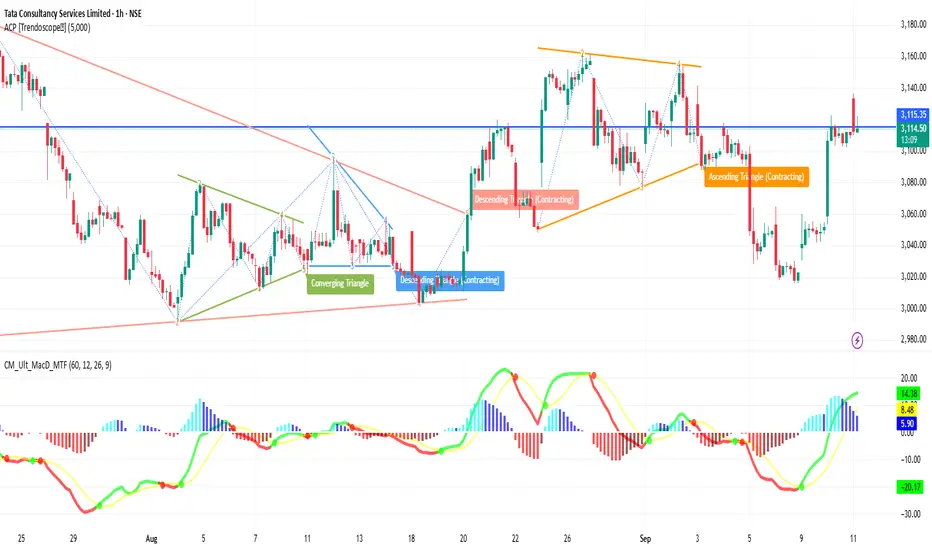
TCS 1H Time frameTCS 1-Hour Snapshot
Price is around ₹3,110
Showing small gains in recent sessions
Has been under pressure from broader IT sector weakness, but holding above some short-term support
🔎 Technical Indicators & Trend
Moving Averages (short-term hourly) are slightly below current price → providing support
Medium-term MAs (50-hour etc.) are above → resistance overhead
RSI (hourly) is moderately neutral—neither strongly overbought nor oversold
Trend strength appears modest; no sharp momentum bars or volume spikes indicating breakout
🔧 Support & Resistance Levels (1H)
Support: ~₹3,080–₹3,090 first support zone
Resistance: ~₹3,130–₹3,140 nearby resistance
🧭 Short-Term Outlook
Bullish Case: A break above ~₹3,130-3,140 with volume could push toward ~₹3,160
Bearish Case: If it fails to break resistance and drops below ~₹3,090, possible move toward ~₹3,060
Overall Bias: Slightly bullish to neutral; waiting for confirmation from resistance breakout
SENSEX 1H Time frameCurrent Snapshot
Sensex Last Price: around 81,425
Intraday High (1H): near 81,580
Intraday Low (1H): around
📈 Trend View (1H)
Above 81,580 → 82,000 = bullish momentum likely.
Below 81,225 → 81,000 = bearish sentiment can increase.
Staying between these = sideways consolidation.
📊 Trend & Bias
Above 81,600–82,000 → bullish breakout, upside momentum likely.
Below 81,000 → bearish pressure, possible drift toward 80,500.
As long as price holds higher lows on 1H candles, trend stays mildly positive.
⚠️ Risk Factors
Sudden global news or domestic policy updates may cause sharp reversals.
If volume is weak during up-moves, breakouts may fail.
Overbought conditions on momentum indicators (RSI/MACD) could slow the rally.

GMDC Breakout GMDC BREAKOUT on 45 min and 1 hrs. Gmdc is in good Momentum. It's can give another 4 -5% movement easily. It can be achieve 580 tgt easily. It's already moved good.
Now keep trial SL and Enjoy Journey.
Buy was given near 426.
Tgt 580 - 600
Consult your financial advisor before making any position in stock market. My all views are for educational purposes only.
Visit my profile for more information

SBIN 30Minutes Time frame📍 SBIN – 30M Important Levels (Current)
🔹 Support Zones
820 – 825 → Immediate intraday support
805 – 810 → Strong support zone; buyers likely to defend
790 – 795 → Major support; breakdown here may trigger deeper downside
🔹 Resistance Zones
840 – 845 → Immediate intraday resistance
855 – 860 → Strong resistance; breakout may extend upside momentum
875 – 880 → Major resistance; if crossed, can fuel a bigger rally
⚖️ 30M Trend Outlook
SBIN is currently in a range-bound to bullish phase on the 30M chart.
Holding above 825 keeps the short-term bias positive.
Breakout above 845 may target 860 – 880.
Breakdown below 825 may pull it back toward 810 – 795.

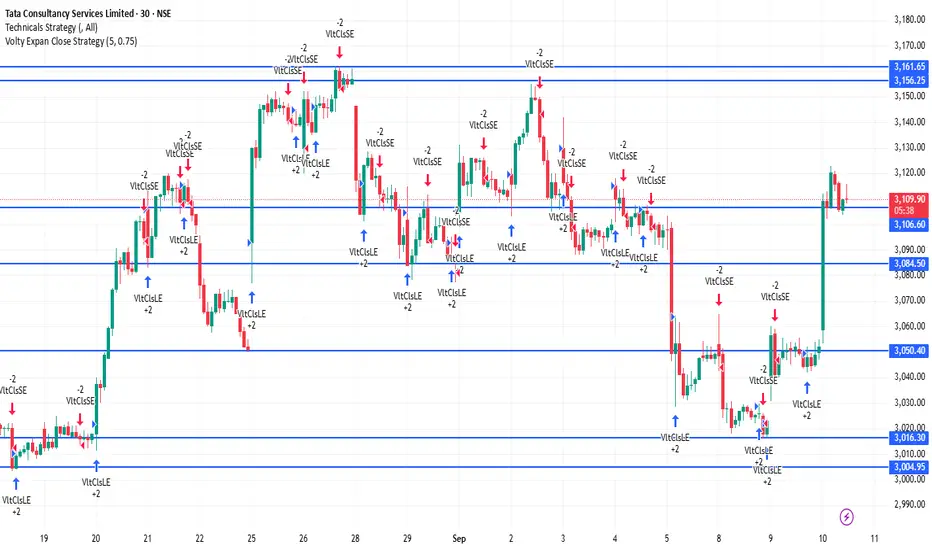
TCS 30Minutes Time frameTCS – 30-Minute Time Frame Important Levels (Current Estimate)
Support Zones
₹3,080 – ₹3,090 → Immediate intraday support
₹3,050 – ₹3,060 → Stronger support level where dip-buying may emerge
₹3,020 – ₹3,030 → Major support; a breakdown here may indicate intraday weakness
Resistance Zones
₹3,130 – ₹3,140 → Immediate intraday resistance
₹3,160 – ₹3,170 → Strong resistance zone; a breakout may extend upward momentum
₹3,200 – ₹3,210 → Major resistance; surpassing this can fuel a more sustained rally
Intraday Trend Outlook (30M Chart)
The trend appears mildly bullish as long as TCS holds above ₹3,080.
A clear move above ₹3,140 can open the path toward ₹3,160–₹3,200.
If it falls below ₹3,050, price may pull back toward ₹3,020, and a break under that could signal further downside.
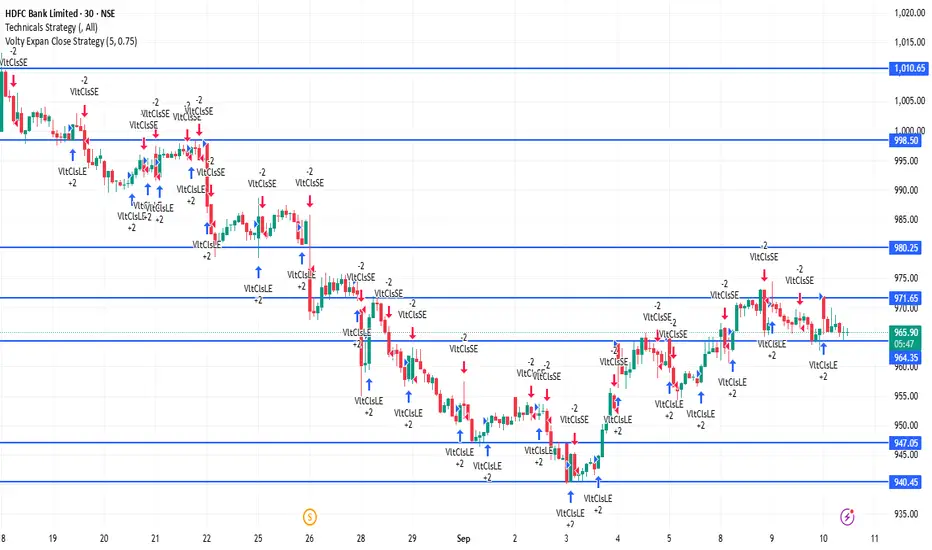
HDFCBANK 30Minutes Time frameHDFC Bank – 30M Important Levels (Current)
These levels are calculated using today’s intraday pivot data and provide reliable reference points for short-term trading.
Pivot Point (Mid-Level): ~₹967
First Resistance (R1): ~₹972
Second Resistance (R2): ~₹979
First Support (S1): ~₹960
Second Support (S2): ~₹955
These intraday pivots help highlight key zones where intra-day price action often stalls, reverses, or accelerates.
Intraday Trend Outlook (30M Chart)
Above ₹972: Bullish momentum may continue, with potential upside toward ~₹979.
Between ₹960 – ₹972: Neutral-to-bullish range; watch for sustain or reversal.
Below ₹960: Bearish pressure may build, potentially testing down to ~₹955.
RELIANCE 30Mitunes Time frame📊 Reliance Industries (30M Chart)
Current Zone: Trading around ₹1,380–₹1,382.
🔻 Support Levels:
₹1,375 → Immediate intraday support
₹1,369–₹1,370 → Strong support zone
₹1,362–₹1,363 → Major support
🔺 Resistance Levels:
₹1,382–₹1,383 → Immediate hurdle
₹1,387–₹1,388 → Strong resistance zone
₹1,394–₹1,395 → Major resistance
📈 Trend Outlook (30M):
Above ₹1,383 → Momentum stays bullish, price may push toward ₹1,388–₹1,395.
Between ₹1,369–₹1,382 → Neutral to slightly bullish consolidation zone.
Below ₹1,369 → Weakness may drag price toward ₹1,363 or lower.
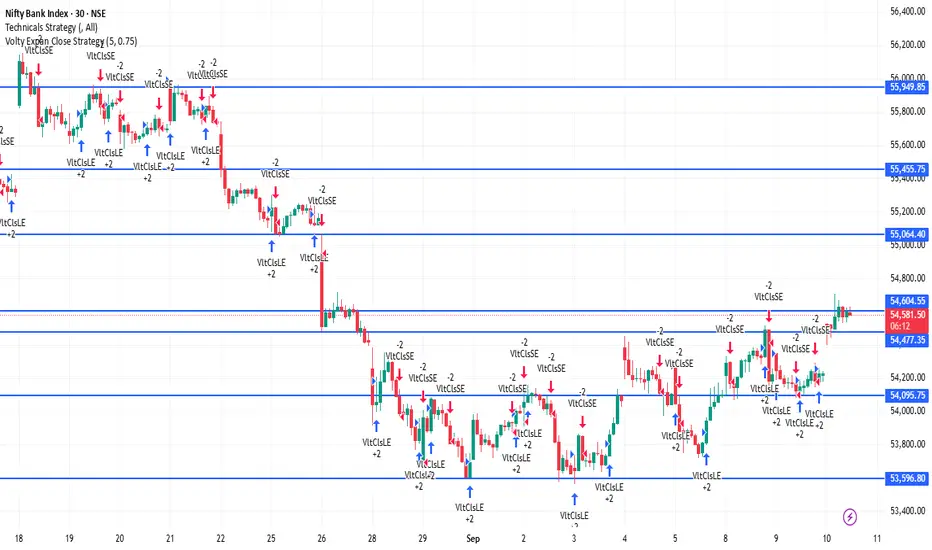
BANKNIFTY 30 Minutes Time frame Bank Nifty (30-Minute Timeframe Snapshot, 10 Sept 2025 ~12:30 PM IST)
Current Level: Around 54,615 – 54,620
Change: Up roughly +400 points (+0.7% approx.) compared to yesterday’s close
Key Pivot Levels (30-min basis)
Pivot: 54,215
Resistance Levels:
R1: 54,351
R2: 54,487
R3: 54,623
Support Levels:
S1: 54,080
S2: 53,944
S3: 53,809
✅ In short: Bank Nifty is trading strongly above its pivot (54,215) and is hovering close to R3 (54,623) on the 30-minute chart, showing bullish momentum.
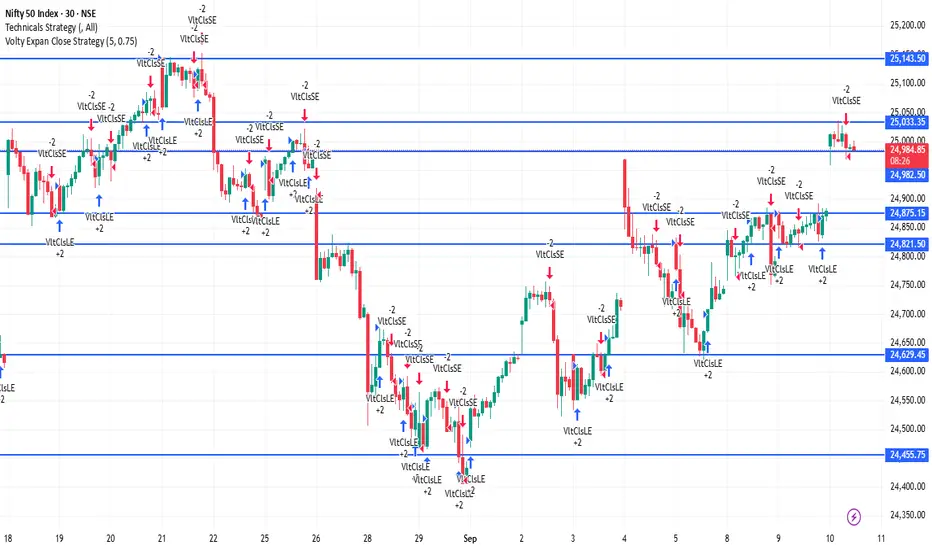
NIFTY 30Minutes Time frameNifty 50 Snapshot (10 Sept 2025 ~12:30 PM IST)
Current Level: Around 24,990 – 25,000
Change: Up about +125 points (~+0.5%) from the previous close
Pivot Levels (Daily Basis – works for 30-min chart too)
Pivot Point: 24,858
Resistance Levels:
R1: 24,902
R2: 24,936
R3: 24,980
Support Levels:
S1: 24,824
S2: 24,780
S3: 24,747
✅ Analysis (30-Minute View):
Nifty is trading around 25,000, which is above R3 (24,980). This shows strong bullish momentum intraday. If it sustains above R3, the market may extend gains further; otherwise, some profit-booking can pull it back toward R2 or R1 levels.
RELIANCE 1D Time frame📍 RELIANCE – 1D Important Levels (Current)
🔹 Support Zones
2,870 – 2,900 → Immediate daily support
2,820 – 2,840 → Strong support; buyers expected here
2,750 – 2,770 → Major support; breakdown may trigger deeper correction
🔹 Resistance Zones
2,950 – 2,970 → Immediate daily resistance
3,020 – 3,050 → Strong resistance zone; breakout may extend bullish momentum
3,120 – 3,150 → Major resistance; if crossed, Reliance may trend strongly higher
⚖️ Daily Trend Outlook
Reliance is in a sideways-to-bullish phase on the daily chart.
Price is consolidating between 2,870 support and 2,970 resistance.
A breakout above 2,970 – 3,020 can open upside towards 3,050 – 3,150.
A breakdown below 2,870 can drag it toward 2,820 – 2,770.
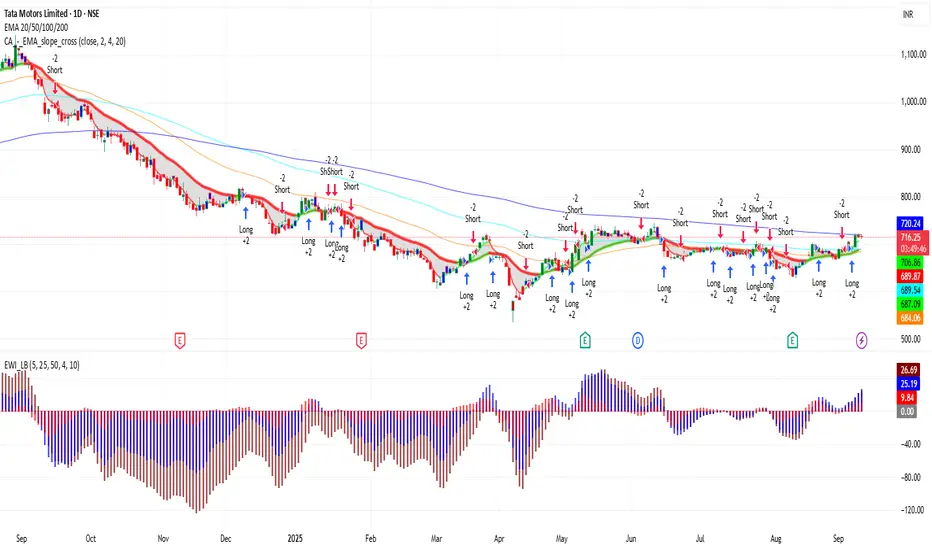
TATAMOTORS 1D Time frame📍 TATAMOTORS – 1D Important Levels (Current)
🔹 Support Zones
900 – 910 → Immediate daily support
870 – 880 → Strong support; buyers likely to defend here
835 – 850 → Major support; breakdown here may shift trend bearish
🔹 Resistance Zones
940 – 950 → Immediate daily resistance
970 – 980 → Strong resistance; breakout above this can fuel momentum
1,000 – 1,020 → Major psychological resistance; if crossed, bullish trend strengthens further
⚖️ Daily Trend Outlook
Tata Motors is in a bullish phase on the daily chart, making higher lows and sustaining above key supports.
As long as price holds above 900, the stock remains positive.
A breakout above 950 – 980 may open the path towards 1,000+.
A breakdown below 900 may lead to weakness toward 880 – 850.
TVSMOTOR 1D Time frame📍 TVSMOTOR – 1D Important Levels (Current)
🔹 Support Zones
2,050 – 2,070 → Immediate daily support
1,980 – 2,000 → Strong support zone; buyers expected here
1,900 – 1,920 → Major support; breakdown here may shift trend bearish
🔹 Resistance Zones
2,120 – 2,140 → Immediate daily resistance
2,180 – 2,200 → Strong resistance; breakout can extend momentum
2,250 – 2,280 → Major resistance; if crossed, bullish trend strengthens
⚖️ Daily Trend Outlook
TVSMOTOR is in a sideways-to-bullish structure on the daily chart.
As long as price holds above 2,050, momentum remains positive.
A breakout above 2,140 – 2,200 could push price towards 2,250 – 2,280.
A breakdown below 2,050 may drag it down to 2,000 – 1,920.

KOTAKBANK 1D Time frame📍 KOTAKBANK – 1D Important Levels (Current)
🔹 Support Zones
1,730 – 1,750 → Immediate daily support
1,680 – 1,700 → Strong support; buyers likely to defend here
1,620 – 1,640 → Major support; breakdown here may turn trend bearish
🔹 Resistance Zones
1,780 – 1,800 → Immediate daily resistance
1,830 – 1,850 → Strong resistance zone
1,900 – 1,920 → Major resistance; breakout above this can fuel strong upside momentum
⚖️ Daily Trend Outlook
Kotak Bank is currently in a sideways to mildly bullish phase on the daily chart.
Price is consolidating between 1,730 support and 1,800 resistance.
A breakout above 1,800 – 1,850 could trigger a rally towards 1,900+.
A breakdown below 1,730 may drag the stock toward 1,700 – 1,640.

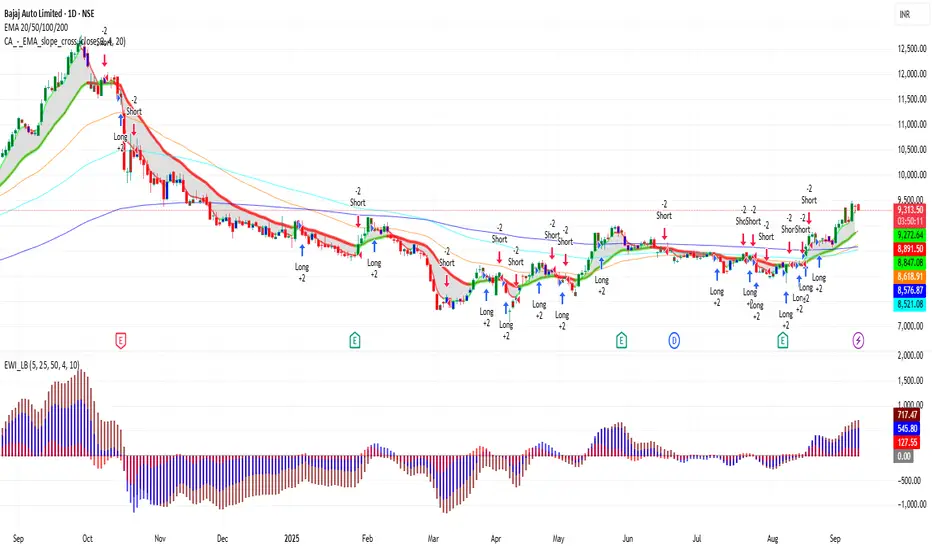
BAJAJ_AUTO 1D Time frame📍 BAJAJ_AUTO – 1D Important Levels (Current)
🔹 Support Zones
9,050 – 9,100 → Immediate daily support
8,800 – 8,900 → Strong support; buyers likely to defend this zone
8,500 – 8,600 → Major support; breakdown here may shift trend bearish
🔹 Resistance Zones
9,300 – 9,400 → Immediate daily resistance
9,550 – 9,650 → Strong resistance zone; breakout may extend upside momentum
9,800 – 10,000 → Major psychological resistance; if crossed, bullish trend strengthens further
⚖️ Daily Trend Outlook
Bajaj Auto is in a bullish structure on the daily chart, forming higher lows.
As long as price stays above 9,050, the stock remains positive.
A breakout above 9,400 – 9,650 can take it towards 9,800 – 10,000.
A breakdown below 9,050 could drag it towards 8,900 – 8,600.
TATAMOTOR 1H Tata Motors – 1 Hour Chart Analysis
🔹 Trend Overview
On the 1-hour chart, Tata Motors is currently showing bullish momentum with higher highs and higher lows.
However, price is also facing some resistance near the upper range, so intraday swings are possible.
🔹 Key Levels to Watch
Immediate Support Zone: around ₹706 – ₹709
Stronger Support: near ₹700
Immediate Resistance Zone: around ₹717 – ₹721
Major Resistance: around ₹734 – ₹735
🔹 Intraday Trading View
If price holds above ₹709, bulls may push towards ₹721 – ₹734.
If price slips below ₹706, a retest of ₹700 – ₹695 is possible.
Consolidation is likely in the ₹709 – ₹721 range before any major breakout.
🔹 Indicators (1-Hour Chart)
Moving Averages → Price trading above 20 EMA and 50 EMA, showing short-term strength.
RSI → Near the 60–65 zone, still bullish but close to overbought.
Volume → Slightly increasing on up-moves, showing buyers are active.
🔹 Summary
Bias: Bullish to range-bound
Support Levels: ₹706 / ₹700
Resistance Levels: ₹721 / ₹734
Intraday traders should watch the ₹709 – ₹721 band for breakout or breakdown trades.

XAUUSD 1H📍 XAUUSD – 1H Key Levels
🔹 Support Zones
$1925 – $1927 → Immediate intraday support
$1918 – $1920 → Stronger short-term support
$1910 – $1912 → Major support zone, breakdown could trigger deeper fall
🔹 Resistance Zones
$1935 – $1937 → First intraday resistance
$1945 – $1947 → Strong resistance area where sellers may re-enter
$1955 – $1960 → Major resistance; breakout above this can fuel a larger rally
⚖️ Quick Summary
Above $1935, bulls may push toward $1945 – $1960.
Below $1920, bears could drag price back to $1910 – $1900.
Range to monitor: $1920 – $1935 (decisive breakout will set next trend).
XAUUSD (Gold) – 1H Chart Analysis
🔹 Trend Overview
On the 1-hour chart, XAUUSD is currently showing short-term bullish bias but with nearby resistance.
Price action is making higher lows, but upside moves are facing supply zones.
🔹 Key Levels to Watch
Immediate Support Zone: $1918 – $1922
Major Support: $1910 – $1912
Immediate Resistance Zone: $1935 – $1940
Stronger Resistance: $1950
🔹 Indicators (1H Chart)
Moving Averages → Price trading above 20 EMA and near 50 EMA, showing short-term strength.
RSI (Relative Strength Index) → Around 60–65, leaning bullish but not overbought.
MACD → Positive crossover, momentum favoring buyers.
Volume → Buying volume spikes at dips, showing accumulation.
🔹 Intraday Trading Scenarios
Bullish Case
If price sustains above $1935, upside can extend to $1945 – $1950.
Breakout above $1950 opens path toward $1960+.
Bearish Case
If price drops below $1922, retracement towards $1912 – $1910 is possible.
Strong breakdown below $1910 may test $1900.
🔹 Summary
Bias: Mildly Bullish (as long as above $1920 support)
Support Levels: $1922 / $1910
Resistance Levels: $1935 / $1950
Traders should watch the $1920 – $1935 zone for the next decisive move.
