Aether Industry — 92% profit growth and zero debt NSE:AETHER
A silent specialty chemical beast—92% profit growth and zero debt...!
🏢 **Company Overview:**
Aether Industries is a Surat-based specialty chemical manufacturer focused on high-margin, research-driven intermediates used in pharmaceuticals, agrochemicals, coatings, and oil & gas. It is known for proprietary process chemistry and niche product innovation.
📈 Fundamental Analysis:
✅ Key Financials (FY25 Estimates):
Market Cap: ₹10,900 Cr
Revenue: ₹838 Cr (+40% YoY)
Net Profit: ₹158 Cr (+92% YoY)
EBITDA Margin: ~32%
Net Profit Margin: ~19%
ROE / ROCE: ~7.4% / ~6%
P/E Ratio: ~70x
Debt to Equity: ~0.06 (Debt-free)
🧩 Strengths:
Fast-growing specialty chemical company with proprietary products.
Debt-free and financially stable.
High-margin CRAMS and contract manufacturing model.
⚠️ Risks:
Valuation is rich, pricing in future growth.
Return ratios (ROE/ROCE) are modest compared to peers.
📊 Technical Analysis (As of July 2025):
CMP: ₹823
52-Week Range: ₹725 – ₹1,071
Moving Averages: Price above 50/100-day MAs; approaching 200-day MA
RSI: ~65 (Neutral–Bullish)
MACD: Neutral to Mild Bullish
Support: ₹780 – ₹800
Resistance: ₹832 – ₹840
📉 Short-Term Outlook:
A breakout above ₹840 may trigger upside to ₹900+. A close below ₹800 could lead to short-term weakness.
🚀 Future Growth Prospects:
High-Margin Niche Leadership: Focused on low-volume, high-value intermediates with global demand.
Strong Financial Performance: Consistent revenue and profit growth; scalable R&D-driven model.
Export & Global Pharma Exposure: Major clients across US, EU, and Japan.
New Capacity Expansion: Setting up new manufacturing blocks to double capacity over the next 2 years.
📝 Conclusion:
Parameter Verdict
Fundamentals 🔵 Strong – R&D-led growth with clean balance sheet
Technicals 🟠 Mixed – needs breakout above key resistance
Valuation 🟠 Expensive – high P/E, growth priced in
Long-Term View ✅ Positive – niche specialty play
Short-Term View 🔄 Wait for breakout or accumulate on dips
==========================================================
==========================================================
⚠️ Disclaimer:
This analysis is for educational and informational purposes only.
We are not SEBI-registered analysts or advisors.
This is our personal view based on available data and market trends.
Please consult your SEBI-registered investment advisor before making any investment or trading decisions.
You are solely responsible for any financial decisions you make based on this content.
========================
Trade Secrets By Pratik
========================
Intraday
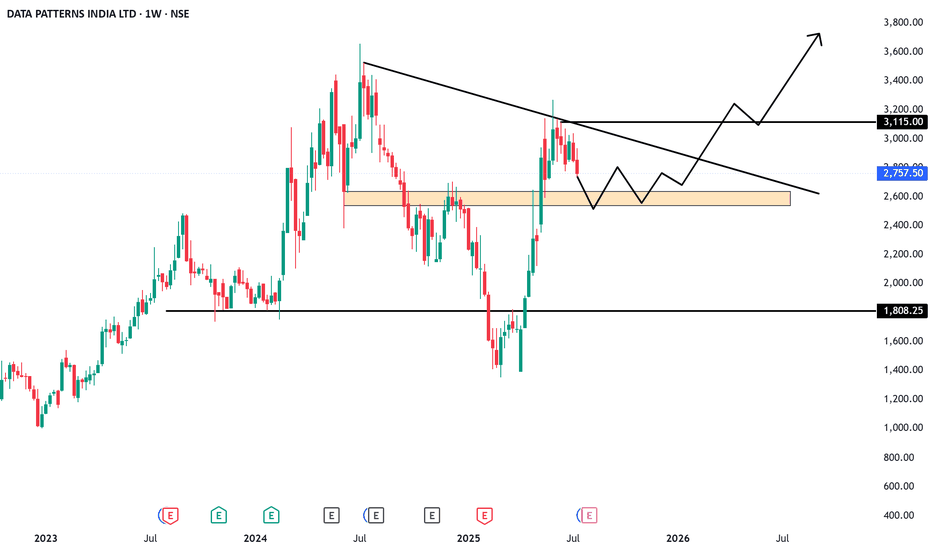
Data Patterns: Brain behind India’s missile, radar & ISRO tech.NSE:DATAPATTNS
🏢 Company Overview:
Data Patterns is a vertically integrated defense and aerospace electronics solutions provider. It designs, develops, manufactures, and tests advanced electronic systems used in:
Radar, Electronic Warfare
Avionics, Missile Systems
Satcom, Communication & Surveillance
It’s one of the few Indian defense electronics companies with end-to-end capabilities—from design to delivery.
📈 Fundamental Analysis:
✅ Key Financials (FY24-25 Estimates):
Market Cap ₹13,000+ Cr
Revenue (FY24) ₹480–500 Cr
EBITDA Margin ~38%
PAT Margin ~28–30%
ROE / ROCE 25%+ / 30%+
Debt to Equity 0 (Debt-free)
P/E Ratio ~70x (Premium)
🧩 Strengths:
Strong order book visibility with over ₹900 Cr+ backlog.
In-house R&D and full control over hardware + software.
Supplied systems to ISRO, DRDO, BEL, HAL — proven credibility.
High margin & asset-light business model.
⚠️ Risks:
Heavy dependency on government contracts (lumpy revenue).
High valuations — pricing in future growth.
Competition from global defense OEMs and local PSU giants.
📊 Technical Analysis (As of July 2025):
🧾 Price Action Summary:
CMP: ₹2,880 (Example)
52-Week Range: ₹1,650 – ₹2,980
Trend: Strong uptrend since Jan 2025
Support Zone: ₹2,550 – ₹2,650
Resistance: ₹3,000 (psychological and technical resistance)
🔍 Indicators:
200 EMA: ₹2,200 (Stock trading well above long-term average)
MACD: Positive with histogram expanding
RSI: 71 – Overbought, watch for pullbacks
Volume: Spikes near breakout levels – confirms strength
📉 Short-Term View:
Likely to consolidate near ₹2,800–₹3,000
Fresh breakout above ₹3,000 may lead to ₹3,400–₹3,600 zone
🚀 Future Growth Prospects:
🛰️ 1. Defense Capex Boom:
Indian Government’s “Atmanirbhar Bharat” push & higher defense budget directly benefits defense tech firms like Data Patterns.
🧠 2. R&D & IP-Led Growth:
Owns IP of most products – high operating leverage and export potential.
🌍 3. Export Market Entry:
Partnering with foreign OEMs; growing traction in South-East Asia, Middle East.
🛠️ 4. Order Book Strength:
High-margin orders across radar, avionics, and missile sub-systems.
Client base includes DRDO, BrahMos, BEL, ISRO, HAL – strong pipeline ahead.
📝 Conclusion:
Parameter Verdict
Fundamentals 🔵 Very Strong (Debt-free, high ROCE)
Technicals 🟢 Bullish (Watch ₹3,000 zone)
Valuation 🟡 Expensive but justified by moat
Long-Term View ✅ Positive – IP-driven defense electronics play
Short-Term View 🔄 Wait for breakout or buy on dips near ₹2,600
=====================================================
=====================================================
⚠️ Disclaimer:
This analysis is for educational and informational purposes only.
We are not SEBI-registered analysts or advisors.
This is our personal view based on available data and market trends.
Please consult your SEBI-registered investment advisor before making any investment or trading decisions.
You are solely responsible for any financial decisions you make based on this content.
========================
Trade Secrets By Pratik
========================
MTAR Technologies: The hidden giant behind space & clean Energy NSE:MTARTECH
🏢 Company Overview:
MTAR Technologies Ltd is a precision engineering company catering to high-value, mission-critical sectors such as:
Clean Energy (Hydrogen, Nuclear, etc.)
Space & Defence
Aerospace
They manufacture critical components like fuel cells, nuclear reactor parts, aerospace engines, and satellite launch system parts.
📈 Fundamental Analysis:
✅ Key Financials (FY24-25 Estimates):
Market Cap : ₹6,500+ Cr
Revenue (FY24) : ₹650 Cr+
EBITDA Margin : ~28-30%
PAT Margin : ~15%
ROE / ROCE : 15-18% / 20%+
Debt to Equity : 0.1 (Very low)
P/E Ratio : ~45x (Premium)
🧩 Strengths:
Strong order book from ISRO, DRDO, BHEL, and international clean energy players like Bloom Energy.
Technological moat in nuclear & space-grade precision engineering.
Low debt, high return ratios—financials are robust.
Entering Hydrogen & Fuel Cell space—a big long-term catalyst.
⚠️ Risks:
Dependency on a few clients (Bloom Energy being a major one).
Volatility in clean energy adoption pace.
High valuation – priced for growth.
📊 Technical Analysis (As of July 2025):
🧾 Price Action Summary:
CMP: ₹2,050 (Example)
52-Week Range: ₹1,250 – ₹2,150
Trend: Bullish continuation from March 2025
Support Zone: ₹1,860 – ₹1,950
Resistance: ₹2,150 (all-time high breakout zone)
🔍 Indicators:
200 EMA: ₹1,620 (Stock trading well above 200 EMA)
MACD: Bullish crossover on daily chart
RSI: ~67—momentum strong but near overbought zone
Volume: Rising steadily with price—confirms strength
📉 Short-Term View:
Healthy consolidation expected around ₹2,000–₹2,150
A breakout above ₹2,150 could lead to ₹2,400–₹2,600 zone
🚀 Future Growth Prospects:
🔬 1. Clean Energy Boom:
Supplying parts to Bloom Energy (US-based Fuel Cell firm).
India’s green hydrogen policy and PLI schemes can benefit MTAR.
🛰️ 2. Space & Defense:
Increasing budgets in defense, ISRO’s new missions, and India’s entry into private space programs can drive long-term orders.
💹 3. Export Potential:
MTAR is entering global markets for nuclear and aerospace precision components.
USD-denominated revenues provide a hedge and higher margins.
🌱 4. Capex & Expansion:
New manufacturing facility in Adibatla, Telangana.
Capex being done to triple capacity in the coming 3–5 years.
📝 Conclusion:
Parameter Verdict
Fundamentals 🔵 Strong (Clean Balance Sheet, Healthy Margins)
Technicals 🟢 Bullish (But Near Resistance)
Valuation 🟡 Slightly Overvalued (but justified by growth)
Long-Term View ✅ Positive – Multiyear structural story
Short-Term View 🔄 Wait for consolidation or breakout above ₹2,150
⚠️ Disclaimer:
This analysis is for educational and informational purposes only.
We are not SEBI-registered analysts or advisors.
This is our personal view based on available data and market trends.
Please consult your SEBI-registered investment advisor before making any investment or trading decisions.
You are solely responsible for any financial decisions you make based on this content.
========================
Trade Secrets By Pratik
========================
Tools
CAMLINFINE Very high Potential ScriptNSE:CAMLINFINE
Stock has given Very strong move in weekly chart from 130 to 330 within just 5-6 weeks
It shows the strength now it's consolidating with low volume.
High potential of Flag and pole setup
Good to keep on the radar
Always respect SL & position sizing
========================
Trade Secrets By Pratik
========================
Disclaimer
NOT SEBI REGISTERED
This is our personal view and this analysis
is only for educational purposes
Please consult your advisor before
investing or trading
You are solely responsible for any decisions
you take on basis of our research.
Monday Trade Plan (Nifty 50) 🔼 Bullish Levels (Call Side Entry):
Above 25,008
🔹 Hold CE (Call) — Positive trade view.
Above 25,118
🔹 Hold CE by Entry Level
🚨 Below this: Risky Zone for PE (Put)
Above 25,218
🔹 10 min Closing Short Cover Level
✅ Strong momentum expected above this zone
🔽 Bearish Levels (Put Side Entry):
Below 25,000
🔻 Hold PE — Negative trade view.
Below 24,888
🔻 Opening R1 10m — Hold PE by level
Below 24,788
🔻 Hold PE by level
Below 24,688
🔻 Hold PE by Safe Zone level
Below 24,600 (Approx)
🧯 UNWINDING ZONE
🔻 Strong downward momentum expected
⚠️ Mid-Zone / Risk Areas:
Between 25,000 – 25,008: No clear direction
Between 25,088 – 25,118: Risky Zone for PE
Between 24,788 – 24,888: Rangebound area, watch for breakout
Nifty 50 Intraday Trade Plan - 17 July 2025🔴 Bullish Scenario (CE Buy Zones):
Above 25,480 → Shot Cover Level
→ CE BUY with strong momentum.
Above 25,338 → Entry Level for CE
→ CE BUY possible; moderate conviction.
Above 25,270 → Positive Trade View Starts
→ Start building CE positions cautiously.
Above 25,198.55 (Opening S1 Level)
→ Intraday CE HOLD if already bought.
Above 25,080 → CE by Buy Level
→ Entry-level for CE if market recovers.
Above 24,978 → CE Buy Safe Zone
→ Safer entry for CE, if bounce observed.
🔵 Bearish Scenario (PE Buy Zones):
Below 25,480 → PE by Safe Zone
→ PE can be added gradually.
Below 25,338 → Risky Zone for PE
→ PE buy with risk, SL tight.
Below 25,270 → Negative View Begins
→ Confidence increases in PE position.
Below 25,172 (Opening R1 Level)
→ If breaks this, PE HOLD.
Below 25,080 → PE by Buy Level
Below 24,978 → UNWINDING Level
→ Expect strong selling; PE aggressive buy zone.
🎯 Key Zones to Watch:
Range Bound Zone: Between 25,172 – 25,270
Trend Decider Zone:
Break above 25,270: Bullish Bias
Break below 25,172: Bearish Bias
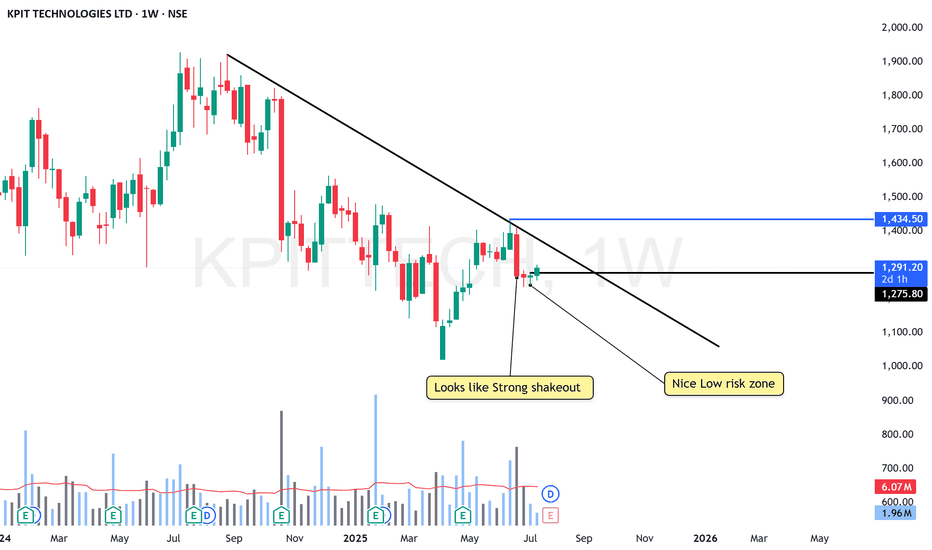
KPIT At low risk Zone - Getting ready to BlastNSE:KPITTECH
Its at Nice low risk Zone
KEEP IN MIND: The 6Rs Dividend Announced at QTR is on 28th JULY
Good to keep on the radar
Always respect SL & position sizing
========================
Trade Secrets By Pratik
========================
Disclaimer
NOT SEBI REGISTERED
This is our personal view and this analysis
is only for educational purposes
Please consult your advisor before
investing or trading
You are solely responsible for any decisions
you take on basis of our research.
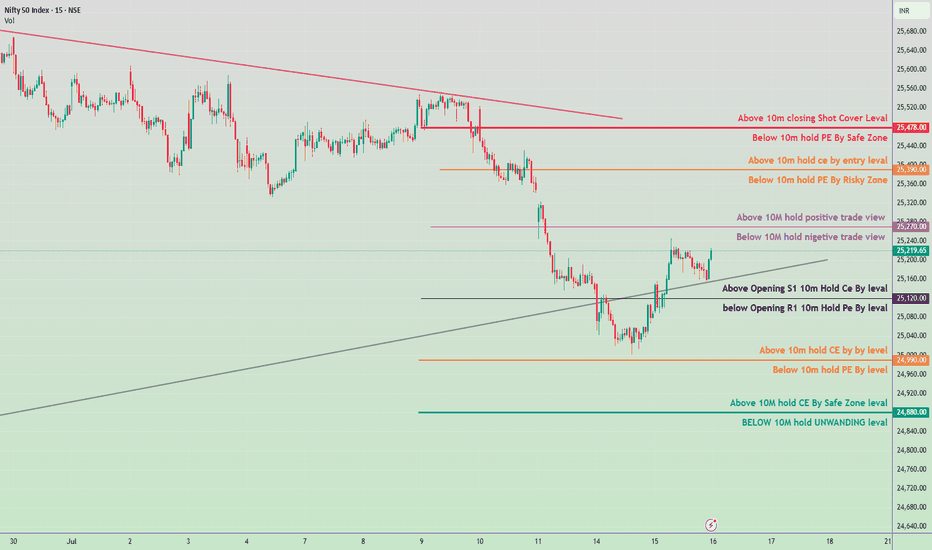
Nifty 50 – Intraday Plan for July 16, 2025📊 Intraday Key Levels & Strategy:
🔺 Upside Zones (CE Bias):
25,270 – Above 10M hold = Positive Trade View
25,390 – Above 10m hold CE by entry level
25,478 – Above 10m closing = Shot Cover Level
⚠️ Neutral to Mixed Zones:
25,120 – Above Opening S1: 10m Hold CE Buy Level
25,100 – Below Opening R1: 10m Hold PE Buy Level
25,070 – Below 10M = Negative Trade View
🔻 Downside Zones (PE Bias):
24,990 – Below 10m hold PE by level
24,920 – Below 10m hold PE = Risky Zone
24,880 – Above 10M = CE Safe Zone
24,860 – BELOW 10M = UNWINDING zone.
✅ Suggested Intraday Plan:
Bullish Scenario (CE Trades):
Buy CE above 25,120 (Only if 10 min candle holds).
Add on breakout & hold above 25,270.
Target zone: 25,390–25,478.
SL: Below 25,070.
Bearish Scenario (PE Trades):
Sell/Buy PE below 25,100 (Only if 10 min candle sustains).
Confirm further weakness if below 24,990 or 24,920.
Target zone: 24,880–24,860.
SL: Above 25,120.
MANKIND Pharma Ready to blastNSE:MANKIND
Nice breakout, with volume surges.
Now trying to retest Support.
Good to keep on the radar
Always respect SL & position sizing
========================
Trade Secrets By Pratik
========================
Disclaimer
NOT SEBI REGISTERED
This is our personal view and this analysis
is only for educational purposes
Please consult your advisor before
investing or trading
You are solely responsible for any decisions
you take on basis of our research.
Nifty 50 Intraday Trade Plan July 15, 2025🔴 Upper Resistance Levels:
25,430.00
🔺 Above 10m closing: Short Cover Level
🔻 Below 10m: Hold PE (Safe Zone)
25,280.00
🔺 Above 10m: Hold CE (Entry Level)
25,240.00
🔻 Below 10m: Hold PE (Risky Zone)
25,160.00
🔺 Above 10M: Hold Positive Trade View
🔻 Below 10M: Hold Negative Trade View
🟢 Current Zone:
Market is trading near 25,087.10
Watch levels:
25,030.00 – Above Opening S1: Hold CE by level
25,000.00 – Below Opening R1: Hold PE by level
🟠 Lower Support Levels:
24,960.00
🔺 Above 10m: Hold CE by level
24,920.00
🔻 Below 10m: Hold PE by level
24,800.00
🔺 Above 10M: Hold CE by Safe Zone
24,760.00
🔻 Below 10M: UNWINDING Level
🔍 Strategy Suggestions:
✅ Bullish Bias:
If price sustains above 25,160, consider Call Option Buy (CE) or bullish trades.
❌ Bearish Bias:
If price fails below 25,030 or 24,920, consider Put Option Buy (PE) or short positions.
Nifty 50 Intraday Trade Plan 11 july 2025🔴 Resistance & Shorting Zones:
25,620.00
🔹 Above 10m Closing = Short Cover level
🔹 Below 10m = PE by Safe Zone
25,518.00
🔹 Above 10m = Hold CE by Entry level
🔹 Below 10m = PE by Risky Zone
25,420.00
🔹 Above 10m = Hold Positive Trade View
🔹 Below 10m = Negative Trade View
⚖️ Neutral / Opening Zone:
25,348.25 (CMP)
🔸 Above Opening S1 = Hold CE by Level
🔸 Below Opening R1 = Hold PE by Level
🟠 Intermediate Support/Resistance:
25,260.00
🔸 Above 10m = Hold CE by Level
🔸 Below 10m = Hold PE by Level
🟢 Support & Unwinding Zones:
25,178.00
🔹 Above 10m = CE by Safe Zone
🔹 Below 10m = Unwinding Level
📌 Summary:
A move above 25,420 may shift view to bullish/intraday CE hold.
Below 25,260 suggests weakness, possible PE play.
Major support at 25,178, breakdown below this might trigger heavy unwinding.
Nifty 50 Intraday Trade Plan for July 9, 2025🔴 Upper Resistance Zones (Short Covering Area)
🔺 25,738.00 – Shot Cover Level
If a 10-minute candle closes above this level, expect short covering – bullish breakout.
If price comes below this after testing, it's a safe zone to hold PE (puts).
🟧 25,640.00 – CE Entry Zone
Above this: Call options (CE) can be held.
Below this: Risky zone for holding PE, volatility may increase.
🟪 25,573.00 – Sentiment Zone
Above this: Positive trade bias.
Below this: Negative trade bias, indicating weakness.
⚫ Midpoint Zone (Opening & Pivot-Based Decision Area)
⚫ 25,465.65 – Opening + S1/R1 Zone
Above this level: Hold CE positions (bullish intraday setup).
Below this level: Hold PE positions (bearish setup).
🟠 Lower Mid-Level (Support/Breakdown Test)
🟠 25,380.00
Above: Intraday buy CE zone.
Below: PE can be held for more downside.
🟢 Bottom Support Zone (Safe Zone / Unwinding Zone)
🟢 25,292.00 – Safe CE Hold Zone
If the price holds above this level after 10 min: safe to hold CE.
🟢 25,282.00 – Unwinding Zone
Below this level: Risk of unwinding and larger sell-off increases.
📌 How to Use This Plan (Summary)
Wait for 10-minute candle confirmations near these levels.
Follow directional bias: CE (calls) if price sustains above levels, PE (puts) if price remains below.
Trade only after confirmation, not just touch.
Indus tower Retesting NSE:INDUSTOWER
Retesting BO level and 20 EMA (orange)
Good to keep on the radar
Always respect SL & position sizing
========================
Trade Secrets By Pratik
========================
Disclaimer
NOT SEBI REGISTERED
This is our personal view and this analysis
is only for educational purposes
Please consult your advisor before
investing or trading
You are solely responsible for any decisions
you take on basis of our research.
TVS motors Good to studyNSE:TVSMOTOR
Its on the verge of new Breakout
Good to keep on the radar
Always respect SL & position sizing
========================
Trade Secrets By Pratik
========================
Disclaimer
NOT SEBI REGISTERED
This is our personal view and this analysis
is only for educational purposes
Please consult your advisor before
investing or trading
You are solely responsible for any decisions
you take on basis of our research.
VBL (VARUN BRAVERAGES) strong candidate at discount rateNSE:VBL
Strong reversal Possible here
Good to keep on the radar
Always respect SL & position sizing
========================
Trade Secrets By Pratik
========================
Disclaimer
NOT SEBI REGISTERED
This is our personal view and this analysis
is only for educational purposes
Please consult your advisor before
investing or trading
You are solely responsible for any decisions
you take on basis of our research.
VENUSPIPES Good to Study for longNSE:VENUSPIPES
Good to keep on the radar
Always respect SL & position sizing
========================
Trade Secrets By Pratik
========================
Disclaimer
NOT SEBI REGISTERED
This is our personal view and this analysis
is only for educational purposes
Please consult your advisor before
investing or trading
You are solely responsible for any decisions you take on the basis of our research.
Lupin good Potential for Reversal NSE:LUPIN
Good to keep on the radar
Always respect SL & position sizing
========================
Trade Secrets By Pratik
========================
Disclaimer
NOT SEBI REGISTERED
This is our personal view and this analysis
is only for educational purposes
Please consult your advisor before
investing or trading
You are solely responsible for any decisions
you take on basis of our research.
NIFTY is in channel NSE:NIFTY
Either side breakout is possible; just simply follow the price.
Good to keep on the radar
Always respect SL & position sizing
========================
Trade Secrets By Pratik
========================
Disclaimer
NOT SEBI REGISTERED
This is our personal view and this analysis
is only for educational purposes
Please consult your advisor before
investing or trading
You are solely responsible for any decisions
you take on basis of our research.
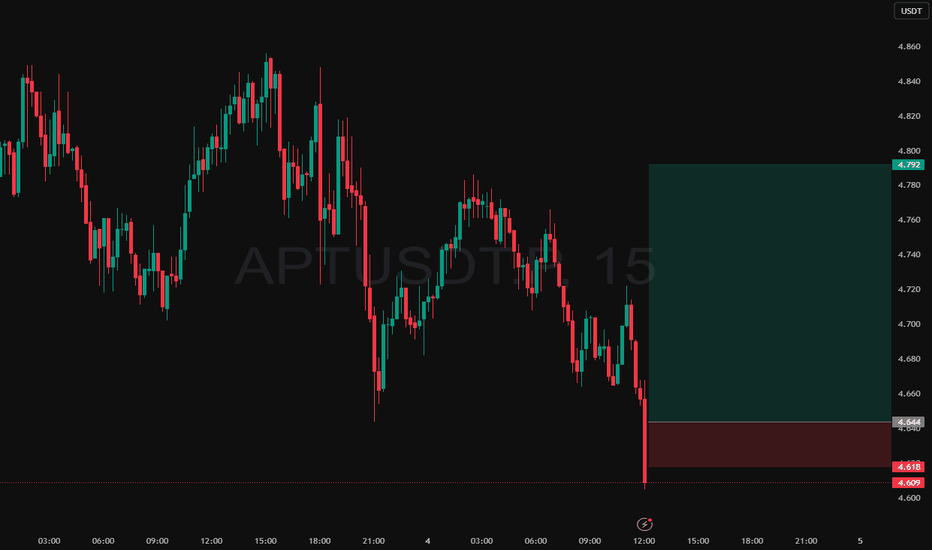
Intraday Long Setup | July 4th 2025 | Valid Until Daily ClosePrice retraced to a strong pivot zone.
Structure remains bullish with potential for continuation after pullback.
Tight risk control.
Watch for price reaction within the red zone. Entry only if confirmation appears
The setup expires at end of the daily candle close.
Intraday Long Setup | July 1st 2025 | Valid Until Daily ClosePrice retraced to a strong pivot zone.
Structure remains bullish with potential for continuation after pullback.
Tight risk control.
Watch for price reaction within the red zone. Entry only if confirmation appears
The setup expires at end of the daily candle close.
Nifty 50 Intraday Trade Plan for July 4, 2025🔼 Bullish (Call Option / CE Buy Strategy)
✅ Zone 1: Above 25,490
If Nifty holds above 25,490 for 10 minutes, sentiment turns positive.
This is the first sign of bullishness. You can initiate CE positions with caution.
✅ Zone 2: Above 25,620
Holding above 25,620 for 10 minutes = entry confirmation for CE buy.
This is a riskier zone but indicates bullish breakout strength.
✅ Zone 3: Above 25,700
If Nifty sustains or closes above 25,700, short covering may start.
This is a safe zone for CE buyers with strong momentum.
🔽 Bearish (Put Option / PE Buy Strategy)
🚫 Zone 1: Below 25,490
Holding below 25,490 for 10 minutes turns view negative.
Suitable to initiate PE trades cautiously.
🚫 Zone 2: Below 25,340
This is the Opening R1 level. Holding below it confirms bearishness.
Good level to enter PE with confirmation.
🚫 Zone 3: Below 25,220
Holding below this level confirms continuation of bearish move.
Another chance to buy PE if missed above.
🚫 Zone 4: Below 25,000
If Nifty breaks 25,000 and sustains below for 10 minutes:
It enters a strong unwinding zone.
Strong selling may follow.
🔁 Neutral / Flip Zones (Critical for Trend Decision)
➖ 25,340 Zone:
If Nifty stays above 25,340 for 10m, you can try CE.
If it breaks down, look for PE below 25,340.


