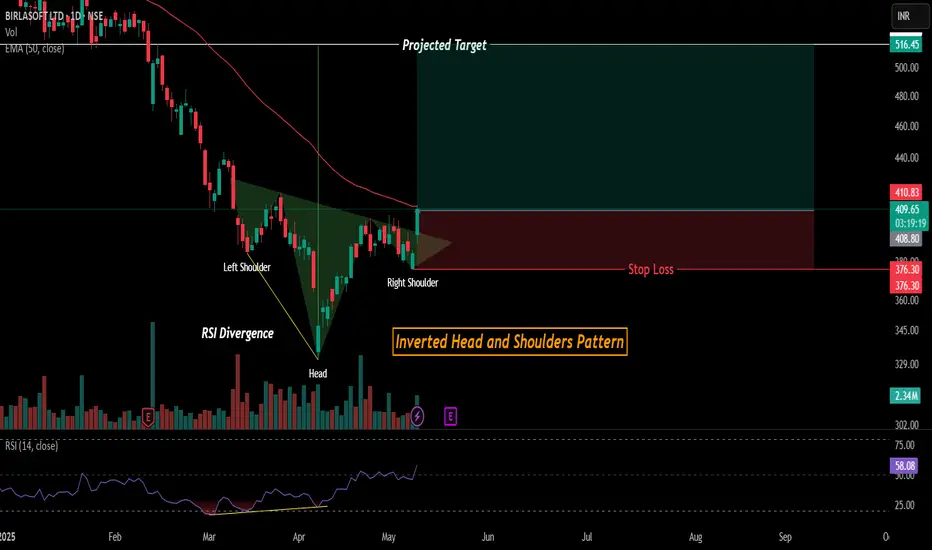
Trend Reversal setup in BSOFT(Inverted H&S Pattern)!Birlasoft (NSE:BSOFT) – Bullish Reversal on Inverted Head & Shoulders
📌 Technical Pattern: A classic Inverted Head and Shoulders pattern is forming, suggesting a potential reversal from the recent downtrend.
✅ Key Highlights:
RSI Divergence at the head hints at waning bearish momentum and potential reversal.
Price is testing the neckline zone; a breakout could confirm the bullish setup.
50-period EMA (~₹452) remains overhead, acting as a dynamic resistance.
📈 Target: ~₹516, calculated from the pattern height.
🔻 Stop Loss: Near ₹376, just below the right shoulder structure.
🧠 Strategy Note: A sustained close above the neckline, preferably on volume, can offer a strong risk-reward trade setup. RSI currently at 58 supports bullish momentum continuation.
Disclaimer: Consider my analysis for educational purposes only.
Before entering any trade:
1️⃣ Educate Yourself – Understand market dynamics and technical patterns.
2️⃣ Do Your Own Research & Analysis – Never rely solely on external opinions.
3️⃣ Define Your Risk-Reward Ratio – Ensure your trade aligns with your risk appetite.
4️⃣ Never Trade with Full Capital – Always manage risk and preserve capital.
Trade wisely! ✅📊
Invertedheadabdshoulderspatterns
Trend Reversal setup in HCLTECH(Inverted H&S Pattern)!HCL Technologies (NSE:HCLTECH) – Bullish Reversal Setup
📌 Pattern Identified: A clear Inverted Head and Shoulders formation is visible on the daily chart, indicating a potential bullish reversal.
✅ Key Observations:
Price has broken above the neckline and also crossed the 50-period EMA, showing strength.
Notable volume buildup at the right shoulder, supporting the bullish move.
RSI is above 60, suggesting improving momentum.
📈 Projected Target: ~₹2,074 based on the pattern's height.
🔻 Stop Loss: Placed slightly below the right shoulder near ₹1,537.
⚠️ Watch Levels:
₹1,696: Minor resistance.
₹1,780: Key resistance level before the target zone.
📝 Conclusion: A breakout above the neckline with volume confirms the bullish pattern. As long as the price sustains above the stop loss, the risk-reward appears favorable.
Disclaimer: Consider my analysis for educational purposes only.
Before entering any trade:
1️⃣ Educate Yourself – Understand market dynamics and technical patterns.
2️⃣ Do Your Own Research & Analysis – Never rely solely on external opinions.
3️⃣ Define Your Risk-Reward Ratio – Ensure your trade aligns with your risk appetite.
4️⃣ Never Trade with Full Capital – Always manage risk and preserve capital.
Trade wisely! ✅📊

GSPL | Breakout Trading | Inverted Head and Shoulder pattern GSPL | Breakout Trading | Inverted Head and Shoulder pattern
Swing trade idea for GSPL

TVS MOTOR INV HEAD & SHOULDER BREAKOUT & RETEST STRATEGY TVS MOTOR CO
1. Inv Head & Shoulder Pattern
2. Breakout & retest strategy
3. Close within 52W high zone (2313.45)
4. Close above the previous day's high (2238.80)
5. High increase in 1 month (+9.6%)
6. High increase in 12 months (+72.3%)
7. Promoter holding 50.27 %
8. Pledged percentage 0.00 %
9. Change in Prom Hold 0.00%
10. FII holding 20.8 %
11. Chg in FII Hold 1.56 %
12. DII holding 20.3%
13. Chg in DII Hold -1.53%
14. Stock PE 63.4
15. Industry PE 63.4
16. ROCE 18.8%
17. ROE 27.4%
For Educational Purpose Only

Reliance Industries Analysis! Trend Reversal??Reliance Industries Daily Analysis!
Inverted Head and Shoulder Pattern Formation in Reliance Industries on Daily Timeframe!
Does trend reversal will happen?
Does the clear downtrend will be converted into Uptrend?
NIFTY also forming the same pattern please look Nifty Analysis also by clicking on the below link!
As we know the Inverted Head and Shoulder Pattern is a Reversal Pattern and it detected after a Downtrend. After that we have seen a positive move in Reliance Industries. In last 4 trading sessions Reliance Industries gives a breakout to the Neckline and trading above it but in the last trading session we can see the selling pressure was high. So Reliance Industries couldn't break the key level which is 2462.85 which is the Resistance level also. So we are waiting for Reliance Industries to break the key level Then only it will be a decent Entry.
Trade Initiation =
Entry = Above 2462.85
Target = 1) 2488.40 2) 2593.15 3)2700
Stop Loss = Below 2404.50
Rest of the Analysis you will find on the chart. I have done all the possible Analysis on the chart which took lots of time. If you like this Analysis please support this Analysis.
I hope you will lean something about Technical Analysis from this chart.
Thank you all for your Support!
Disclaimer = All my analysis are for Educational Purpose only. Before entering into any trade - 1) Educate Yourself 2) Do your own research and analysis 3) Define your Risk to Reward ratio 4)Don't trade with full capital

ABFRL : Watchout for Inverted Head and ShouldersNSE:ABFRL has been in a down trend for a Long time now. Inverted Head and Shoulders pattern has been formed. The long positions in the stock can be taken after the completion of the pattern that is after the breakout and closing of candle above the neckline.

GUJARATPOLY Analysis(H&S Pattern)! BSE:GUJARATPOLY Analysis!
Inverted Head and Shoulders Pattern Formation in GUJARATPOLY on Daily Timeframe!
Inverted Head and Shoulders Pattern Breakout in GUJARATPOLY!
Trend Reversal in GUJARATPOLY!
GUJARATPOLY has made INVERTED HEAD AND SHOULDERS PATTERN on a daily timeframe. We can see the price was moving in Falling Parallel Channel . Price has given breakout to the channel on 11 May but it hasn't sustained so we can considered it as a Fakeout . Again prive has given breakout to the channel on 29 May and it has sustained. Also given breakout to the Neackline but we have experienced a selling pressure around it's necklevel.
Entry = Aggressive investors can buy at current levels, Conservative investors can wait for small retest.
Stop Loss = Below 37.40
Targets = 1) 49.70 2) 56.99 3) 65.01
Disclaimer = All my analysis are for Educational Purpose only. Before entering into any trade - 1) Educate Yourself 2) Do your own research and analysis 3) Define your Risk to Reward ratio 4) Don't trade with full capital

Inverted Head and Shoulders Breakout in KIRLOSBROSOn 23 sept 2022. NSE:KIRLOSBROS gave a breakout of Inverted Head and shoulders and Managed to close above the Neckline on Daily Time frame. ADX above 29 indicating that stock is going to trend soon.
TRADE - Positional trading
BUY - 369 - 372
TARGET - 482
STOP LOSS - 346

TARGET 1 Achieved in HAL 20% profit done, Ready for new highsHAL after forming IH&S breakout above levels marked on the chart with great volumes. Post this breakout target 1 is now achieved.
Kindly check previous HAL idea posted with all details.
Levels are explained in charts
Disclaimer: This study is for educational purpose only & is not buying or selling recommendations. I am not SEBI registered. Please consult your financial advisor before taking any trade.

#interglobeaviation #indigo inverted weekly HNS breakoutThe stocks seem to be breaking out of an inverted head and shoulder pattern on weekly.
Daily may be breaking out a flag pattern after earlier consolidation.
The volumes are above moving average.The trend indicator is in dmi positive bull zones
on all timeframes and trend strength is seen rising on all timeframes.
Momentum also is bullish on all timeframes. With a stop loss below neckline of the pattern
This swing /positional trade could further move reasonably good risk reward if pattern works out.

L&T - Inverted Head & Shoulder breakout🔴DISCLAIMER
***** It's just for an educational purpose and so you must also follow your own technical analysis before taking up the trade ******
Aggressive traders enter at the breakout and conservative traders may give entry after retracement (Retracement is optional, we cannot expect every stock to take a retest after the breakout, it may also continue to have its bullish pressure after the breakout)
After reaching our targets, trail your stop loss to get maximum profit from the stock in a single trade
Comments

Coal India - Inverted Head and Shoulder patternCoal India weekly chart shows inverted head and shoulders pattern. A weekly breakout is seen in the chart. The technical target is 180.
Note: I am just a beginner. This chart is for learning and educational purpose only. Kindly invest based on your research and analysis. Do not forget to give a like if you find this chart helpful. Happy investing :)

WABAG - Inverted head and shoulders & Cup and Handle patVA TECH WABAG weekly chart shows Inverted head and shoulders and cup and handle pattern. Can buy at cmp with a stop loss of 203 or can buy once there is breakout for further up move. Can go long with a trailing stop loss for the technical target of 237.
Note: I am just a beginner. This chart is for learning and educational purpose only. Kindly invest based on your research and analysis. Do not forget to give a like if you find this chart helpful. Happy investing :)
