Triangle Contraction Symphony: Hidden Supports, Inverted H&SWitness the mesmerizing dance of price action in this chart masterpiece. A pristine triangle contraction pattern emerges, bounded by a supportive yellow trendline below and a red counter-trendline above, perfectly channeling price within tightening bounds.
Layered hidden dotted support/resistance lines add depth, illustrating how price meticulously respects each level—time and again.
Culminating in a textbook inverted head and shoulders formation, this setup showcases contraction elegance at its finest.
Purely educational: Reliving how these levels held in the past. No directional bias here—just the raw beauty of price action precision.
Disclaimer: This post is for educational purposes only, demonstrating historical price action behavior and level interactions. No directional bias or trading recommendations are implied. Past performance is not indicative of future results. Trade at your own risk.
Invertedheadandshoulders

Equitas SFB (D): Strong Bullish Reversal (Turnaround Story)Timeframe: Daily | Scale: Linear
The stock has confirmed a major structural reversal, breaking out of a 4-month base (Inverted Head & Shoulders).
📈 1. The Chart Structure (Inverted H&S)
> The Pattern:
- Left Shoulder: Lows of ₹59.50 (May 2025).
- Head: The panic low of ₹50 (Sep 2025).
- Right Shoulder: The recent higher low at ₹57 (Dec 2025).
> The Neckline Breakout: The resistance at ₹64–₹65 was the "Line in the Sand." Today's close at ₹66.68 confirms the trend change.
- Significance: An Inverted H&S breakout after a 50% correction is a high-reliability "Trend Reversal" signal.
📊 2. Volume & Indicators
> Volume Spike: The 9.67 Million volume is an "Institutional Stamp." It confirms that big funds are accumulating at these valuations (Trading at ~1.3x Book Value).
> RSI: Rising in Daily & Weekly timeframes. The Daily RSI crossing 60 decisively indicates that momentum has shifted from "Bearish" to "Bullish."
🎯 3. Future Scenarios & Key Levels
The stock has entered a "Recovery Phase."
> 🐂 Bullish Targets (The Measurement):
- Target 1: ₹76.
- Target 2: ₹85.
> 🛡️ Support (The "Must Hold"):
- Immediate Support: ₹64 – ₹65 . The breakout zone must now act as a floor (Polarity Principle).
- Stop Loss: A close below ₹60 (Right Shoulder) would invalidate the pattern.
Conclusion
This is a Grade A Reversal Setup .
> Refinement: The combination of Fundamental Growth + Technical Reversal makes this highly convicting.

ICICIBANK - Inverted Head & Shoulder suggests 1450ICICI Bank has completed a clean Inverted Head and Shoulders pattern on the 4H chart, signalling a possible trend reversal after the recent downtrend. The left shoulder formed near 1360 , the head at 1317 , and the right shoulder at 1354 . All three points reflect stronger structure and consistent buying interest on dips. The stock has now crossed the neckline around 1387–1390 , a zone where it faced repeated rejection earlier. This breakout shows that buyers have finally taken control.
If the price continues to hold above the neckline, momentum is likely to push it toward the projected target of 1440–1450 , which matches the “final destination” zone shown on your chart. The breakout would lose strength only if the price falls back below 1387 , but unless that happens, the pattern suggests the move still has room to extend higher.

Tata Consumer Products Ltd – Inverted Head & Shoulders Breakout (Long-term Reversal Structure Forming)
Tata Consumer is currently attempting a breakout from a long-term neckline zone around ₹1,170–₹1,200 after forming a large Inverted Head & Shoulders pattern on the weekly timeframe.
The right shoulder has built a strong base above the 20W & 50W EMA, confirming renewed demand. Volume has gradually increased over the past weeks during the breakout attempt — a bullish sign.
A strong weekly close above ₹1,200 could activate the full pattern and open space toward the ₹1,400+ target zone.
🎯 Key Technical Levels
CMP: ₹1,183.10 (+0.78%)
Neckline (Breakout Zone): ₹1,170 – ₹1,200
Pattern Target: ₹1,390 – ₹1,420
Support Zone: ₹1,095 – ₹1,115
Stop-Loss: Below ₹1,090 (weekly close basis)
📈 Technical View
Large Inverted Head & Shoulders visible over a multi-month structure.
Right shoulder built cleanly above EMAs → uptrend strength.
Volume rise during recent candles suggests accumulation by big hands.
A breakout + weekly close above ₹1,200 would indicate strong continuation toward the target zone.
🧠 View
Tata Consumer is approaching a decisive weekly breakout. A sustained close above ₹1,200 could trigger the completion of the Inverted H&S pattern and invite a move toward ₹1,400+. Retests toward ₹1,150–₹1,170 may offer accumulation opportunities.

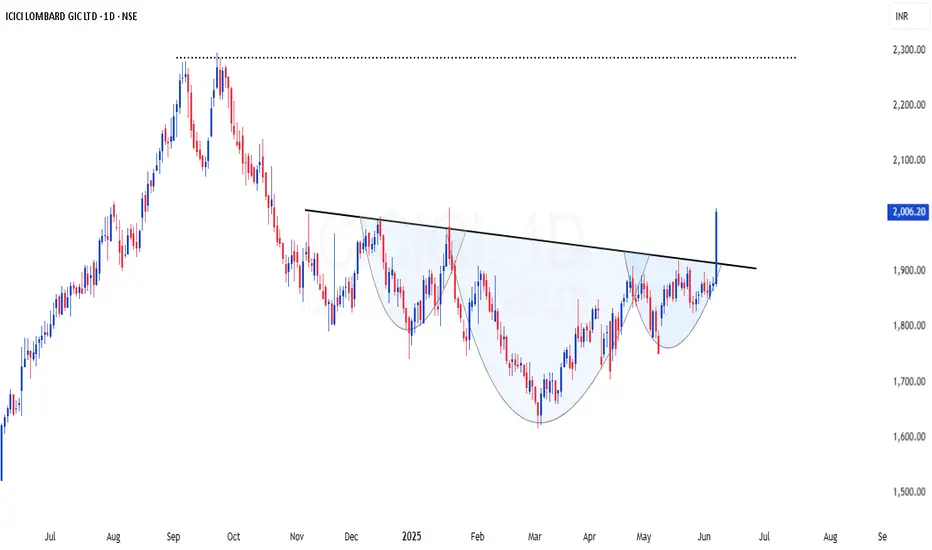
ICICIGI | High probable INHS setup - Looks good for 20-40%ICICIGI | High probable INHS setup - Looks good for 20-40%
CMP : 2006 (Dip : 1930)
SL : 1800
The stock has confirmed a classic inverted Head & Shoulders pattern on the daily chart, signaling a strong trend reversal.
✅ Breakout above neckline with decent volume, adding conviction to the move.
🎯 Immediate Target: 2300
🎯 Second Target (as per Fibonacci extension): 2700
📉 Pattern: Inverted H&S
📈 Volume: Supporting the breakout
📊 Bias: Bullish
This could be an excellent area of value for swing traders looking to ride the trend. A retest of the neckline could offer a second entry opportunity with a good risk-reward ratio.
Leela Palaces Hotels & Resorts Ltd – Inverted Head & ShouldersLeela Palaces has formed a clean Inverted Head & Shoulders pattern on the 75-minute timeframe, signalling a potential trend reversal after weeks of sideways movement.
Price has now broken above the neckline zone (~₹443–₹445) with a strong bullish candle, supported by improving volume — indicating buyers stepping back in.
A sustained move above the neckline could push the stock toward the measured target near ₹473–₹475, which aligns with previous swing supply.
🎯 Key Levels
CMP: ₹445.60 (+1.76%)
Neckline Zone: ₹443 – ₹445
Pattern Target: ₹472 – ₹475
Support Zone: ₹430 – ₹433
Stop-Loss: Below ₹430 (75-min close basis)
📈 Technical View
Clear Inverted H&S structure with shoulders at ₹428 & ₹435, and head at ~₹420.
EMA alignment turning positive (bullish slope developing).
Breakout candle above neckline confirms strength.
Volume improving during the breakout → added confirmation.
Immediate resistance now becomes support; a retest of ₹443–₹445 may offer opportunities.
🧠 View
Leela Palaces is breaking out of a well-formed Inverted Head & Shoulders pattern. If the price holds above the neckline, the stock may move towards the ₹473–₹475 zone. Watch for retest entries and volume continuation.

Ambuja Cements Ltd – Inverted Head & Shoulder Breakout in ProgreAmbuja Cements is displaying a classic Inverted Head & Shoulder pattern on the weekly timeframe, signaling a potential medium-term trend reversal. The neckline breakout zone around ₹560–₹580 is being tested again, and the price has shown a strong rebound from this area, confirming buyer strength.
The stock had earlier broken out of a falling wedge pattern, further strengthening the bullish bias. A sustained move above ₹580 with volume could confirm the breakout and pave the way for higher targets.
🎯 Key Levels:
CMP: ₹577.20 (+2.09%)
Pattern: Inverted Head & Shoulder + Falling Wedge
Neckline Zone: ₹560 – ₹580
Target-1: ₹630 – ₹640
Target-2: ₹690 – ₹710
Stop-Loss (Weekly Close): ₹540
📊 Technical View:
Price breaking out from a falling wedge after forming a reversal base.
EMA alignment turning positive – 20 EMA attempting to cross above 50 EMA.
Volume spikes seen near breakout areas indicate accumulation.
Sustaining above ₹580 may lead to a rally toward ₹640 and then ₹700+.
🧠 View:
Ambuja Cements shows early signs of a trend reversal backed by a strong chart structure. A weekly close above ₹580 would confirm the breakout, opening potential upside targets of ₹640 and ₹700 in the medium term.

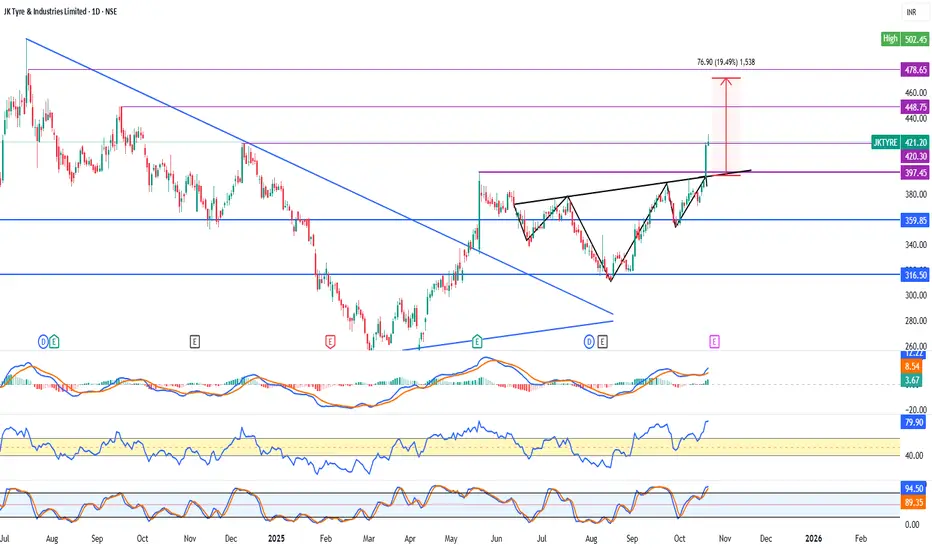
JkTyre Inverted Head & Shoulder PatternHi All…
Greetings!
Today I’m sharing with you JkTyre Daily Chart. Yesterday there has been a good break out in the stock. The stock has made a Inverted Head & Shoulder Pattern and has crossed its Neckline. I think it would a good time to invest in the stock. Hoping for the stock to reach the TGT’s of 420 448 478.
In the coming time I think it should give good returns.
Thanking You
Important Things
1. This is only for educational purposes only.
2. Never over trade.
3. Always keep Stop Loss.
4. Trade in limited quantity.
5. Taking a small loss is better than wiping up your whole capital.
I hope you found this idea helpful.
Please like and comment.
Share with Your Friends.
Keep Learning,
Happy & Safe Trading
Disclaimer – These ideas shared by me to all are my personal analysis / views. I'm not a SEBI registered technical analyst.
HEG Limited - Bullish Inverted H&S Breakout (Daily T/F)Trade Setup
📌 Stock: HEG Limited ( NSE:HEG )
📌 Trend: Strong Bullish Momentum
📌 Risk-Reward Ratio: 1:3 (Favorable)
🎯 Entry Zone: ₹531.00 (Breakout Confirmation)
🛑 Stop Loss: ₹514.00 (Daily Closing Basis) (-3 % Risk)
🎯 Target Levels:
₹540.30
₹550.10
₹561.30
₹571.00
₹ 581.60 (Final Target)
Technical Rationale
✅ Bullish Inverted H&S Breakout - Classic bullish pattern confirming uptrend continuation
✅ Strong Momentum - Daily RSI > 60, Weekly RSI >57 Monthly rsi > 57
✅ Volume Confirmation - Breakout volume 3.8M vs 20 day's volume MA is 961.k
✅ Multi-Timeframe Alignment - Daily and weekly charts showing strength
Key Observations
• The breakout comes with significantly higher volume, validating strength
• Well-defined pattern with clear price & volume breakout
• Conservative stop loss at recent swing low
Trade Management Strategy
• Consider partial profit booking at each target level
• Move stop loss to breakeven after Target 1 is achieved
• Trail stop loss to protect profits as price progresses
Disclaimer ⚠️
This analysis is strictly for educational purposes and should not be construed as financial advice. Trading in equities involves substantial risk of capital loss. Past performance is not indicative of future results. Always conduct your own research, consider your risk appetite, and consult a financial advisor before making any investment decisions. The author assumes no responsibility for any trading outcomes based on this information.
What do you think? Are you watching NSE:HEG for this breakout opportunity? Share your views in the comments!

Inverted Head and Shoulders - Tale of a Bullish Reversal Pattern> Chart presents a textbook Inverted Head and Shoulders pattern on the weekly timeframe—one of the most reliable bullish reversal formations in technical analysis. This sophisticated pattern structure demonstrates the gradual shift from bearish exhaustion to bullish momentum, offering astute traders a high-probability setup.
> Anatomical Breakdown of the Pattern
- Left Shoulder: Initial decline to approximately ₹280 levels, followed by a relief rally—representing the first phase of selling pressure exhaustion
- Head: The decisive low zone forming the deepest trough—marking the capitulation point where maximum bearish sentiment peaks
- Right Shoulder: Higher low formation, demonstrating diminishing selling pressure and emerging buying interest
- Neckline: The critical resistance zone connecting the intermediate highs—serving as the pattern's confirmation level
> The Right side chart showcase the Daily time frame movement forclear outlook on Multi time frame basis .
Disclaimer: Technical analysis provides probability-based insights. Always implement proper risk management and consider multiple timeframe confirmations before executing trades.
Hero MotoCorp – Inverted Head & Shoulders📈 Pattern Analysis: Between mid-December 2024 and July 2025, Hero MotoCorp developed a textbook Inverted Head and Shoulders Pattern , a strong bullish reversal setup after a steep 50% decline from the top . The bottom of the head was formed by a Hammer candlestick pattern , indicating a potential trend reversal with strong buying interest at lower levels.
📊 Breakout Confirmation:
In August 2025, the stock broke above the neckline with rising volumes, confirming the activation of the bullish pattern. Following the breakout, Hero MotoCorp delivered a sharp rally of more than 20% in just 20 trading days, validating the strength of the setup.
🔎 Key Observations:
* The multi-month consolidation built a strong base for the reversal.
* Volume expansion during breakout confirmed institutional participation.
* The price action aligns with classical bullish reversal theory.
🎯 Outlook:
While this event has already played out, the pattern serves as a clear example of how bullish head and shoulders formations can reverse strong downtrends and lead to swift gains once neckline breakout occurs.
⚠️ Disclaimer:
This case study is for educational and training purposes only. It is not an investment recommendation or trading advice.

Extended Inverted Head & Shoulders Structure in Price ActionThis chart features an extended inverted head and shoulders pattern, illustrating how these classic formations can significantly vary in length and shape across timeframes. The left and right shoulders frame a deeper head, while the neckline is not strictly horizontal but angled, reflecting real market dynamics. Observing these variations enhances one’s ability to identify patterns in imperfect conditions.
Key aspects include the evolving symmetry between the shoulders, the consistency of the head’s depth, and the interaction of price with the neckline angle. This post encourages traders to look beyond textbook structures and develop a refined eye for authentic technical setups, emphasizing pattern recognition without predicting price direction.
Disclaimer: This analysis is for educational purposes only and does not constitute investment advice. Always conduct your own research before making trading decisions.
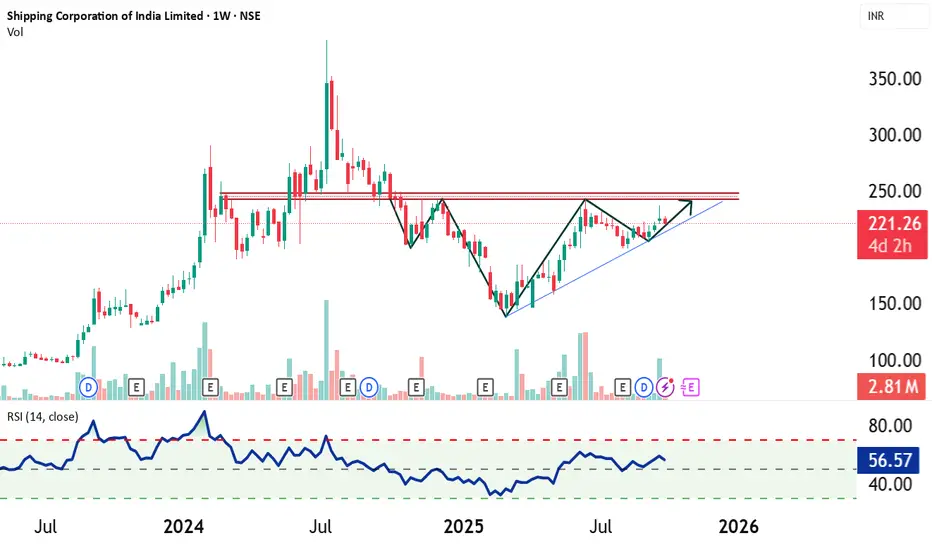
Shipping Corporation of India - Forming Bullish Head & Shoulder📈 Chart Analysis: On the weekly chart, Shipping Corporation of India (SCI) is showing signs of forming a "Bullish inverted head and shoulders pattern" , which is typically a reversal structure that signals the resumption of an uptrend. The neckline resistance is placed near ₹245–₹250 levels, and a decisive breakout above this zone could unlock strong upside momentum.
📊 Trend & Support: The stock is trading along an established uptrend line, which acts as a "Dynamic Support Level" . This trendline has been respected multiple times, reinforcing its validity. As long as the price sustains above this trendline, the bullish structure remains intact.
🔎 Momentum Indicators: RSI (Weekly) is currently around 56, showing neutral-to-positive momentum with room for further upside. Volumes have shown accumulation on upward moves, suggesting buying interest on rallies.
⚠️ Disclaimer:
This is a technical projection, not an investment recommendation. Any trading strategy should be established based on risk appetite, confirmation signals, and individual financial goals.
✍️ Prepared by: SEBI Certified Research Analyst (Not Registered)
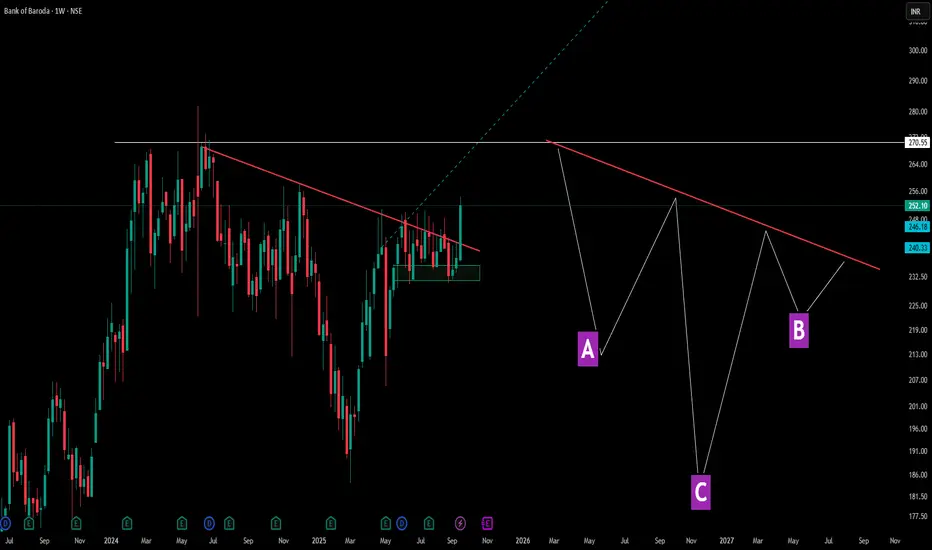
Decoding Angled Necklines in Inverted Head & ShouldersThis chart showcases a perfect example of how inverted head and shoulders patterns don't always follow textbook formations. Points A and B represent the shoulders, while C forms the deeper head—but notice the crucial difference: the neckline (red line) is tilted rather than horizontal.
Pattern Education Points:
- Traditional vs Reality: While many educational materials show horizontal necklines, real market patterns frequently display angled necklines, which are equally valid
-Shoulder Structure: The left shoulder (A) and right shoulder (B) don't need perfect symmetry—market patterns reflect actual supply and demand dynamics, not geometric precision
Market Structures:
- Before A, There was serious consolidation and then a Lower Low formation in the markets -> showcasing a dry volume dip and significant correction ( marking C ) as well as a result .
- Accompanied by a decent V shape recovery, tilted neckline is been touched again - showcasing market multi structure patterns are really important and there identification can lead to a decent trade idea
- later the next shoulder ( B ) gives solid consolidation but this time the dip is not solid unlike the normal Inverted HnS which makes the 2nd dip equal to the 1st shoulder dip here its a solid consolidation with small dip and a marubozu green candle after that .
Disclaimer: This content is for educational purposes and not financial advice. Always do your own research before making trading decisions.
LT Long IdeaLT looks good with Inverse Head & shoulder Pattern in making.
Targets are given and pattern Breakout candle low can be Stoploss.
NOTE: Risk management is Important.

Stock-wise Investigation: Breakouts or Support? ( MTF )Using 3-month-old chart data, this video explores how stocks tend to favor breakouts or support zones, with key technical terms to sharpen your pattern recognition skills—purely educational in nature.

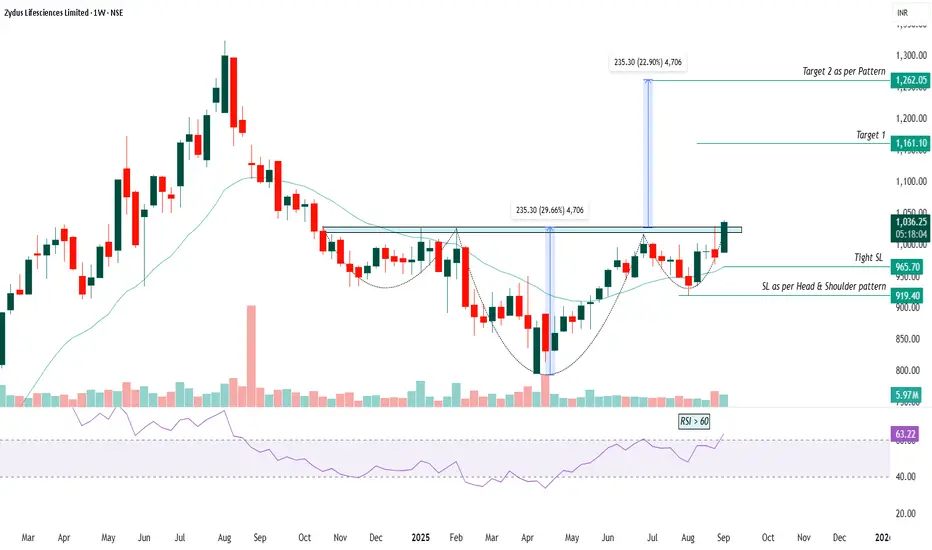
ZYDUSLIFE - Inverted Head and Shoulder's Pattern1. The chart shows Zydus Lifesciences Limited on a weekly timeframe with recent bullish momentum, closing at 1036.85 INR.
2. A clear inverse head and shoulders pattern is marked, indicating a possible trend reversal from downtrend to uptrend.
3. The neckline resistance has been broken, confirming the pattern and suggesting potential upside movement.
4. Two targets are marked as per the pattern, with Target 1 at 1161.10 INR and Target 2 at 1262.05 INR.
5. Potential stop-loss levels are specified: a "tight SL" near 965.70 and a traditional pattern-based SL at 919.40.
6. Volume and RSI indicators show increased buying strength, with RSI above 60 signifying bullish momentum.
7. The breakout height (235.30) is projected upwards from the neckline for target calculation.
Educational disclaimer: This analysis is for educational purposes only and does not constitute financial advice; always do independent research before making investment decisions
Multi-Confirmation Price Action: Fibonacci Zones, Base BreakoutsExplore multi-confirmation techniques using Fibonacci retracement to identify high-probability base breakout zones. Learn how to spot double bottom and inverted head & shoulders patterns at demand levels and execute confirmation trades for precision entries

Dixon Inverted HnSDixon Technologies is making a inverted Head n shoulder in the daily timeframe.
One can look for taking an entry at the retest of 17300-17320. Support can be considered at todays low. Keep a Check on the Chart and you will get to see how a head n shoulder is made.
Usually the Support for a HnS is right shoulder low so mid term traders can consider that level.
Follow for such more Analysis.
Jai Shree Ram.

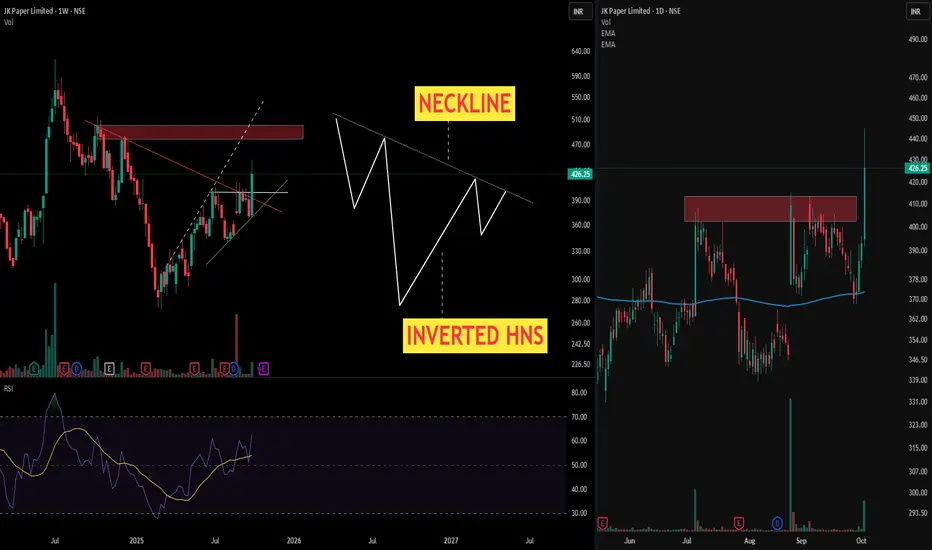
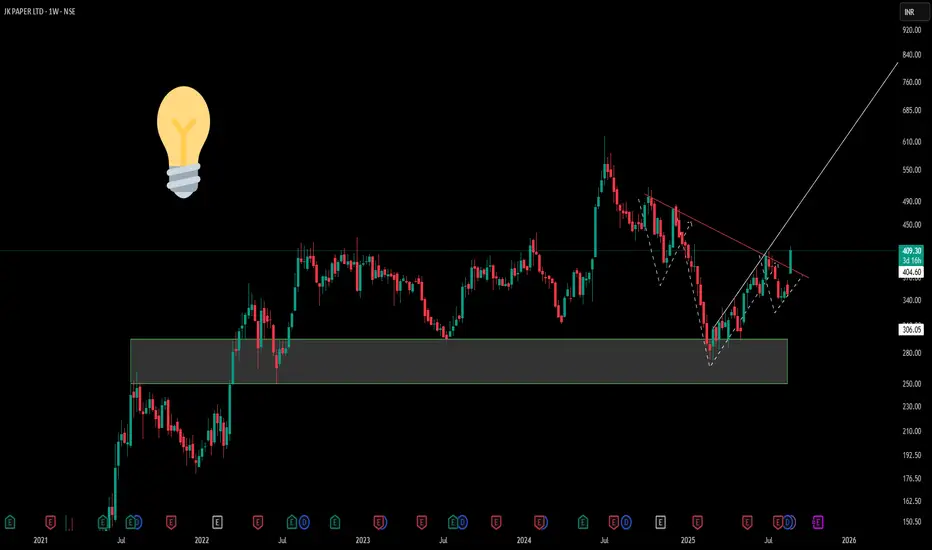
The Anatomy of Market Structure : JK PAPER1) Supply-Demand Conversion Zone Observation
The highlighted grey rectangular zone on the chart represents a critical supply-demand conversion area. This zone, spanning approximately the ₹280-₹320 range, has historically acted as a significant inflection point where institutional money flow patterns have shifted.
2) The Inverted Head and Shoulders Formation
Above this conversion zone sits a textbook inverted head and shoulders pattern, meticulously marked with dotted lines. This formation showcases three distinct troughs:
-Left Shoulder: Formed during the initial decline phase
-Head: The deepest trough representing maximum bearish sentiment
-Right Shoulder: A higher low indicating weakening selling pressure
3) The pattern's neckline resistance (depicted by the red counter-trend line) : Its true nature is to provide resistance as a downward sloping trend continues up until trend shifts, also know as Market structure shift .
Disclaimer: This analysis is purely educational and structural in nature. It does not constitute investment advice, trading recommendations, or buy/sell signals. Always conduct your own research and consult with qualified financial advisors before making investment decisions.
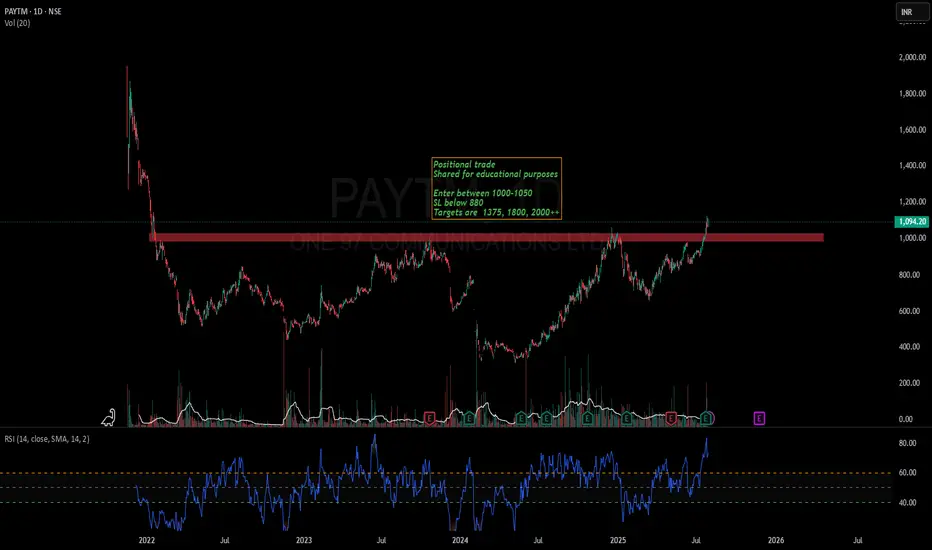
Paytm-A new ATH is coming soonPaytm has finally closed above its long term resistance of 1000.
Stock has potential to cross 2000 in near future
Keep stock in watchlist
Stock has also formed a kind of inverted head and shoulder pattern.
Not a recommendation. Watch and learn.
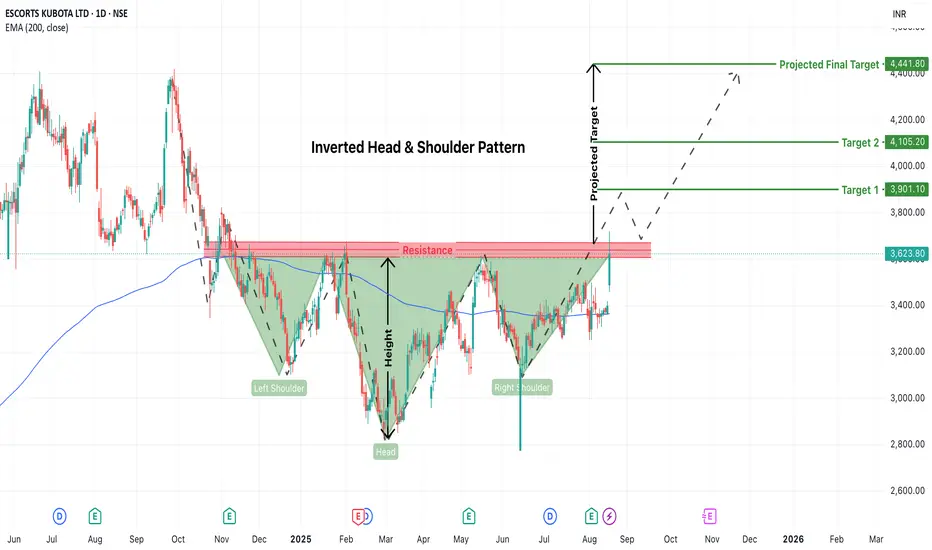
ESCORTS Potential Breakout Alert: Inverted Head & ShoulderThe chart of ESCORTS KUBOTA LTD (daily timeframe) is currently displaying a well-formed Inverted Head and Shoulder pattern, a powerful reversal setup often seen at the end of prolonged downtrends. This pattern suggests a shift in momentum from bearish to bullish—but the key breakout level still remains unconfirmed.
The left shoulder formed around November 2024, the head during March 2025, and the right shoulder recently shaped up through June and July 2025. The neckline resistance, drawn near the ₹3,580–₹3,620 zone, has been tested multiple times but has not yet been breached with conviction. A successful breakout above this resistance zone with strong volume would validate the pattern and signal a potential upside move.
At the moment, the price is hovering just around the neckline, attempting to build enough momentum to push through. This indicates a decision point—either the bulls gather strength to break out and push the stock higher, or the neckline acts as a ceiling, resulting in another round of consolidation or even a reversal.
Until confirmation, it remains a watchlist stock rather than an immediate entry.
CNXAUTOCNXAUTO index has given long term trend-line and Inverted H&S breakout after so long. We may see a rally up to 28000 which is approx 11-12% from current price. 22800 is very crucial support. Closing below this may change my view. Tax cut news might be leading the rally. Choose stock which are currently strong in this consolidation phase. Keep a closer watch on auto stocks.
