Lauruslabs-It can fly towards ATH again!Lauruslabs has given a good breakout of trendline and horizontal resistance with volume.
Stock is looking strong for a reversal and can fly towards ATH if market supports.
Keep in watchlist.
Invertedheadandshoulders

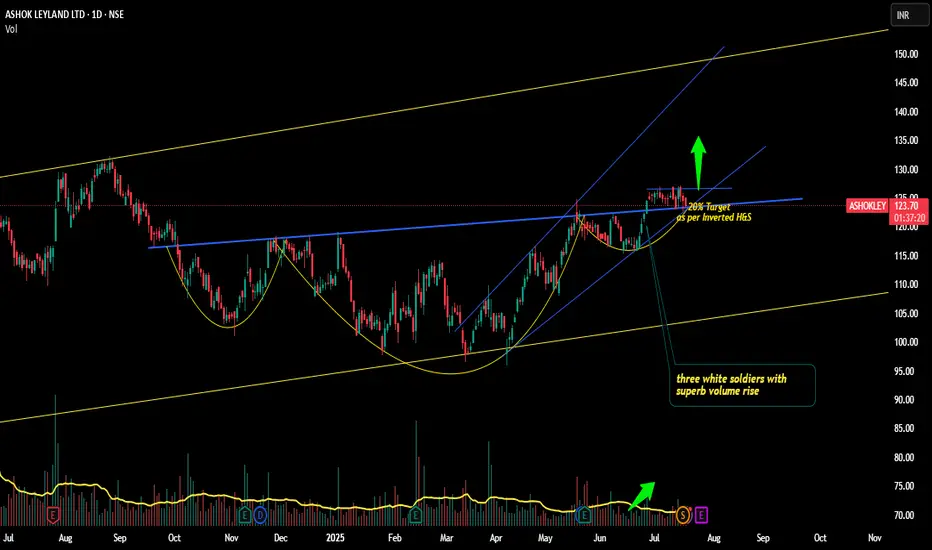
Ashokleyland Truck and Bus loaded with BULLS ?!!Yes!!!!
Chart patterns suggest me the above titled opinion of mine.
Reasons-
1. It's moving in a Ascending channel pattern from MARCH 2020 TILL NOW
2. 3 Upside candles(3 white soldiers) in monthly timeframe(shown below) with good rise in volumes
3. In weekly time frame, Bullish Marubozu candle Breakout seen with good volumes (shown below)
4. Coming to daily time frame, Inverted h&s pattern looks visible and Breakout has happened and now retesting.(there also 3 white soldiers visible)
5. As per pattern , target is about 20% from current levels.(soon to 150 level. )
6. We can enter now with sl as daily close below 120.4, targets -130,138,144 levels
Ashokleyland looks way good for the long term investment (buy and forget) too!! !
This is just my opinion...not a tip nor advice!!!!
Happy trading!!!!
Thank you!!!!
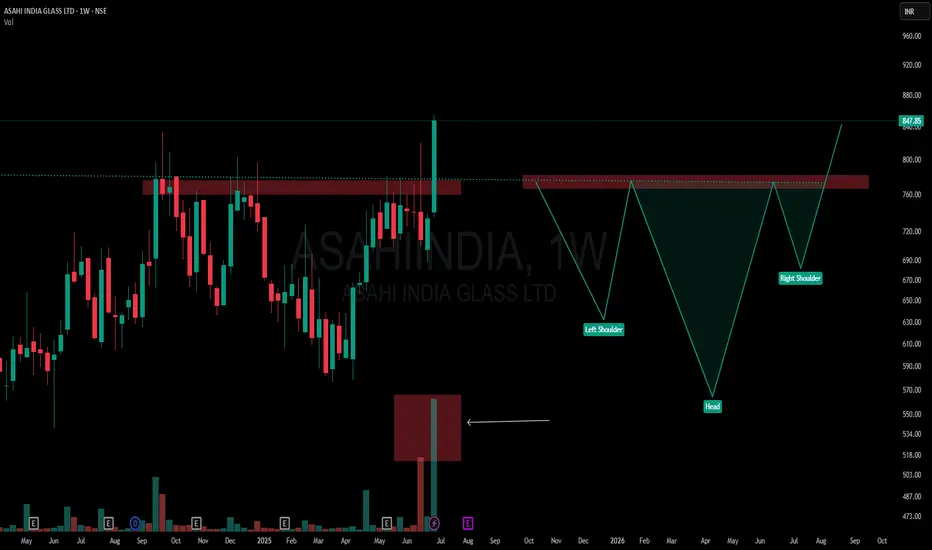
When Textbook Meets Extremes: Perfect Inverted Head and Shoulder📌 ASAHI INDIA GLASS | Weekly Timeframe
🧩 Pattern Breakdown (from a textbook lens):
-Left Shoulder: Formed after the Sept–Nov 2024 rejection
-Head: Created around Feb–May 2025 with a deeper dip
-Right Shoulder: Built through June 2025
-Neckline: ₹750–₹760 zone, tested multiple times
-Breakout Candle: High conviction — wide-bodied, strong close, with 17.61M volume
📘 According to classical technical analysis, Inverted Head & Shoulders patterns often signal a trend reversal. What's notable here is the context — the structure has developed after a sustained move upward, not from a bear phase.
🎯 The candle breaks above a long-standing supply zone with size, volume, and conviction — yet its location at the top makes it structurally interesting and unusual when viewed through traditional pattern psychology.
🚫 This is not a tip, call, or directional bias — just a visual log of structure and volume behavior.
💬 Chart interpretations welcome in comments.
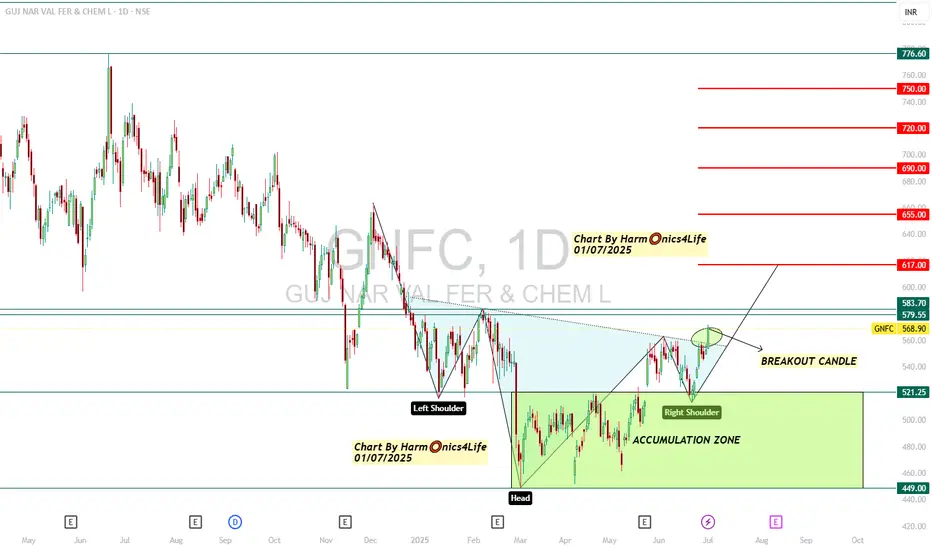
GNFC INVERTED HEAD AND SHOULDER BREAKOUT !NSE:GNFC (Gujarat Narmada Valley Fertilizers & Chemicals)
LTP 568.9
Inverted Head & Shoulder breakout on chart !
Buy here and accumulate in zone of 520---450
For Target🎯 617 / 625 / 655++
#Positional Target🎯 690 / 720 / 750++
==============================================
Positional Breakout chart
===============================================
Technical Setup:
1) More than 30% down from recent highs of 815 levels
2) Inverted Head & Shoulder breakout on chart
3) Came out of a tight consolidation range
4) Available at cheap valuations
5) Indication of Bottoming Out with High Volumes !!!
===============================================
Regards,
Harm⭕️nics4Life
01/07/2025
===============================================
Disclaimer & Risk Warning
I am not sebi registered analyst.
My studies shared here are for educational purposes .. Do Consult Your Financial advisor Before Taking any Trade.....Good Luck!
TEXRAIL: Breakout FocusTEXRAIL has recently exhibited a notable technical development on the daily chart. On Friday, 16 May , the stock completed a breakout from an inverted head and shoulders pattern, a formation often associated with potential trend reversals. The breakout occurred with a decisive close above the neckline, which had previously acted as a key level of resistance and had been tested multiple times, reinforcing its technical significance.
Following the breakout, the price action has respected the neckline as a new support level, with multiple successful retests and rebounds observed. As of today’s session, TEXRAIL has once again rebounded from a brief consolidation phase, accompanied by a substantial increase in trading volume—approximately 18M shares , significantly above its recent average. This surge in volume may indicate renewed interest and participation from market participants.
Momentum indicators are also aligning with the bullish structure. The Relative Strength Index (RSI) is currently approaching the 70 level , suggesting strong upward momentum, though it is nearing overbought territory. Additionally, the MACD histogram is showing signs of potential short-term consolidation or profit-taking, particularly as the price approaches a previously identified supply zone.
Looking ahead, the chart outlines three potential resistance levels that may act as intermediate targets or areas of interest for traders monitoring the trend. These levels are derived from historical price action and volume profile analysis.
📊 Please refer to the accompanying chart for a visual breakdown of the pattern, volume dynamics, and resistance zones.
Disclaimer:
The information provided in this analysis is intended solely for educational and informational purposes. It does not constitute investment advice, a recommendation, or an offer to buy or sell any securities. Always conduct your own research or consult with a qualified financial advisor before making any investment decisions.

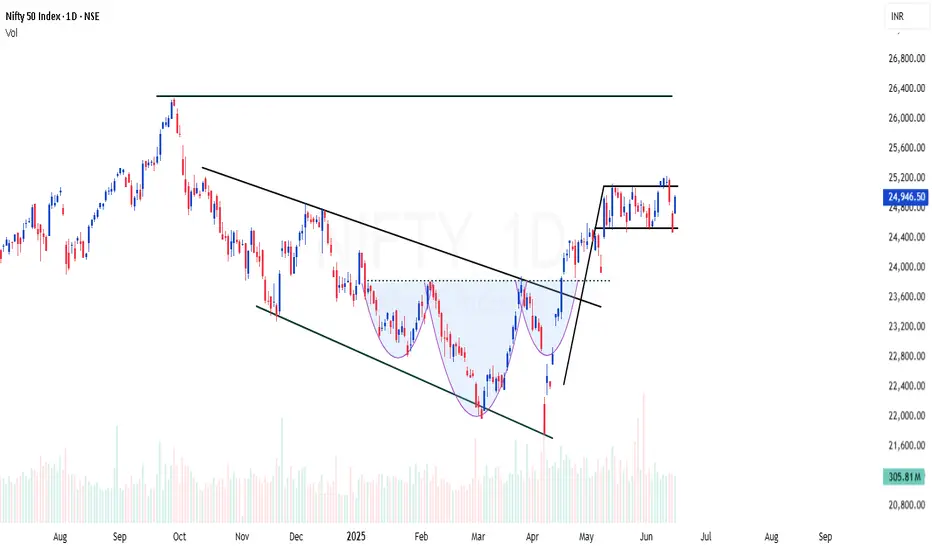
NIFTY | Back to back bullish patternsNIFTY showing back to back bullish signs
Channel breakout - Done
Inverted Head & Shoulder breakout (INHS) - Done
Now forming flag setup
NIFTY shows strength to move another 15% this year
Wockhardt-Bad fundamentals, Strong technicals!Wockhardt is an age old Indian pharma company which has been in loss since few years.
Stock has bounced from strong support and also gave inverted head & shoulders breakout.
Stock is consolidating post breakout.Not my usual technofunda pick but a very attractive technical breakout. Please know that risk is more with such ideas.

MAXHEALTH | Inverted Head and Shoulder | Breakout | ATH
## 🩺 **MAXHEALTH – Inverted Head and Shoulder Breakout Analysis**
### 📊 **Pattern**:
✅ **Inverted Head and Shoulder** formation confirmed
* Base support near: ₹936
* Breakout zone: ₹1,200
* Current price: ₹1,232.80
* **Volume spike** on breakout = bullish confirmation
---
### 📐 **Breakout Target Calculation**
* Depth of Cup: **₹255.20**
* Target = ₹1,200 + ₹255.20 = **₹1,455.20**
📌 **Target Area marked** on chart near ₹1,455
---
### 🔍 **Key Technical Insights**
* **Resistance turned support**: ₹1,200 zone
* Strong **volume breakout** above resistance
* Handle was short & tight, indicating bullish strength
* RSI likely above 60 (momentum favoring bulls – though not shown here)
---
### 🎯 **Levels to Watch**
* **Support**: ₹1,200 (neckline), then ₹1,120
* **Resistance**: ₹1,300 minor, **₹1,455** is the measured move target
---
### 📈 **Bias**: **Bullish**
* Price + Volume + Pattern = Valid **Breakout**
* Position traders can aim for **₹1,455** with SL ₹1,200
---

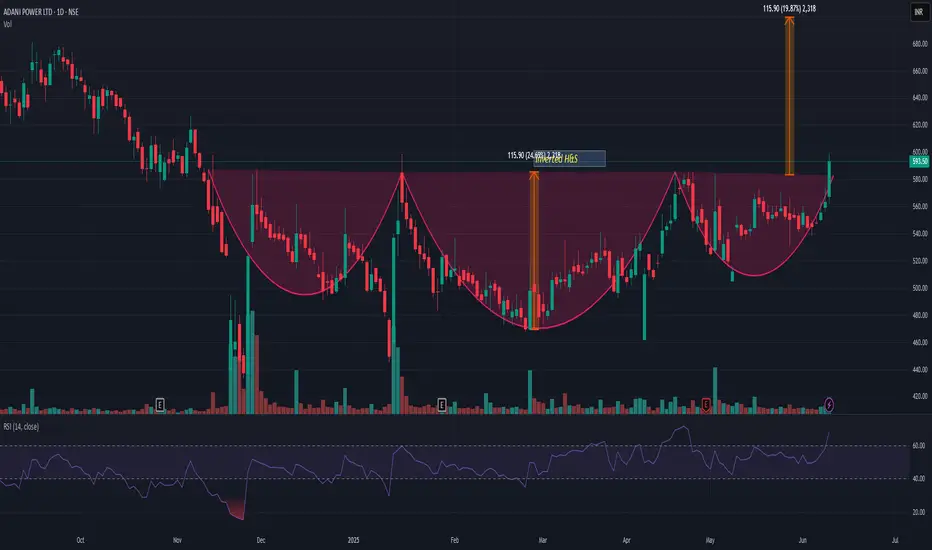
ADANIPOWERADANIPOWER has given inverted H&S breakout with very good volume. All ADANI stocks showing a strength. If we look at the pattern then it may add more 18-20% from here. My view may change we it closes below 540.
BANKINDIABANKINDIA is currently trading above resistance breakout and also recently has shown Inverted H&S breakout as well. Volume in recent session has been increased. If we check pattern target then it has a potential to go up to 160-70 level. I may change my view if it closes below 120. In recent time I have observed traction in all PSU banking stock. Is it something that we don't know!! Chart is indicating something to be watched very closely. Keep it on radar.

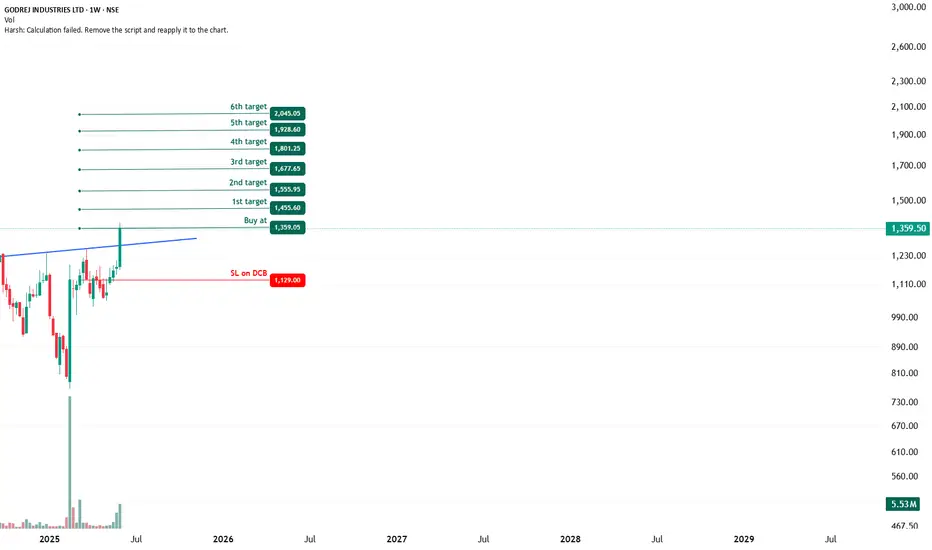
GODREJ INDUSTRIES - Bullish Inverted H&S Breakout (Daily T/F)Trade Setup
📌 Stock: GODREJ INDUSTRIES ( NSE:GODREJIND )
📌 Trend: Strong Bullish Momentum
📌 Risk-Reward Ratio: 1:3 (Favorable)
🎯 Entry Zone: ₹1359.05(Breakout Confirmation)
🛑 Stop Loss: ₹1129.00(Daily Closing Basis) (~5.6% Risk)
🎯 Target Levels:
₹1455.60
₹1555.95
₹1677.65
₹1801.25
₹1928.60
₹2045.05 (Final Target)
Technical Rationale
✅ Bullish Inverted Head & Shoulder Breakout - Classic bullish pattern confirming uptrend continuation
✅ Strong Momentum - Daily, Weekly & Monthly RSI >60 (Bullish Zone)
✅ Volume Confirmation - Breakout volume 5.53M(while posting) vs previous day's 3.46M (Nearly 1.8x surge )
✅ Multi-Timeframe Alignment - Daily, Weekly and €Monthly charts showing strength
Key Observations
• The breakout comes with significantly higher volume, validating strength
• Well-defined pattern with clear price & volume breakout
• Conservative stop loss at recent swing low
Trade Management Strategy
• Consider partial profit booking at each target level
• Move stop loss to breakeven after Target 1 is achieved
• Trail stop loss to protect profits as price progresses
Disclaimer ⚠️
This analysis is strictly for educational purposes and should not be construed as financial advice. Trading in equities involves substantial risk of capital loss. Past performance is not indicative of future results. Always conduct your own research, consider your risk appetite, and consult a financial advisor before making any investment decisions. The author assumes no responsibility for any trading outcomes based on this information.
What do you think? Are you watching NSE:GODREJIND for this breakout opportunity? Share your views in the comments!
Inverted Head & Shoulders Breakout | VIKAS LIFESCIENCES🟡 Structure Breakdown:
Left Shoulder: A lower low, continuing the bearish trend.
Head: A deeper low marking the climax of selling.
Right Shoulder: A higher low—a pivotal sign of accumulation and shifting sentiment.
✅ Supply-Demand Flip Zone Cleared:
Price has convincingly closed above the green zone, which acted as both prior supply and recent demand—now serving as a supportive launchpad.
✅ Counter-Trendline (CT) Breakout:
A clean breakout of the white counter-trendline confirms the structural reversal. This breakout is not only technical—it’s also volume-backed with ~24M shares traded, reinforcing conviction.
✅ Volume Confirmation:
Breakout accompanied by surging volume—an essential ingredient for validating any bullish setup. Indicates institutional activity or broader market participation.

CHOLAFIN: Potential for 15-20% Upside AheadThe chart of CHOLAFIN provides delineates critical price thresholds that signify breakout points, along with specific support levels that serve as indicators of where buying interest may manifest.
Additionally, the chart highlights regions likely to act as ceiling points for future price ascensions, allowing for informed decisions on entry and exit strategies.
Disclaimer: The information contained in this technical analysis report is intended solely for informational and educational purposes. It should not be interpreted as financial advice or a recommendation to buy or sell any security. Investors are strongly encouraged to conduct their own research and consult with a qualified financial advisor before making any investment decisions.

Banknifty 2025-2026 (Expected level)Banknifty. (Only for Experienced traders" )
Enter after " Breakout and Retracement ".
Leave a " Like If you agree ".✌.
Follow for regular updates 👍
.
For " long "
entry: 56000 / 56500
target: 60000- 62350
stoploss: 54800
Enter only if market Breaks
"Yellow box" mentioned.
.
.
For " Short"
entry: 54000
target:51000- 49500
stoploss: 54600
Enter only if market Breaks
"Yellow box" mentioned.
.
Wait for proper reversal and conformation.
.
Don't make complicated trade set-up.📈📉
Keep it " Simple, Focus on Consistency "💹.
Refer our old ideas for accuracy rate🧑💻.
Valuable comments are welcomed-✌️
.
.
Disclaimer:
Our Trading style is not to capture "10-20" points per trade.📊
We take entry only for min "200-300" points without any distractions.💹
So, our ideas may not be preferable for small traders, who just focusing on too much of support and resistance.📈📉📈
So, please consider others ideas.
This is for educational purposes.🧑💻

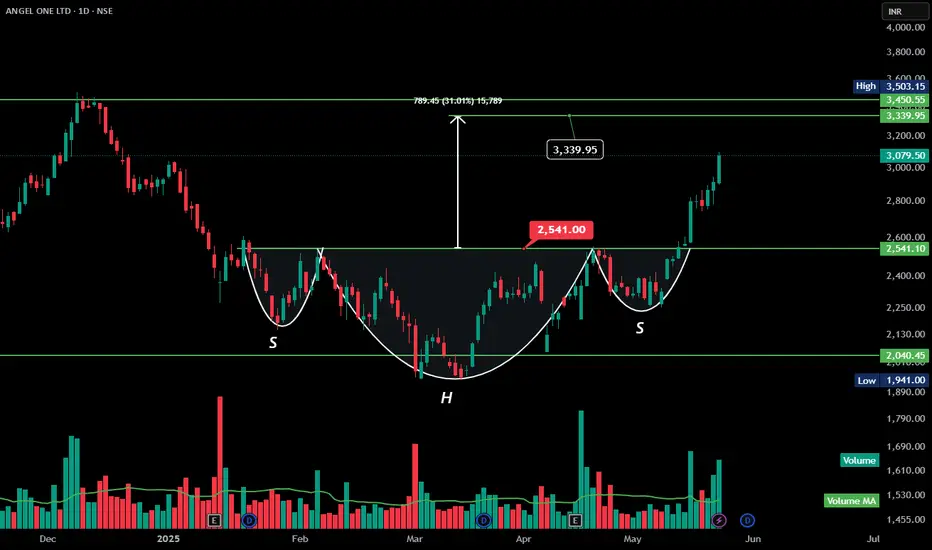
ANGELONE | Inverse Head & Shoulders Breakout | Target ₹3,339+Here's the **technical analysis** for ANGEL ONE LTD based on the chart you provided:
---
### 🔍 **Technical Analysis – ANGEL ONE LTD (NSE)**
**Pattern Identified:** Inverse Head and Shoulders
**Breakout Level (Neckline):** ₹2,541
**Target:** ₹3,339.95
**Current Price:** ₹3,079.50
**Gain from Breakout:** 31%
---
### ✅ **Bullish Indicators:**
* **Inverse Head & Shoulders Pattern:** A classic bullish reversal pattern indicating potential trend reversal from downtrend to uptrend.
* **Breakout with Strong Volume:** The breakout above the neckline (₹2,541) is accompanied by a significant surge in volume, adding strength to the move.
* **Measured Target:** The height of the pattern (approx. ₹789) added to the neckline gives a potential upside target of ₹3,339.95.
* **Momentum:** Strong bullish momentum post-breakout, with consecutive green candles and higher highs.
---
### ⚠️ **Key Levels to Watch:**
* **Immediate Resistance:** ₹3,339.95 (target zone)
* **Major Resistance:** ₹3,450.55 (previous swing high)
* **Support Zone:** ₹2,541 (neckline retest), ₹2,040 (previous support level)
---
### 📌 **Conclusion:**
ANGEL ONE has confirmed an inverse head and shoulders breakout with strong volume, suggesting a bullish trend continuation toward ₹3,339+. A retest of the neckline around ₹2,541 could offer a good risk-reward entry if the bullish momentum sustains.
---
UNIONBANKUNIONBANK has given inverted H&S breakout with decent volume. Last quarter result also beat estimates. So there is fundamental support as well. And in recent days we have seen strong momentum in PSU banks. So UNIONBANK has a potential give very good return provided that it closes above 130 in coming days.

Grasim - Inverted Head and Shoulder Breakout Grasim, posted strong numbers !
A nice Inverted H&S pattern breakout done.
Buy @ 2825-2800
SL 2630
Target : 3250++
RSI is above 60+
MACD is Positive and giving a cross over
along with DMI showing Strength
Stocks looks super strong!

Trend Reversal setup in HCLTECH(Inverted H&S Pattern)!HCL Technologies (NSE:HCLTECH) – Bullish Reversal Setup
📌 Pattern Identified: A clear Inverted Head and Shoulders formation is visible on the daily chart, indicating a potential bullish reversal.
✅ Key Observations:
Price has broken above the neckline and also crossed the 50-period EMA, showing strength.
Notable volume buildup at the right shoulder, supporting the bullish move.
RSI is above 60, suggesting improving momentum.
📈 Projected Target: ~₹2,074 based on the pattern's height.
🔻 Stop Loss: Placed slightly below the right shoulder near ₹1,537.
⚠️ Watch Levels:
₹1,696: Minor resistance.
₹1,780: Key resistance level before the target zone.
📝 Conclusion: A breakout above the neckline with volume confirms the bullish pattern. As long as the price sustains above the stop loss, the risk-reward appears favorable.
Disclaimer: Consider my analysis for educational purposes only.
Before entering any trade:
1️⃣ Educate Yourself – Understand market dynamics and technical patterns.
2️⃣ Do Your Own Research & Analysis – Never rely solely on external opinions.
3️⃣ Define Your Risk-Reward Ratio – Ensure your trade aligns with your risk appetite.
4️⃣ Never Trade with Full Capital – Always manage risk and preserve capital.
Trade wisely! ✅📊

YESBANK - Daily -Breakout with volumes -Inverted HnSThis is a daily chart for YES BANK LTD (YESBANK) as of May 9th, 2025.
Here's a technical analysis of the chart:
Falling Wedge Pattern:
The stock was in a clear downtrend, forming a falling wedge pattern from approximately February 2024 to early 2025. A falling wedge is often a bullish reversal pattern when it occurs after a downtrend.
The price broke out from the upper trendline of this falling wedge around January/February 2025.
Inverted Head and Shoulders Pattern:
Following the breakout from the falling wedge, an inverted head and shoulders pattern appears to have formed. This is also a bullish reversal pattern.
Left Shoulder: Formed around February 2025.
Head: The lowest point, formed around late February/early March 2025.
Right Shoulder: Formed around April/early May 2025.
Neckline: The neckline of this pattern is approximately at the 19.41. The price is currently testing and attempting to break out above this neckline.
Volume:
There's a noticeable increase in volume on the recent candles as the price challenges the neckline of the inverted head and shoulders pattern. This is a positive sign and can add conviction to a potential breakout.
Support and Resistance:
Immediate Resistance: The neckline area of 19.41 - 20.02 is the critical immediate resistance. A decisive close above this level is needed to confirm the breakout.
Next Resistance/Target: The chart indicates a potential target of 22.73 based on the height of the inverted head and shoulders pattern (approximately 3.33 points) projected upwards from the neckline.
Support:
The lows of the right shoulder (around 17.50-18.00) would act as initial support.
The low of the head (around 16.02) is a more significant support level.
The upper trendline of the previous falling wedge could also offer support if retested.
Interpretation:
The chart for Yes Bank shows multiple bullish reversal signals.
The breakout from the long-term falling wedge was the first sign of a potential trend change.
The formation of the inverted head and shoulders pattern further strengthens the bullish case.
The stock is currently at a crucial juncture, attempting to break out above the neckline of the inverted head and shoulders. The increased volume is supportive of this attempt.
A sustained close above ~20.02 would confirm the breakout and suggest a potential move towards the target of 22.73.
Failure to break out or a rejection from the neckline could lead to a retest of lower support levels.
Disclaimer: This technical analysis is for educational purposes only and should not be considered financial advice. Always conduct your own thorough research and consult with a qualified financial advisor before making any investment decisions

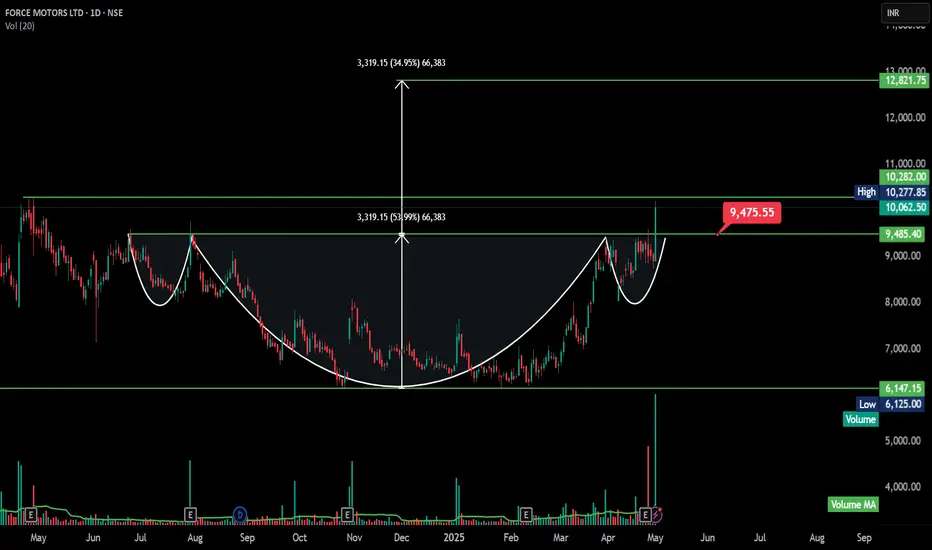
FORCEMOT - Inverted Head and Shoulder - BreakoutThe chart technical analysis of Force Motors Ltd (NSE)**, showing a **cup and handle breakout pattern**—a bullish continuation formation. Here's a breakdown of the key insights:
---
# Pattern: Inverted Head and Shoulders (Bullish Reversal)
Left Shoulder: Formed around July–August 2023.
Head: Formed in December 2023, with a deeper low.
Right Shoulder: Formed in April 2025, with a higher low.
Neckline: Drawn across the resistance zone around ₹9,475.55 — now broken.
💥 Breakout Confirmation
Price has broken above the neckline at ₹9,475.55, closing at ₹10,062.50 with a strong 12.88% gain and high volume, confirming the bullish breakout.
📊 Measured Move Target
Height (Head to Neckline) ≈ ₹3,319.15
Breakout Target = ₹9,475.55 + ₹3,319.15 = ₹12,821.75
→ This matches the projection shown on the chart (~35% upside from breakout)
🔍 Volume Analysis
Breakout is accompanied by a large volume spike (~810K vs avg), which is critical for validating an inverted head & shoulders breakout.
📏 Key Technical Levels
Breakout Point / Neckline: ₹9,475.55 (Now Support)
Resistance: ₹10,277.85 (intraday high on breakout day)
Target: ₹12,821.75
Stop-loss: Below ₹9,475 (e.g., ₹9,200–9,300 zone), depending on risk tolerance
🧭 Strategic Takeaway
This breakout from an inverted H&S pattern suggests a bullish trend reversal after a prolonged downtrend, and the volume confirmation adds strength to the setup.
Garden Reach Shipbuilders (GRSE) Bullish Inv HnS BO with volumeThanks for sharing the chart of **Garden Reach Shipbuilders (GRSE)**.
Strong **bullish setup** supported by two technical patterns:
1. **Falling Wedge Pattern (Breakout)** – A classic bullish reversal pattern, and it has broken out with strong volume.
2. **Inverted Head and Shoulders** – Another bullish reversal formation that also broke out around ₹1,730–₹1,750 zone, confirmed with high volume.
### Key Highlights:
- **Breakout Confirmation**: Price closed at ₹1,957.80, up **+11.90%**, with strong volume (17.64M).
- **Targets**: Based on pattern projections, potential target zones are:
- ₹2,354.10 (Inverted H&S breakout)
- ₹2,833.80 (Falling wedge pattern breakout)
- **Support Zone**: ₹1,730 acts as a strong support now (previous resistance).
This confluence of two bullish patterns with a volume spike significantly increases the probability of continued upward momentum.

Mangalore chemical:(Ready to shoot up); Take a look; Min 50% RoiHuge potential is there.
For short term investment ;
Leave a " Like If you agree ". 👍
.
.
Wait for Breakout & then Daily candle to close above - "135"
.
If you want to enter now "Go for it with stoploss".
.
.
Enter after Price Breaks
"Yellow box" mentioned.
.
Don't make complicated trade set-up.📈📉
Keep it " simple, focus on consistency " 💹
Refer our old ideas for accuracy rate🧑💻
Valuable comments are welcomed-✌️
.
Follow for regular updates.👍

(NSE:SUNPHARMA) Inverted H&S Breakout Eyes New ATH Chart Analysis:
Sun Pharma has formed a textbook Inverted Head & Shoulders (H&S) pattern on the daily timeframe, signaling a strong bullish reversal. The pattern completed with a clean breakout above the neckline at ₹1,820 , accompanied by a surge in trading volume (highest in 2 weeks). This validates buyer conviction and sets the stage for a sustained upward move.
Key Levels:
Neckline: ₹1,820
Resistance Targets:
Target 1: ₹1,910
Target 2: ₹1,960 (All-Time High, ATH)
Support Zone:1,750
Trade Setup:
Entry Zone: ₹1,820–1,835 (post-breakout retest opportunity)
Stop Loss: ₹1,750 (below the right shoulder to avoid false breaks)
Why This Works?
✅ Pure Price Action Focus: The analysis relies solely on pattern structure, volume, and key levels—no indicators cluttering the chart.
✅ Volume Confirmation: Breakout supported by above average volume, reinforcing bullish momentum.
✅ Pattern Perfection: Classic Inverted H&S structure with well-defined neckline and symmetry.
✅ Breakout Conviction: Price closed decisively above ₹1,820, indicating strong follow-through.
For Indicator Users:
Traders who incorporate tools like RSI or Moving Averages can cross-verify this setup with their preferred strategies. For instance, the breakout aligns with bullish momentum on higher timeframes.
Risk Management:
Trail stops to lock profits as price approaches ₹1,910.
Partial profit booking at ₹1,910 (T1) recommended.
Conclusion:
Sun Pharma’s breakout above ₹1,820 opens the door for a rally toward its ATH. Pure price action traders can leverage the clean setup, while others may combine it with their preferred indicators. Focus on the neckline (₹1,820–1,835) for potential entries, and maintain strict risk management.
*This analysis is for educational purposes only and does not constitute financial advice, investment recommendation, or an offer to buy/sell securities. Trading involves substantial risk of loss, and past performance is not indicative of future results.
