TRENT : When price corrects, smart money observes — not panics.NSE:TRENT
Technical View (Monthly)
Long-term trend bullish, currently in a healthy correction
0.618 Fibonacci support: ₹3,900–4,100 → key demand zone
Resistance: ₹4,900–5,000 (must cross for fresh uptrend)
Trend damage only if: Monthly close below ₹3,800
Expect sideways consolidation before the next big move
Fundamental View
Strong retail brands, aggressive store expansion
Earnings growth is strong, but the valuation was stretched
Current correction = valuation & time adjustment, not business issue
Future Growth Outlook
Positive long-term drivers: consumption growth + scale benefits
Near-term returns may stay muted; 3–5 year story intact
Actionable Summary
Investors: Accumulate near ₹4,000 with patience
Traders: Bullish only above ₹5,000
Risk: Breakdown below ₹3,800
Verdict: High-quality stock in correction phase, not a trend reversal.
==============
⚠️ Disclaimer:
==============
This content is shared strictly for educational and informational purposes.
We are not SEBI-registered investment advisors or analysts.
The views expressed are personal opinions, based on publicly available data and market observations.
Please consult a SEBI-registered investment advisor before taking any investment or trading decisions.
Any actions taken based on this content are entirely at your own risk and responsibility.
========================
Trade Secrets By Pratik
========================
Investing

ScannerCheck21-Dec-25List of the stocks coming up on my scanner - ITI, StarHealth, National Aluminium, MRF. Check out their positions now and have your own judicious call. Keep an eye for a decent entry.

Nifty Defence: Watch for Breakout or Pullback📈 Uptrend still intact but price is consolidating near highs.
📊 Testing key trendline support—will it hold or break? 🤔
🔺 Resistance: 7,634 | 8,135-8,302 | 8,870-9,195
🔻 Support: 7,369 | 6,347-6,707 | 5,025-5,132
🔝 Breakout to 9,195? Or pullback to 6,347? Eyes on the trendline! 👀
#NiftyDefence #IndexAnalysis #Trendline #BreakoutOrBreakdown #Investing #ChartAnalysis #PriceAction
📌 #Disclaimer: This analysis is shared for educational purposes only. It is not a buy/sell recommendation. Please do your own research before making any trading decisions.

Emotions vs Logic – Behavioral Finance Explained Simply!Hello Traders!
Every chart you see, every candle formation, and every market move is ultimately a reflection of human behavior.
Markets rise when emotions rise… and they fall when emotions collapse.
Understanding the battle between emotion and logic is one of the most important skills a trader can learn, because this battle is happening inside your mind every single day.
1. What Is Behavioral Finance?
Behavioral finance studies how human emotions influence financial decisions.
It explains why people buy high, sell low, panic too early, and hold losses for too long.
It also explains why logic disappears the moment money is involved.
In simple words:
Behavioral finance tells you why traders do what they shouldn’t do.
2. Emotions That Impact Your Trades
Fear: Makes you exit early or avoid good trades.
Greed: Makes you overtrade and increase position sizes.
Hope: Makes you hold losing trades longer than you should.
Regret: Makes you chase missed entries and force bad setups.
These emotions don’t just influence decisions, they completely override logic when not controlled.
3. Why Logic Fails in Real Time Trading
You may know the strategy, but your instinct takes over the moment money is at risk.
Your brain reacts to losses the same way it reacts to physical pain.
Overconfidence after wins leads to careless decisions.
Fear after losses leads to hesitation and self-doubt.
The market is logical.
Your mind is not, unless trained.
4. How Logic Actually Helps You Trade Better
Logic keeps your risk fixed and predictable.
Logic follows a plan even when emotions are screaming the opposite.
Logic doesn’t chase candles or revenge-trade.
Logic helps you treat trading as a process, not a lottery.
Logic doesn’t eliminate emotions, it protects you from acting on them.
5. Simple Ways to Shift From Emotional to Logical Trading
Use a predefined plan for entries, exits, and stop losses.
Risk a fixed percentage every trade to avoid panic.
Take fewer, high-quality trades instead of reacting to every move.
Keep a journal to track emotional decisions and patterns.
Consistency grows when emotional impulse decreases.
Rahul’s Tip:
You don’t need to remove emotions, you just need to stop letting them press the buttons.
Once you learn to pause, breathe, and follow your plan, logic automatically becomes stronger than impulse.
Conclusion:
The market doesn’t reward intelligence, it rewards emotional control.
Every trader knows what they should do, but only disciplined traders actually do it.
Master your emotions first, and the charts will start making sense like never before.
If this post helped you understand the emotional side of trading, like it, share your thoughts, and follow for more deep psychology insights!

#UNIVPHOTO: Reversal Alert at Falling Channel Midline!CMP: 286
UnivPhoto found support ✅ & bounced strongly off the mid-line of the falling channel (245–266 zone), forming a textbook Morning Star on the weekly chart — a classic bullish reversal! ⭐️🔥
Now testing key resistance 310–337 + downtrend line. A breakout could fuel a rally to 484 → 747/818 → 988 (ATH) 🚀🚀
Could this be the end of the multi-year downtrend? Watch closely! 👀✨
#UNIVPHOTO #MorningStar #CandleStickPattern #PriceAction #LongTerm #Investing
📌 #Disclaimer: This analysis is shared for educational purposes only. It is not a buy/sell recommendation. Please do your own research before making any trading decisions.

#GRMOVER: Rounding Bottom Breakout in Play!🚨 Monthly chart shows a classic rounding bottom breakout brewing!
Clear break above 498 MCB with strong momentum is needed to confirm the bullish continuation.
CMP: 481.40
🚧 Immediate Resistance: 498
🛡 Key Supports: 434 / 366 - 338 / 289 - 264
🎯 Targets: 935. Beyond that, sky’s the limit!
⚠️ Stay above the negation level to keep the bullish run intact.
#GRMOVER #RoundingBottom #ChartPatterns #PriceAction #LongTerm #Investing
📌 #Disclaimer: This analysis is shared for educational purposes only. It is not a buy/sell recommendation. Please do your own research before making any trading decisions.

DABUR: a long term breakout candidatePros:
-Defensive sector i.e. FMCG and world’s largest ayurvedic and natural health care company
-P/E in February 2020 > P/E in November 2025
-Promoter holding at 66% & the retail holding is near an all time low
-Highest ever sales and EPS
-Increase in capex and reduction in debt
-RS has been negative for the last many years and such stocks generally give big upmove when RS becomes positive
Cons:
-PEG is negative implying slow growth
Disc: invested

PAYTM LONG TERM INVESTING IDEAPAYTM on weekly chart has now stopped falling further and now consolidating on the lower levels.
Current price level is good to enter and we can add further at around 450 level.
Stop loss can be put around 400 or trail using 20/50 EMA.
This is a LONG term and a bit risky bet but if you have faith in paytm's fundamentals these are really good levels ;)

UNIONBANK | Cup & Handle breakout aheadUNIONBANK | Cup & Handle breakout ahead
CMP : 149
Something interesting is coming up from this counter

#nifty view Nifty opened today at 25,863.8 after an initial upside move to 25,955.75, reflecting early bullish momentum. However, the index faced resistance at these higher levels and saw a reversal, dropping to a low near 25,800 during the session. This downside move highlights renewed selling pressure, making 25,800 a decisive support zone for the day.
If Nifty fails to sustain above 25,800, further downside risk remains, and additional selling could intensify, potentially accelerating the decline. Therefore, traders should monitor 25,800 closely—holding above it may invite a recovery, while a clear breach signals the possibility of deeper corrections.
#nifty50 #stockmarket #niftyanalysis #stockmarketindia #investing

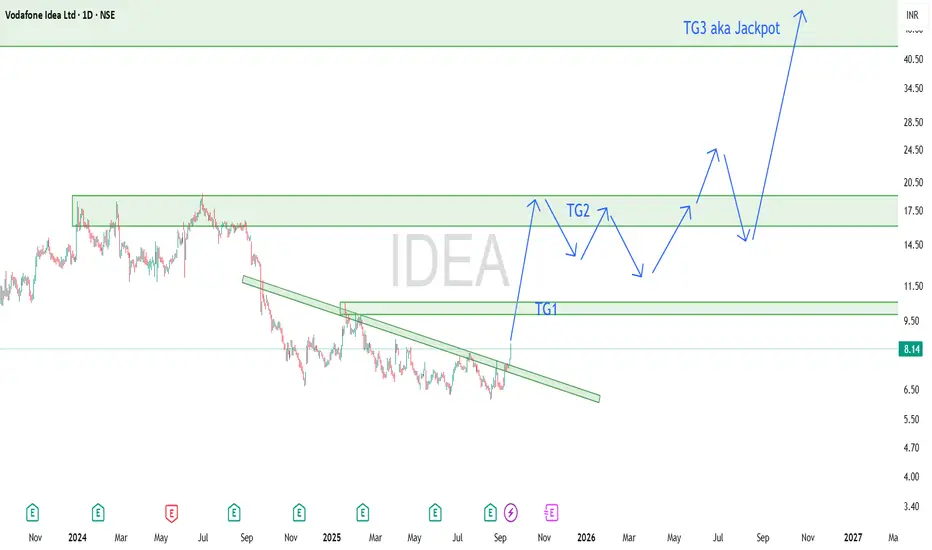
How to make Vodafone Idea a multibagger by 2026-2027After consolidating heavily at the bottom IDEA is finally moving up, We can plan for a long term view for insane profits, it will take months though. If your view is short just keep looking for bullish inside candle after a retracement and enter or Look out for good options CE setups in intraday for the next year or so, You can ride using 20 and 50 SMAs.
I'm gambling on the path(shown in arrows) it might take to reach jackpot, Remember holding that long will be a BUMPY ride, there might be deep retracements, expert traders will add more on those, Noobs will end up panicking and sell on the low of retracements and regret later. We also might see a couple of months long consolidations. If you are happy with the TG1, TG2 gains, you can book early and enter again when a good bullish setup forms.
OR this plan will fail miserably but its worth trying ;)
Entry at CMP or around 7
SL at 5.95
Targets 10, 18, 40 and beyond..
Beginner to Pro: Master Any Trade with This Step‑By‑Step PlanI make educational content videos for swing / positional trading .
Charts used in the video are 3 months old for explanation using Bar replay feature of Trading view.

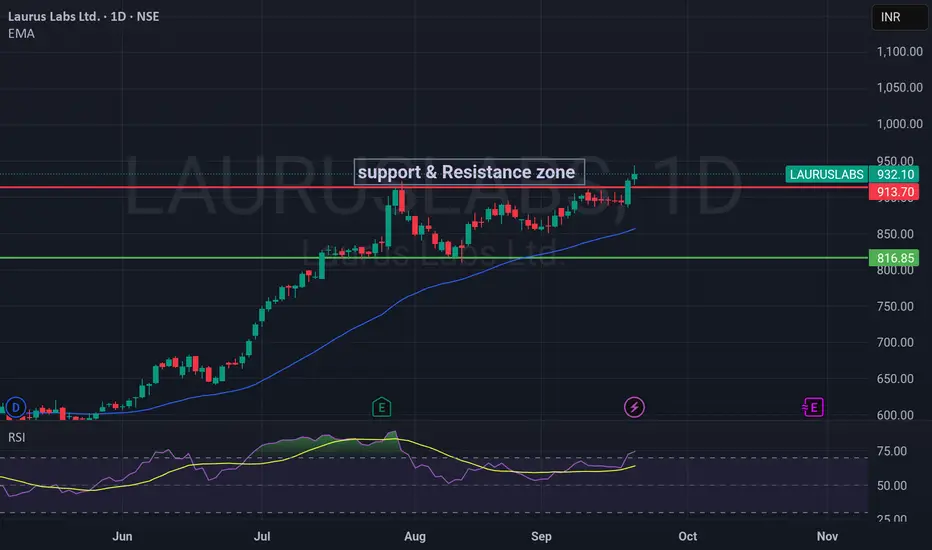
LAURUSLABS - Bullish Trend Intact; Watch for Break Above 9501. Executive Summary
Laurus Labs is in a strong bullish momentum phase, trading well above its key Exponential Moving Average (EMA). The stock faces a decisive resistance at 950. A breakout above this level could signal the next leg up, while the trend remains supported on any pullback towards the 856-917 zone. The high RSI suggests caution for immediate entries; prefer buying on dips.
2. Key Technical Observations:
Price Action: The stock closed positively at 932.10 (+0.96%), near the day's high of 944, indicating strong buying interest at lower levels.
Trend Analysis: The price is trading significantly above the EMA (856.88), confirming a robust medium-term UPTREND.
Momentum (RSI): The RSI is at 74.73, indicating the stock is in OVERBOUGHT territory. This suggests the possibility of a short-term consolidation or pullback before the next potential move higher.
Key Levels:
Resistance: 950 (Immediate & Crucial)
Support: 917 (Today's Low) -> 856 (EMA & Strong Trend Support)
3. Trading Plan:
Bullish Scenario (Primary Bias):
Entry Trigger 1 (Aggressive): A breakout and sustained close above 950 with high volume.
Entry Trigger 2 (Conservative): A pullback towards the support zone between 917 - 870 (ideally near the 856 EMA) for a better risk-reward entry.
Stop-Loss: Below 850 (A break below the EMA would invalidate the bullish structure).
Target 1: 1000
Target 2: 1025 - 1050
Bearish Scenario (Caution Signal):
A break below the 856 EMA support could lead to a deeper correction towards 800.
This is not the primary expectation but a key level to watch for risk management.
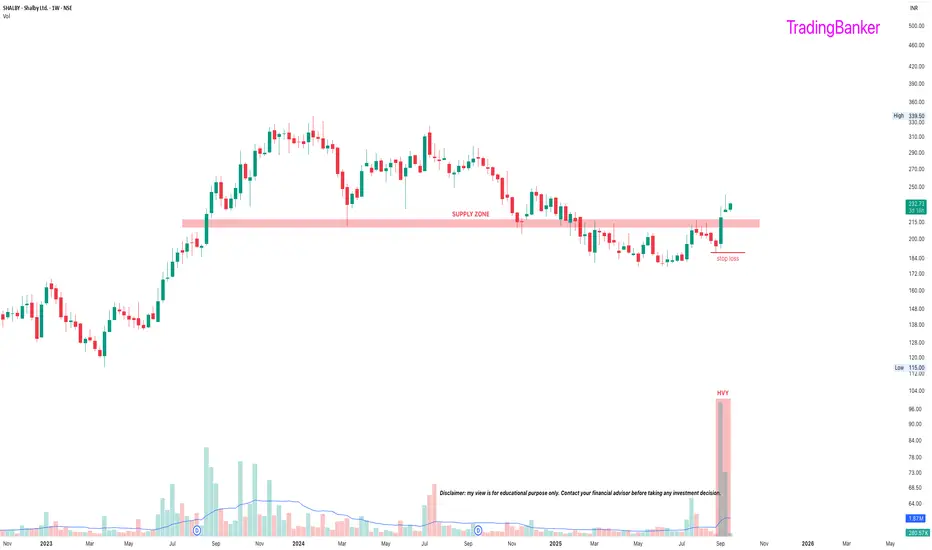
SHALBY: a probable longPros
-hospitals are a money minting machine attracting institutions (FII stake ⬆️)
-ARPOB (average revenue per occupied bed, one of the core metrics in hospitals)⬆️
-positive management commentary. for eg, aiming to improve profitability by reducing low margin schemes and focusssing on profitable schemes
-highest ever sales
-expanding through acquisitions, would eventually bring in the highest ever profits
-highest volumes of the year (week)
Cons
-SL needs risk management
-receivables > 6M = 20% of quarterly turnover (although some are from the government, they are still overdue)
Disc: Invested
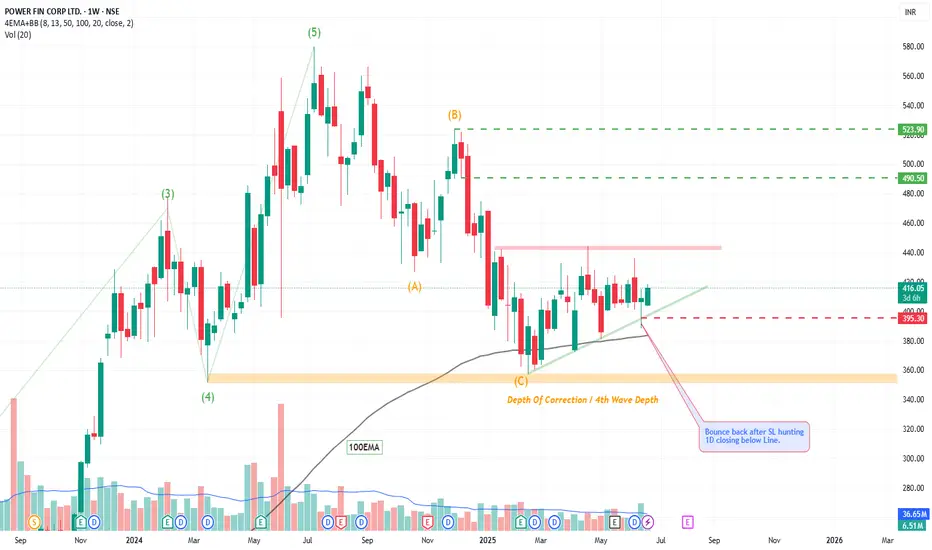
PFC By KRS Charts24th June 2025/ 9:40
Why PFC?
1. Fundamentally Good Company + Regular Dividend Payouts.
2. Technically, Feb 2025 low depth was equals to impulse Wave 4 , which shows correction got its full depth from wave theory perspective .
3. After Depth of Correction , it gave fake sell entry from 100EMA also and bounce back in Feb- Mar 2025 and sustaining above 100EMA currently.
4. Recently price action was making some sort of sideways pattern Flag or Triangle but most imp. is that I have noticed in mid-June in 1D TF it gave closing below support zone and from next day it enters back above the zone. which denotes SL hunted and Sellers got fake entry.
Note: Market do shakeout before breakout just to shake early investors and to hit SL of Breakout Traders. Can happens both sides Buy and Sell.
SL & Targets are mentioned!!
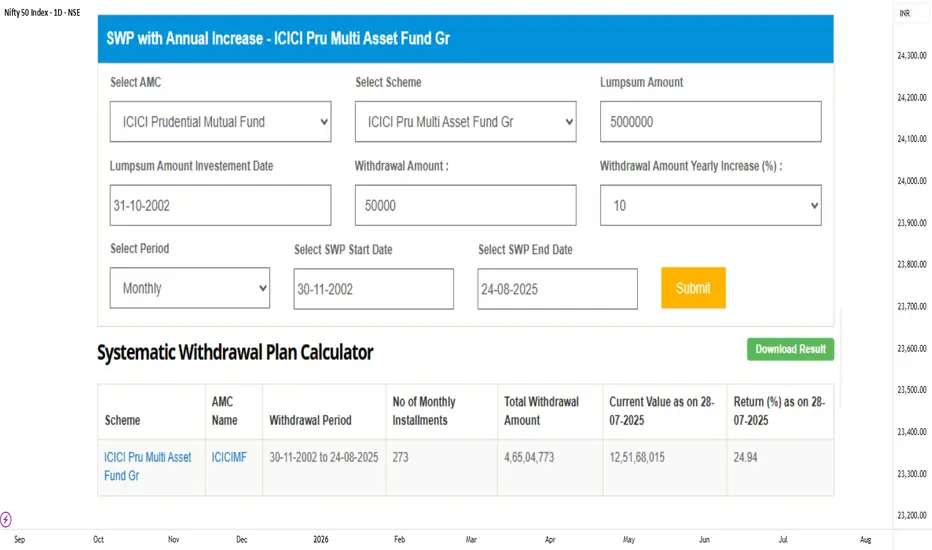
How to Create Your Own Pension with Mutual Funds (SWP Explained)Hello Everyone,
For most people, retirement planning starts with the question – “How will I get monthly income once I stop working?”
The answer is – Systematic Withdrawal Plan (SWP). With SWP, you can actually create your own pension and enjoy a stress-free retirement.
What is SWP?
A Systematic Withdrawal Plan allows you to invest a lump sum amount in a mutual fund and withdraw a fixed sum every month (or quarter/year). It’s just like receiving a pension or salary, while your remaining money continues to stay invested and grow.
Why SWP Works Like a Pension
Steady Cash Flow: You can set up regular monthly withdrawals, which creates a reliable income stream for your retirement needs.
Inflation Protection: Unlike traditional pensions or FDs where income is fixed, in SWP you can increase your withdrawal every year. This way, your monthly income grows in line with rising living costs.
Wealth Preservation: Even though you withdraw regularly, your remaining corpus is invested and keeps compounding. Over long periods, this can multiply your wealth.
Tax Efficiency: Compared to interest income from FDs, SWPs are more tax-friendly as withdrawals are treated as capital gains. This means potentially lower taxes and higher take-home income.
Flexibility: You can change the withdrawal amount, frequency, or even stop the SWP anytime depending on your needs. No traditional pension gives this much flexibility.
Why Multi-Asset Funds Work Best for SWP
SWP is most effective when your investment is diversified across equity, debt, and gold – which is exactly what multi-asset funds offer.
Equity portion helps your wealth grow faster.
Debt portion provides stability and regular income.
Gold acts as a hedge during uncertain times.
That’s why multi-asset funds are often considered the best option for long-term SWPs.
Real Example (Past Data)
Suppose an investor invested ₹50 lakh in 2002 in a multi-asset fund.
He started withdrawing ₹50,000 per month, increasing it by 10% every year.
By 2025, he had already withdrawn ₹4.65 crore (like a monthly pension).
Yet, his remaining corpus grew to around ₹12.5 crore.
Note: This is based on past returns. Future results may differ. Returns are never guaranteed in markets.
But just think of it this way – if 2002 was your starting point, and today was 2025, this is the power of SWP you would have experienced.
Rahul’s Tip
SIP helps you build wealth .
SWP helps you enjoy wealth .
If you want financial independence after retirement, don’t wait for government or company pensions. Create your own with SWPs in multi-asset funds.
If this helped, like/follow/comment.
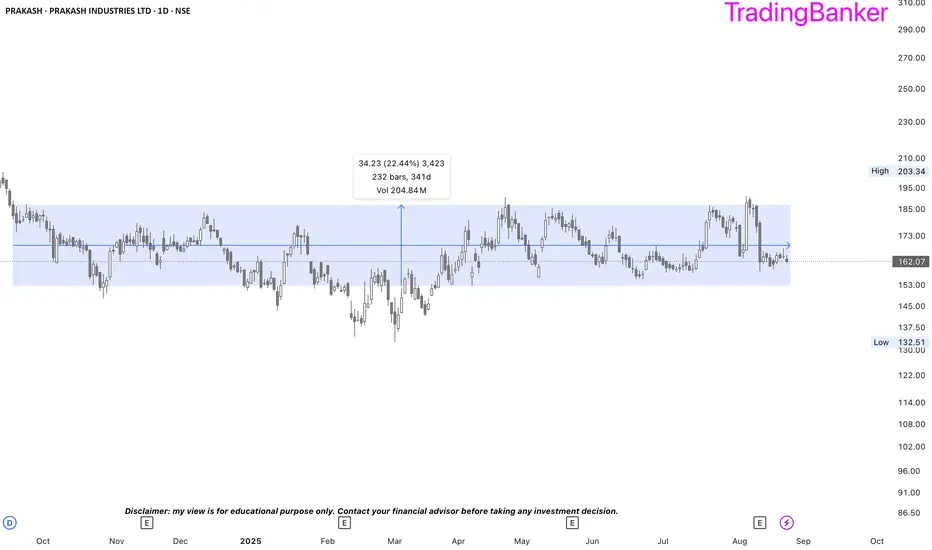
PRAKASH: range breakout soon?➡️script stuck in a range for almost a year and coiled up like a spring in the rectangle pattern.
➡️highest margins in last 5 years and an extremely low PE of 8 against the industry PE of 23.
➡️capex should bear fruit soon.
➡️highest promoter holding in last 6 years.
➡️not a matter of if, it’s a matter of when.
FLAIR: a probable longPros:
➡️Reduced borrowings and increased fixed assets
➡️Highest ever sales which may increase further and resultantly improve PAT
➡️PE ratio well below the industry PE
➡️Strong breakout from the supply zone and heading into a major resistance, if broken, can yield massive returns
Cons:
➡️Increased retail holding

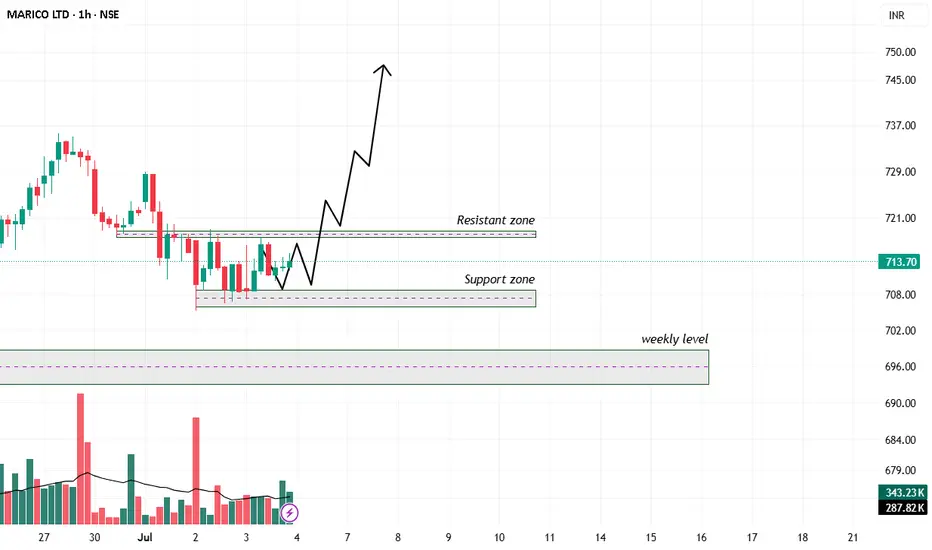
Technical Analysis: MERICO LTDTrend and Structure:
The chart shows a strong uptrend leading up to a recent pullback.
After the pullback, price is consolidating between a support zone (~708 INR) and a resistance zone (~720 INR).
There is a clear weekly support level marked around 690-695 INR below the support zone.
Volume is moderate but showing no large spikes, indicating potential consolidation.
Support and Resistance:
Immediate resistance zone is around 718-721 INR, acting as short-term overhead supply.
The support zone is roughly between 707-710 INR, serving as a base for potential bounce.
The weekly level below (roughly 690-695 INR) may act as a strong support if price breaks current support.
Price Projections:
The drawn projection suggests a short-term dip toward the support zone, followed by a strong bounce above the resistance.
This implies a possible bullish continuation after a minor correction or consolidation.
Volume:
Volume during consolidation is relatively steady.
Watch for volume pickup on a breakout above resistance for confirmation.
Trading plan:
Entry:
Consider entering a long position near or just above the support zone (~708-710 INR) when there is confirmation of buying interest (e.g., bullish reversal candlestick or volume spike).
Alternatively, a breakout entry can be taken above the resistance zone (~720-722 INR) with volume confirmation.
Stop Loss:
Place a stop loss below the support zone or slightly below the weekly level, around 700-705 INR to protect against downside risk.
Targets:
Initial target near the resistance breakout level (~720-725 INR).
Secondary target around 745-750 INR based on the upward arrow projection, representing the next resistance area.
Risk-Reward:
Risk: Approximately 8-10 INR per share.
Reward: Potential gain of 35-40 INR per share.
Favorable risk-reward ratio around 3:1 or better.
Additional Notes:
If the price falls below the support zone and weekly level with strong volume, consider exiting or avoiding long positions.
Look for confirmation signals before entry to reduce false breakouts or breakdowns.
Summary:
Table
Parameter Details
Entry Price ~708-710 INR (on support)
Stop Loss ~700-705 INR
Target 1 ~720-725 INR
Target 2 ~745-750 INR
Trend Pullback in uptrend
Risk-Reward Ratio ~3:1 or better
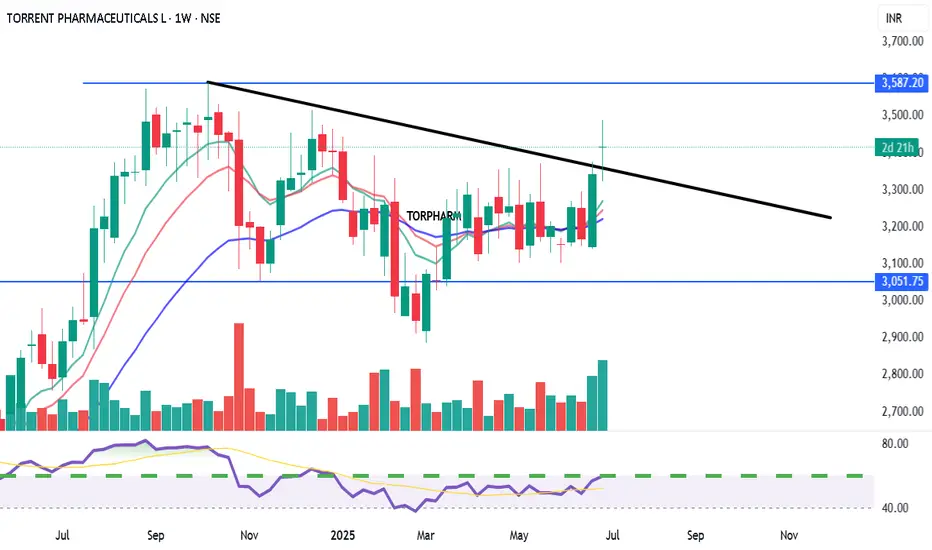
TORRENT PHARMACEUTICALS LTD. (TORPHARM) View: Bullish on confirmed breakout.
Bias: Positive momentum building.
Strategy:
BUY: Above ₹3600 (on weekly closing basis with strong volume confirmation).
Targets (T):
T1: ₹3750
T2: ₹3950+
Stop-Loss (SL): ₹3400 (on weekly closing basis).
Reasoning:
Strong support at ₹3000-₹3050.
Challenging multi-month descending trendline resistance.
Positive RSI divergence and increasing volume.
Potential for a significant trend reversal if breakout is confirmed.
MaxHealth good to keep on radar NSE:MAXHEALTH
Good to keep on the radar
Always respect SL & position sizing
===================
Trade Secret By Pratik
===================
Disclaimer
SEBI UNREGISTERED
This is our personal view and this analysis
is only for educational purposes
Please consult your advisor before
investing or trading
You are solely responsible for any
decisions
you take on basis of our research

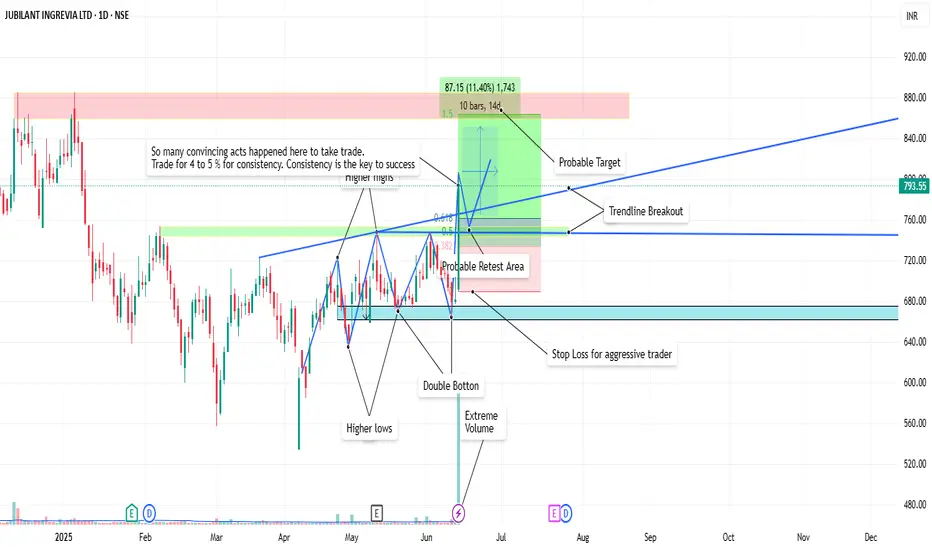
JUBLINGREA Breakout📊 1. Price Action & Pattern Analysis
Breakout Trigger:
Double Bottom at ₹660–₹670 confirmed.
Higher Lows and Higher Highs are clearly visible — a bullish trend structure.
Breakout from trendline resistance with a strong bullish candle on extreme volume confirms buyer interest.
Probable Retest Zone: Around ₹745–₹760, which overlaps with the 38.2–61.8% Fibonacci zone, indicating a good low-risk reentry area if price retests.
Stop-Loss (Aggressive): Just below ₹680 support zone (prior bottom and neckline).
🔍 2. Volume & Confirmation
Massive Volume Spike on breakout day — highest in recent months.
Volume confirms genuine buying pressure, validating the pattern breakout.
🧭 3. Stage Classification
✅ Current Stage: Stage 2 – Markup Phase (Early Stage)
Why:
Breakout from long consolidation.
Volume confirms institutional activity.
Trend structure shifting to higher highs/lows.
Strong retest and breakout of previous resistance zones.
🎯 4. Trade Plan Summary
Metric Value
📌 Entry Range ₹760–₹780 (retest possible)
🧯 Stop Loss (Aggressive) ₹675–₹680 zone
📈 Target 1 (Short-Term) ₹840–₹860 (as shown)
📈 Target 2 (Positional) ₹900+
🔎 Risk–Reward 1:2.5+ (Ideal Swing Setup)
🧠 “So many convincing acts happened here to take trade... Trade for 4 to 5% for consistency.”
✅ Conclusion
This is a classic Stage 2 early breakout with:
Multi-confirmation setup (pattern + trendline + volume)
Well-defined risk-reward
Excellent for swing-to-positional trades
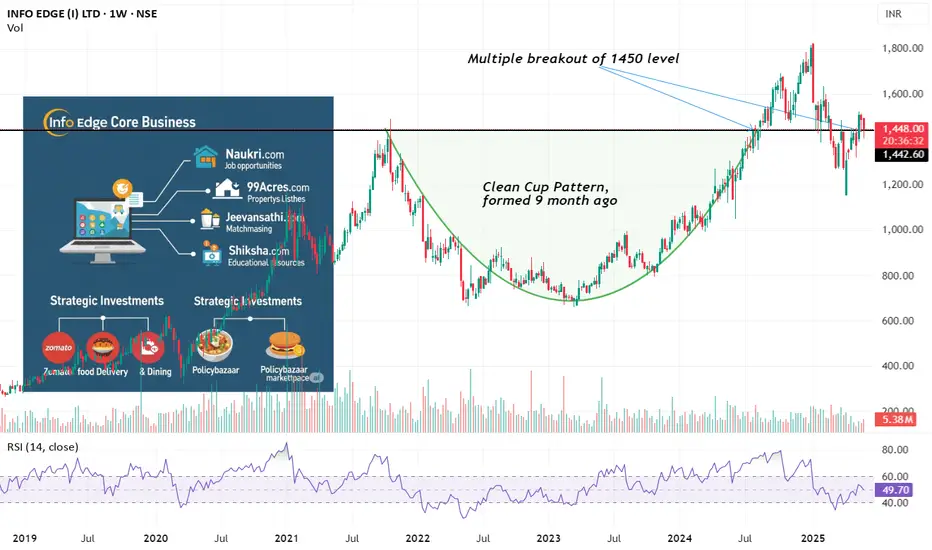
Info Edge - A Solid Business and Cup Pattern Info Edge is the parent company of Naukri.com, one of India’s leading online job portals with a dominant presence in the recruitment space.
Key Strengths
1. Market Leadership: Naukri.com holds a virtual monopoly in the online job search market, being the top choice for both job seekers and employers.
2. Consistent Growth: The company has reported rising sales and profits over the last 5 years.
3. Robust Shareholding Structure (as of March 2025):
○ Promoters: 37.63%
○ Foreign Institutional Investors (FII): 33.25%
○ Domestic Institutional Investors (DII): 18.18%
○ Public: 10.17%
4. Low Debt: Negligible debt of ₹267 crore.
5. Strong Profitability: Operating Profit Margin (OPM) of 31%.
Technical Analysis
1. On 12th August 2024, the weekly candle broke the previous high of ₹1450, last seen on 18th October 2021.
2. The stock surged to ₹1800 in the week of 6th January 2025, before correcting to ₹1160.
3. In the week of 12th May 2025, the stock once again crossed the ₹1450mark with strong volume.
4. Based on current momentum, the price could potentially reach ₹1800 by 31st May 2026.
Disclaimer
1. Always conduct your own analysis before taking any position. Consider your risk-reward ratio.
2. Review the stock's performance monthly and take appropriate action if it underperforms.
3. Do not allocate more than 2%–3% of your trading capital to a single stock.
Click on Boost if you like the Idea. leave a comment and i shall reply as much as i can.