INDIGO | Swing Trade📊 Details
Interglobe Aviation Ltd (Indigo) is India’s largest passenger airline operating as a low-cost carrier. Serving 86 destinations including 24 international destinations, it provides passengers with a simple, unbundled product, fulfilling its singular brand promise of providing “low fares, on-time flights, and a courteous and hassle-free service” to its customers. IndiGo commenced operations in August 2006 with a single aircraft and has grown its fleet to 262 aircrafts.
Disclaimer: This analysis is solely for educational purposes and does not make me a SEBI registered analyst.
If you found this analysis helpful, I encourage you to like and share it. Your observations and comments are also welcomed below. Your support, likes, follows, and comments motivate me to consistently share valuable insights with you.
🔍 More Analysis & Trade Setups 🔍
For more technical analysis and trade setups, make sure to follow me on TradingView: www.tradingview.com
Investing

The Jan to Dec of Technical Analysis - 1 strategy per month1. January - The Value at Play
Before we start discussing the different technical chart patterns, we need to have some clarity on how buying and selling happens on stocks and options. Every trade has a buyer or seller. That means at a specific point in time, for a specific price there are 2 conflicting thoughts
Someone who thinks the price is too cheap
Someone who thinks the price is damn expensive
The guy who thinks the stock/option is cheap is ready to buy and the guy who thinks it is expensive and it is a good time to sell.
Just think, how is it that two people can have conflicting mindsets about the same instrument at the same time? I am 100% sure that both of them cannot be right, one of them is making a wrong decision. Over time - 5 minutes, 50 minutes, 5 hours, 50 hours, 5 days, 50 days, or 500 days - whatever the period be, that particular instrument will tick away from the quoted price - either move up or move down.
This leads to the important question - what is the fair value? If you have an internal price gauging mechanism - you can quickly calculate if the price quoted is below or above the fair value. Wow, that looks exciting - can you give me the shortcut to calculate the fair price?
Unfortunately, there is no holy grail that does it for you, over time you need to develop that tool or spreadsheet. Have you heard the saying, “Veterans are good stock pickers” - It is mainly because of their experience in the markets. They have developed the intuition to guess the fair value when they see the ticker tape without relying on a spreadsheet or calculator.
The first rule is “Never buy anything at a premium and never sell anything at a discount”. This rule does not guarantee that you will not lose money - but it is a filter that weeds out poor decision-making. The question arises - how do I calculate the fair price of a stock or options strike?
A good place to start would be to start reading “The Little Book of Valuation: How to Value a Company, Pick a Stock and Profit (Little Books. Big Profits) by Aswath Damodaran” - you can even finish the book in 2 straight hours. It gives some insights into valuation techniques.
Most valuation methods available in the markets are part of “Fundamental Analysis”, you might ask me - “What does that have to do with Technical Analysis?”. My answer is everything. Technical Analysis is the process of guessing the future price by looking at the historical data. But what the stock/option has to do with the price today is mostly due to fundamental reasons. A mix of fundamental + technical study is much better than pure fundamental or pure technical analysis.
These days lot of people have turned to options trading as a side gig to make some extra money. Someone would have told them, that it is easy to make money in options trading. The biggest mistake they make would be to short-sell a strike too cheap and buy a strike too pricey. Option premiums do not move in a linear pattern and are totally different from the valuation techniques used to gauge the underlying. If you are able to calculate the fair value of a particular strike with some level of accuracy - then you can avoid selling it cheap and buying it pricey. More often than not, not taking a trade would be the best trade there is. If something is way above your price level, choose not to buy. If way below, choose not to sell. Have faith that a better opportunity will come and gather the courage to skip the trade.
There are 2 option types - CALLS and PUTS. The option strikes above the current trading price are called CALLS and the strikes below the price are called PUTS. The premiums of these far-away strikes are not that easy to calculate or guess, mainly because the prices are derived by a few factors like price movements, time, level of uncertainty & the interest rates in the markets.
This makes options trading like a double-edged sword. You get it right - it will reward you more than you can imagine. You get it wrong - it will take away what you have and more. I think hard guessing the fair value of a particular strike of a stock or index is 10 times more complicated than assessing the intrinsic value of that index/stock. This means if you took 15mts to find out the fair value of say “PQR” stock, you might take 150+ minutes to assess the price of a strike say 2600 CE when PQR is trading at 2500. The challenge here is that, once you calculate the fair price - the goal post would have shifted. A change in time will affect the strike prices as “time” is a variable that contributes to its value - so it is a moving target.
Now tell me, what would you call someone when they say “Options trading is easy”, “You can make 100000 in 1 month with just Rs1000 capital”, “100% guaranteed success in options trading…” etc.
The next thing to know is the difference between trading and investing. Both are tools intended to make money but the main difference is the “time” component. Investing is usually done with no particular “time” value in mind whereas trading is done for a specific “time period”. That is why you hear people say, I have bought “XYZ” stock for the long term - Even if it appreciates in price say 10% in 10 days, the investor may not sell it. Partly because they do not want to miss out on further gains after selling.
On the other hand, trading is done with a specific time frame in mind. The trader is only worried about the prices during that window. What happens after that is none of this botheration. The fear of missing out seldom affects the trader because they know their next opportunity will come if they keep looking.
Time has more relevance & weightage than you can possibly imagine. In fact, price is relative to time and it is not the other way around. You can physically measure this concept in options trading wherein strikes go to zero value on the expiry date. The major index options have weekly expiry and the stock options have monthly expiry. So a particular strike will go from “X” value to “0” value in a week. Also important to note that during this lifecycle the strike could swing between X to 4X to 100X to 0.5X to 0.2X and end at 0 after the expiry. The prices of a strike are much more volatile than their underlying - this is the main reason options trading is a double-edged sword.
Generally, people do not respect time. Most of them respect money more than time. The decisions they make are usually to save money even if it means to waste time. If you are into stock markets - that should change. Even though your purpose is to make money - you should give the due credit to the “time factor”. Let me explain with an example. A trader buys 100 qty of ABC at 1500 intending to sell it at 1600 once the results are out. If on the results day the prices drop to 1400 - that trader will say “Let me not book the loss, I will hold it for some more time for the prices to recover”. In this particular instance, the trader is not ready to book the loss but hoping that his money will recover. Most long-term investors are traders who forget to close their trades.
A trader has to have a 180-degree opposite mindset of an investor because we are playing with limited resources. If your money is blocked on a particular trade for a period longer than your calculation - then it is 100% true that you will not be able to take another trade when there is an opportunity. No trader in the world has unlimited resources and unlimited leverage but all of them have got the exact same amount of time per day. If you know how to manage the time - the money will find a way.
This comes to the final segment of this chapter - “Value at Play”. It means the amount of money adjusted for the time factor to the reward it brings in. You might be familiar with the word “Value at Risk” (VaR). Value at Play is something similar but not measured in the same way.
.... to be continued...

DCMSHRIRAM | Investment Pick📊 Details
DCM Shriram is engaged in the business of manufacturing facilities of Fertiliser, Chloro Vinyl & Cement in Kota (Rajasthan) and of Chlor- Alkali in Bharuch (Gujrat).(Source : Company Web-site )
Disclaimer: This analysis is solely for educational purposes and does not make me a SEBI registered analyst.
If you found this analysis helpful, I encourage you to like and share it. Your observations and comments are also welcomed below. Your support, likes, follows, and comments motivate me to consistently share valuable insights with you.
🔍 More Analysis & Trade Setups 🔍
For more technical analysis and trade setups, make sure to follow me on TradingView: www.tradingview.com

DRREDDY | Investment Pick📊 DETAILS
Sector: Pharmaceuticals & Drugs
Mkt Cap: 90,938 cr
Dr. Reddy's Laboratories Ltd is a leading India-based pharamceutical company which offers a portfolio of products and services, including Active Pharmaceutical Ingredients (APIs), Custom Pharmaceutical services (CPS), generics, biosimilars and differentiated formulations.
TTM PE : 17.87 (Low PE)
Sector PE : 45.28
Beta : 0.49
📚 INSIGHTS
Strong Performer
Stock with good financial performance alongside good to expensive valuation, but lacks price momentum as suggested by technical indicators
9.51% away from 52 week high
Underperformer - Dr Reddys Laboratories down by -0.74% v/s NIFTY 50 down by -0.29% in last 1 month
📈 FINANCIALS
Piotroski Score of 8/9 indicates Strong Financials
Disclaimer: This analysis is for educational purposes only, and I'm not a SEBI registered analyst.
If you found this analysis helpful, I encourage you to like and share it. Your observations and comments are also welcomed below. Your support, likes, follows, and comments motivate me to consistently share valuable insights with you.
🔍 More Analysis & Trade Setups 🔍
For more technical analysis and trade setups, make sure to follow me on TradingView: www.tradingview.com

KPIL | Multiyear Breakout📊 DETAILS
Sector: Transmission Towers / Equipments
Mkt Cap: 11,449 cr
Kalpataru Power Transmission Ltd is a global EPC player with diversified interest in power transmission and distribution, oil and gas pipeline, railways and biomass based power generation.
TTM PE : 23.95 (High PE)
Sector PE : 20.38
Beta : 0.42
📚 INSIGHTS
Mid-range performer
Stock with medium financial performance with average price momentum and valuation. These stocks may be affordable and are showing some investors interest.
3.84% away from 52 week high
Outperformer - Kalpataru Projects International up by 10.19% v/s NIFTY 50 up by 7.57% in last 1 month
📈 FINANCIALS
Piotroski Score of 5/9 indicates Average Financials
Disclaimer: This analysis is for educational purposes only, and I'm not a SEBI registered analyst.
If you found this analysis helpful, I encourage you to like and share it. Your observations and comments are also welcomed below. Your support, likes, follows, and comments motivate me to consistently share valuable insights with you.
🔍 More Analysis & Trade Setups 🔍
For more technical analysis and trade setups, make sure to follow me on TradingView: www.tradingview.com

EIHOTEL | Multiyear Breakout📊 DETAILS
Sector: Hotel, Resort & Restaurants
Mkt Cap: 15,205 cr
EIH is primarily engaged in owning and managing premium luxury hotels and cruisers under the luxury Oberoi, Trident and Maidens brands. The Company is also engaged in flight catering, airport restaurants, project management and corporate air charters.(Source : 202003 Annual Report Page No:124)
TTM PE : 35.86 (Average PE)
Sector PE : 55.58
Beta : 0.73
📚 INSIGHTS
Strong Performer
Stock with consistent financial performance, quality management, and strong technical momentum indicating good investor enthusiasm. Currently valued at Good to expensive valuation
11.75% away from 52 week high
Underperformer - EIH up by 5.01% v/s NIFTY 50 up by 8.82% in last 1 month
📈 FINANCIALS
Piotroski Score of 9/9 indicates Strong Financials
Disclaimer: This analysis is for educational purposes only, and I'm not a SEBI registered analyst.
If you found this analysis helpful, I encourage you to like and share it. Your observations and comments are also welcomed below. Your support, likes, follows, and comments motivate me to consistently share valuable insights with you.
🔍 More Analysis & Trade Setups 🔍
For more technical analysis and trade setups, make sure to follow me on TradingView: www.tradingview.com

Aether Industries Ltd | Momentum Swing IdeaAether Industries Ltd | Momentum Swing Idea
Incorporated in 2013, Aether Industries Limited is a manufacturer of specialty chemicals .
Financial : strong
Market Cap = 11,959 Cr. ROCE = 18.4 % ROE = 15.9 %
Debt to equity = 0.01 Promoter holding = 81.8 % Piotroski score = 4.00
Quick ratio = 4.36 Profit Var 3Yrs = 48.1 % Return on assets = 12.1 %
Profit Var 3Yrs = 48.1 % Sales growth 3Years = 29.2 %
Aether manufacturing specialty chemicals.
now it is in momentum stock . Technically very bullish.
as well as fundamentally also Strong chemical stock.
now lets what happen in coming weeks.
Note: I am not SEBI registered financial Adviser. I solely present my views on chart .I do not charge any kind of service. This is not buy sell recommendation.
If you like my ideas than like boost and follow me for more ideas.
Thanks and comment freely

BEAST AWAKEN.. HDFCBANK .. HDFCBANK fut broke above cup n handle pattern on daily charts with good OI.
Risk:Reward - 1:2
Not to be missed.
Could be bought short term or positional with mentioned stoploss & target for dec/jan series.

JAN SERIES+2024=BOOM. TARGET 4400DIVISLAB FUT made & broke inverse head & shoulder pattern on daily charts with decent OI.
Risk:Reward = 1:4
Not to be missed breakout.
Could be bought with mentioned stoploss & target.

ZYDUSLIFEZYDUSLIFE FUT broke above triangle pattern on an hourly charts with good OI.
Could be bought with mentioned stoplos & target.

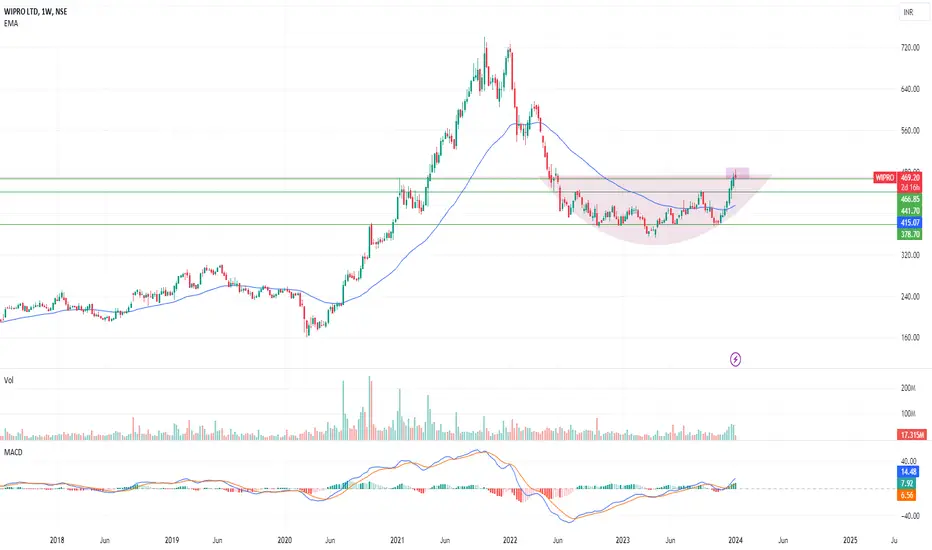
Right time to invest in WIPROIn weekly chart we can see after double top price was fall. And whole 2023 reate a strong support at 441.70.
Very Strong Support - 441.70
Now 464 resistance level is breaking. If we see this week creating a red candle but volume is good and as expected price will go higher and touch 500 within couple of month.
It Creating cup and handle pattern.
If we see very carefully couple 7 consecutive 7 week creating green candle with a good volume.
It's a good sign for investor.
NIIT Learning Systems Ltd | A investment pickNIIT Learning Systems Ltd | A investment pick
NIIT Learning Systems Limited offers Managed Training Services to companies across 30 countries. The NLSL has comprehensive suite of Managed Training Services includes Custom Content and Curriculum Design, Learning Delivery, Learning Administration, Strategic Sourcing, Learning Technology, and L&D consulting services. The company also offers specialized solutions including immersive learning, customer education, talent pipeline as a service, DE&I training, digital and IT trainings well as leadership and professional development services.
Fundamentals:
Market Cap = ₹ 5,538 Cr. ROCE = 36.5 % ROE = 31.8 %
Debt to equity = 0.15 Promoter holding = 34.8 % Return on assets = 15.8 %
its almost debt free learning solution based company its upcoming future is bright .
good financial . we will closely track financial in upcoming years .
If you like my ideas and find some valuable knowledge than follow me and boost my ideas.
note: I am not SEBI registered financial adviser. pls do your own research first.

JPPOWERWeekly Candle timeframe
looks very good bullish now
Head and should pattern has broken in mothly time frame.
and now making price action and going up.
i am very bulish on this.
DISCLAIMER: I AM NOT SEBI REGISTERED ANALYST. ALL POSTS ARE EDUCATIONAL PURPOSE. NON ADVISORY, DISCRETIONAL NO CLAIMS, RIGHTS RESERVED. I AM NOT RESPONSIBLE FOR YOUR PROFIT OR LOSS.

NATIONALUM : LONG TERM STRUCTURENSE:NATIONALUM
Happy New Year in advance and farewell to 2023.
Today was the last trading day of the calendar year, and I hope you all have learned a lot and gained valuable knowledge.
We will continue to grow in 2024 and gain deeper insights into the market. Thank you for your trust and support.
Let’s make 2024 a great year together.
One More Pick For 2024 lets analyse it.
#NATIONALUM 3month Chart analysis. 📊
You can see the price is approaching the Major Resistance zone on the 3-month Chart.
With Long-term View I am expecting it to give more than 2x return Soon.
The Price has approached the Horizontal resistance zone with good volume confirmation and momentum building is great.
You can enter in a range of 120-130 (keep room for averaging at lower levels around 100.
Take a confirmation of the weekly candle close above its previous candle for adding more quantity.
Target levels are mentioned on chart. 📊
Keep learning,
Happy trading

Gujarat Gas: consistency rewardsDebt consistently up
Fixed assets consistently up
ROE & ROCE > 20%
Sales & PAT consistently up
#newyear pick
Engaged in the gas industry which has tremendous potential

KRBL: 100% upmove possible➡️promoter holding up
➡️stake held by Reliance
➡️ highest ever sales, PAT and reducing debt
➡️100% upmove possible and a multi-year breakout
Disc: already invested

BRITANNIA | Investment Pick📊 Details
Britannia Industries is one of Indias leading food companies with a 100 year legacy and annual revenues in excess of Rs. 9000 Cr. Britannia is among the most trusted food brands, and manufactures Indias favorite brands like Good Day, Tiger, NutriChoice, Milk Bikis and Marie Gold which are household names in India. Britannias product portfolio includes Biscuits, Bread, Cakes, Rusk, and Dairy products including Cheese, Beverages, Milk and Yoghurt.
Disclaimer: This analysis is solely for educational purposes and does not make me a SEBI registered analyst.
If you found this analysis helpful, I encourage you to like and share it. Your observations and comments are also welcomed below. Your support, likes, follows, and comments motivate me to consistently share valuable insights with you.
🔍 More Analysis & Trade Setups 🔍
For more technical analysis and trade setups, make sure to follow me on TradingView: www.tradingview.com

Laurus Labs Ltd | Pharma multibagger momentum stockLaurus Labs Ltd | Pharma multibagger momentum stock
Founded in 2005, Laurus Labs is a research-driven pharmaceutical and biotechnology company having a global leadership position in select Active Pharmaceutical Ingredients (APIs)
Financial: excellent
Market Cap = 23,185 Cr. ROCE = 22.2 % ROE = 20.4 %
Debt to equity = 0.45 Promoter holding = 27.2 % Piotroski score = 5.00
Quick ratio = 0.64 Current ratio = 1.31 Profit Var 3Yrs = 41.6 %
Sales growth 3Years = 27.3 % Return on assets = 11.2 %
in sector rotation now its pharma time to move up.
big player heavily buying in pharma sector.
this stock is big one momentum stock. since long consolidation RSI up move in momentum zone.
we have to ready for participate and grab the opportunity . moreover financially also stable pharma company.
Note: I am not SEBI registered financial Adviser. I solely present my views on chart .I do not charge any kind of service. This is not buy sell recommendation.
If you like my ideas than like boost and follow me for more ideas.
Thanks and comment freely

Q&A_ Is market waiting for a deep correction? My view.Definition:
India VIX is a volatility index based on the NIFTY Index Option prices. From the best bid-ask prices of NIFTY Options contracts, a volatility figure (%) is calculated which indicates the expected market volatility over the next 30 calendar days.
Here you can see the weekly chart of India Vix. You must have noticed that whenever the Vix touches 10% levels, it bounces off. This has been happening since 2014. So, Vix generally means "expected market volatility (or say movement) over the next 30 calendar days". Nifty is wandering around 16000 levels and 15500 levels since June. It means buyers are not interested to buy. They must be booking the profits.
So, if the market has to move up, then "Vix must fall below 10% levels". But "we have a very strong support at 10% levels". Of course it may go little below 10% levels (like it did on 19 Jun 2017 to 8.75%). But the point here is if the market has to move up, then Vix must fall. Hence I am expecting a deep correction. This is not supported on charts only, but as well as fundamentals aspects (like Nifty moving above 28 PE), share prices are really expensive, euphoria, new trading accounts opened and enjoying the bull market, etc.
Exception: The strong bullishness in S&P 500 (or say US markets), can easily affect the Indian markets. If there is "euphoria" on US markets, it's everywhere. Hence Nifty can move even higher.
Conclusion: I am not saying to just go short (or sell off your shares), if you're an trader, good. But if you are an investor, just think and analyze more. Of course there are stocks that are undervalued, you can invest a little there. But, the blue-chip stocks, I won't advice it for investing now.
You get best prices when "there is fear, there is an uncertainty, there's a panic". Always saving your money for that time (for investing) is crucial.
Disclaimer: The information and analysis I've provided is of my own, please do your thorough analysis and/or consult your financial advisor before investing. The investing in securities markets are subject to market risks. I am not a SEBI registered investment advisor. Thankyou for reading and I wish you a happy investing.

Indian Energy Exchange Ltd |The Next Multibagger Indian Energy Exchange Ltd |The Next Multibagger
Incorporated in 2007, Indian Energy Exchange Ltd provides an automated platform and infrastructure for carrying out trading in electricity units for physical delivery of electricity
Financial: Excellent
Market Cap = 14,980 Cr. ROCE = 51.8 % ROE = 39.4 %
Debt to equity = 0.01 Quick ratio = 1.47 Current ratio = 1.47
Piotroski score = 4.00 Profit Var 3Yrs = 20.3 % Sales growth 3Years = 16.0 %
This stock is technically strong bullish candidate. RSI is now entering momentum zone.
since long time it was consolidated and now its seems over and big player enter in this stock.
Gem: Do not enter in stock randomly. wait for stock momentum and then participate. yo will see stock moves fast than normal speed.
Note: I am not SEBI registered financial Adviser. I solely present my views on chart .I do not charge any kind of service. This is not buy sell recommendation.
If you like my ideas than like boost and follow me for more ideas.
Thanks and comment freely

Gujarat Fluorochemicals Ltd | A Investment PickGujarat Fluorochemicals Ltd | A Investment Pick
Incorporated in 2018, Gujarat Fluorochemicals Limited, earlier known as Inox Fluorochemicals Limited, is a part of the INOX Group of Companies and has been demerged from GFL Ltd, into a separate legal entity.
It is one of the leading producers of Fluoro-polymers, Fluoro-specialities, Chemicals and Refrigerants in India. It is one of the top five global players in the fluoropolymers market with exports to Europe, Americas, Japan and Asia.
Fundamentals:
Market Cap = ₹ 34,049 Cr. ROCE = 29.6 % ROE = 27.0 %
Debt to equity = 0.29 Promoter holding = 63.8 % Piotroski score = 8.00
Profit Var 3Yrs = 86.6 % Sales growth 3Years = 29.7 % Return on assets = 17.3 %
in my view its a growth base and profit making company with high product demand.
I am personally bullish in long time horizon .
if you like my momentum investing idea than like and follow me for more and boost ideas and motivate me.
note: I am not SEBI registered financial advisor. before investing do your proper research.

Indo Borax & Chemicals Ltd | A Momentum StockIndo Borax & Chemicals Ltd | A Momentum Stock
was incorporated in the year 1980 in Asangaon and its first Boric Acid plant was established in the year 1981, followed by the establishment of a Borax plant in 1983.
Fundamentals: excellent
Market Cap =₹ 604 Cr. ROCE = 28.7 % ROE = 21.0 % Debt to equity =0.0
Promoter holding =52.1 % Quick ratio =10.7 Current ratio=13.7
Piotroski score =9.0 Profit Var 3Yrs =44.1% Sales growth 3Years =25.0%
Return on assets = 19.6 %
I shared my personal view so just take it as educational purpose and learn how to invest in momentum stocks and grow fast.
nugget ; it takes time but big money earn with boring way.
If you find some value for this idea than like boost and follow me for more ideas.

IRCTC | Swing Trade📊 Details
Incorporated in 1999, IRCTC is a Mini Ratna (Category 1, Central Public Sector Enterprises ) and the only company authorized by the Indian government to provide online railway tickets, catering services, and packaged drinking water
at railway stations and trains in India
Disclaimer: This analysis is solely for educational purposes and does not make me a SEBI registered analyst.
If you found this analysis helpful, I encourage you to like and share it. Your observations and comments are also welcomed below. Your support, likes, follows, and comments motivate me to consistently share valuable insights with you.
🔍 More Analysis & Trade Setups 🔍
For more technical analysis and trade setups, make sure to follow me on TradingView: www.tradingview.com
