Symmetrical Triangle Pattern Breakout seen In Bajaj Finserv Ltd.Hello everyone, i hope you all will be doing good in your Trading and Life as well. I have brought a stock which has given a breakout of Symmetrical Triangle Pattern. Stock name is Bajaj Finserv Ltd, and it is the holding company for the various financial services businesses under the Bajaj group. It serves millions of customers by providing solutions for asset acquisition through financing, asset protection through general insurance, family and income protection in the form of life and health insurance, and retirement and savings solutions.
Technically and Fundamentally stock is really Good to go for short term to long term as well. I think this is the best stock to hold for long term from here. This can be best portfolio stock. Companies management has given positive outlook for future in last quaterly result conference call.
The pattern can indicate a number of things, including:
Volatility contraction
The pattern can symbolize a decrease in volatility as the price range contracts within the triangle.
Indecision
The pattern can form when the market is uncertain and buying and selling continues.
Potential trend reversals or continuations
The pattern can help traders and analysts spot potential trend reversals or continuations and manage risk.
A breakout from the upper trendline indicates the start of a new bullish trend, while a breakdown from the lower trendline marks the start of a new bearish trend. Check the charts above (Bajaj finserv) it has given breakouts for falling upper band. before to few minutes of Closing of today's session or opening of next day session can be entry point. For the Targets you can calculate the thickness of symmetrical pattern as i have shown on chart above, and stop loss can be place at lower of breakout candle or near to lower band support line.
Market Cap
₹ 2,74,385 Cr.
Current Price
₹ 1,719
High / Low
₹ 1,742 / 1,419
Stock P/E
32.9
Book Value
₹ 378
Dividend Yield
0.06 %
ROCE
11.7 %
ROE
15.3 %
Face Value
₹ 1.00
Industry PE
23.6
Debt
₹ 2,88,933 Cr.
EPS
₹ 52.3
Promoter holding
60.6 %
Intrinsic Value
₹ 902
Pledged percentage
0.01 %
EVEBITDA
12.8
Change in Prom Hold
-0.04 %
Profit Var 5Yrs
20.4 %
Sales growth 5Years
21.0 %
Return over 5years
19.8 %
Debt to equity
4.79
Net profit
₹ 16,095 Cr.
ROE 5Yr
13.8 %
Profit growth
18.3 %
Earnings yield
7.66 %
Disclaimer:- Please always do your own analysis or consult with your financial advisor before taking any kind of trades.
Dear traders, If you like my work then do not forget to hit like and follow me, and guy's let me know what do you think about this idea in comment box, i would be love to reply all of you guy's.
Thankyou.
Investmentideas

TFCILTD watch for breakout Tourism Finance Corporation of India Ltd provides financial assistance to the tourism sector comprising hotels, resorts, restaurants, food courts, amusement parks, ropeways, multiplexes, etc
You can make an entry with R:R :: 1:4.
I am expecting TFCILTD to go bullish.
Reason:
Bullish Flag and POLE breakout to the upside.
Taking support at the VWAP indicates a good sign to enter.
RSI crossing 60 to upside shows good bullishness.
Successful breakout after six months.
High volume is traded on the last day, which shows a lot of interest in stock buying.
Price > EMAs show bulls are more powerful than bears. We can make an entry.
Taking successful support at 200 EMA with good buying interest(volume spike)
Verdict: Strong Bullish
Plan of action:
BUY: 350
Stoploss: 327
Target: 400
Trailing SL: 10 or VWAP or logical

INOXGREEN Analysis Buy mode ON Incorporated in 2012, Inox Green Energy Services Limited is one of the major wind power operation and maintenance ("O&M") service providers within India. The company is a subsidiary of Inox Wind Limited ("IWL") and part of the Inox GFL group of companies.
INOXGREEN has broken out to the upside. I am expecting it to go higher.
All important levels are marked on the chart.
Reasons:
RSI > 60, crossing 60 to the upside, entering the bullish zone. (Bullish)
Price > EMAs show the market has good bullish strength. (Bullish)
VWAP ~ Price shows good volume balanced price, ready to move to the upside. (Bullish)
Stock has a broken symmetrical triangle to the upside, which is a neutral pattern. Now, as it has broken to the upside, there is a high probability of moving it to the upside.
Verdict : Bullish
Plan of action :
Buy: 146.50
Stoploss: 134
Target: 187.50


Are you ready to get Next 1000% Returns from this Solar Stock?Hello everyone, i hope you all will be doing good in your life and your trading as well.
I have brought brought a stock from renewables energy which manufacturing of low-iron solar glass for application in photovoltaic panels, Flat plate collectors and Green houses. It is the first and the only producer of solar glasses in the country.
If i talk about Manufacturing capabilities company has grown by over 7.5 times in the last five years, from a manufacturing capacity of 180 tons per day in 2018 to 1350 tons per day in 2023 (including the German acquisition).
Overall Company has given more than 1500% returns since IPO came, and this will continue to like this in future as well. I think everyone should think for long term in it or better do sip in this futuristic business stock. Govt. also encouraging families to put solar in rural and urban areas so as demand is increasing, company can grow in multifolds. so again this is best time to enter for long term as well as short term to medium term.
Stock has given breakout of Rectangle Pattern and price has come to retest the levels. Everything supported by huge volume spike on weekly chart, MACD indicator also has given bullish crossover on weekly timeframe.
Disclaimer:- Please always do your own analysis or consult with your financial advisor before taking any kind of trades.
Dear traders, If you like my work then do not forget to hit like and follow me, and guy's let me know what do you think about this idea in comment box, i would be love to reply all of you guy's.
Thankyou.

Aarti Industries Strong Buy Short termAartiind, Trend reversal happened and moving High as per previous update.
at the moment, made weak hands shake out, took SL and Moving Up again.
Upside targets are very much Intact.
Follow your own analysis before taking any trade.

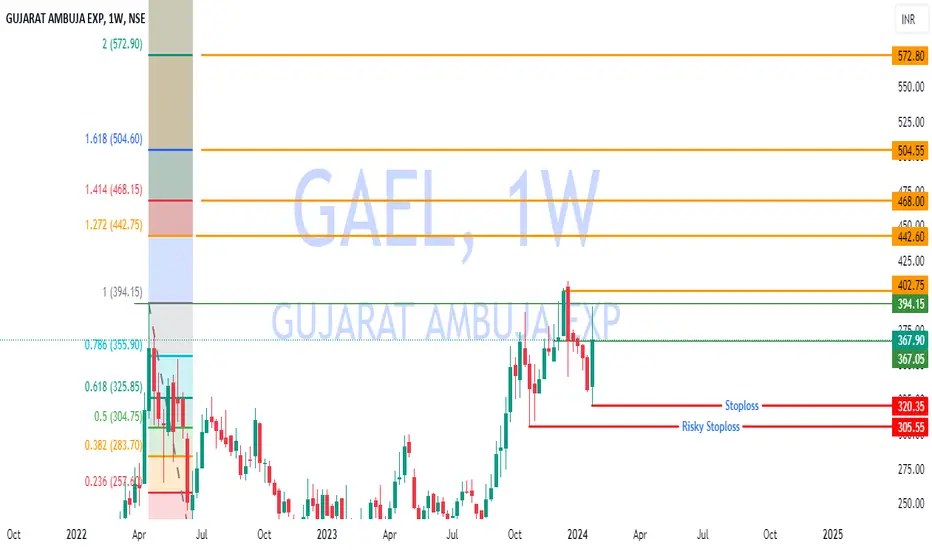
Gael Better Risk Reward#Gujarat Ambuja Exp is trendy at the moment and Making continuous Higher High and Higher Low,
At the Moment #stock is at Higher Low, followed by #Priceaction.
Buy with the Calculated SL and can Ride the trend.
Safe players can book 1:1.5.
Do your own Analysis before any trade.
#TradewithConviction
Symmetrical Triangle pattern Breakout seen in Gujarat AmbujaHello Traders & Investors,
I have brought another analysis on Symmetrical triangle pattern breakout. Well this almost similar to Triangle pattern, but in this lower band trendline act upward sloping support in security. Same we have seen in Gujarat Ambuja Exports. Well there is higher Chances that we can see huge momentum in coming few weeks. So let's go, i will explain a bit about this pattern so you guy's can understand and trade easily whenever you see this pattern next time.
Q:- What is Symmetrical Triangle Pattern?
Rahul:- A symmetrical triangle is a chart formation where the slope of the price’s highs and the slope of the price’s lows converge together to a point where it looks like a triangle.
Q:- Which direction will it go?
Rahul:- If the prior trend is Uptrend then buyers gonna to win the battles for sure.
Q:- How and when to Trade?
Rahul:- Guy's keep in mind when both slopes get closer to each other, it means that a breakout is getting near, and we just have to wait for that breakout to take place. You can take entry once you see successfully breakout and keep stop loss at lower band of the Triangle, and there could be another entry once price shows pull back towards breakout zone. Targets can be place at all time high and 2nd target can be length of Triangle pattern.
So guy's i hope you have learned this Symmetrical Triangle Pattern now.
Let's Focus About Company background:-
Gujarat Ambuja Exports is engaged in the manufacturing of Corn Starch Derivatives, Soya Derivatives, Feed Ingredients, Cotton Yarn, and Edible Oils. Since its incorporation in 1991, GAEL strives to serve the Food, Pharmaceutical, Feed, and many other industries with a long-term growth strategy in the Agro-Processing sector. (Source: Company Website)
Market Cap
₹ 7,223 Cr.
Current Price
₹ 315
High / Low
₹ 327 / 222
Stock P/E
25.2
Book Value
₹ 107
Dividend Yield
0.22 %
ROCE
17.9 %
ROE
14.5 %
Face Value
₹ 1.00
Debt
₹ 227 Cr.
EPS
₹ 12.5
PEG Ratio
1.94
Promoter holding
63.8 %
Intrinsic Value
₹ 170
Pledged percentage
0.00 %
EVEBITDA
14.8
Disclaimer:- Please always do your own analysis or consult with your financial advisor before taking any kind of trades.
Dear traders, If you like my work then do not forget to hit like and follow me, and guy's let me know what do you think about this idea in comment box, i would be love to reply all of you guy's.
Thankyou

PNB Housing Monthly Investment AnalysisPNB Housing Monthly Analysis
PNB Housing Monthly Investment Analysis Based On Technical Analysis and Completely Based On My Knowledge and It's My Personal View
As Per the Analysis for PNB Housing For Monthly Chart, I am expecting that PNB Housing Share is on very important levels as per monthly charts, 500-620 is a level where it will trade as zero line zone means we will initiate any buying until it is rangebound under these levels, if it will go above the 620 levels then we can expect
3 Months Target as 750 - 760,
7 Months Target as 1000-1020,
15 Months Target as 1150 - 1250
and If PNB Housing wouldn't sustained above 620 levels then we can expect these below levels, if it will came below 500 levels
5 to 6 months target would be 330-350
11 to 12 months target would be 150-170
Disclaimer : These analysis are purely based on Technical Analysis, I Don't Recommend You to Buy or Trade or Make Any Investment Based On Above Levels.
I Always Request You to Please Do Your Own Analysis Before Taking Any Trade or Starting Investment or Consult Your Financial Advisor To Take Investment Related Decisions

Multi Year Trend Line Breakout The monthly chart of EID Parry shows a multi year trend line breakout with good volumes.
But this comes with RSI divergence too.
Though the breakout raises probabilities of further upside. The chances of long term upside may gain strength on close above the highest high.
Keeping SL at close below the lower trend line.
