IOC CUP & HANDLEA Cup and Handle pattern can be seen on daily and 4hr chart of IOC. Break above the neckline of this can begin a new uptrend.
IOC

IOC AGAIN IN CHANNELNSE:IOC
IOC AGAIN IN CHANNEL THE PRICES TO WATCH ARE 74 -95
THE PRICE NEEDS TO BREAK 95 LEVEL TO GET IN TO THE UP TREND
FOR SHORT TIME WE CAN SEE A CORRECTION IN THIS

IOC buy setup - Tiny risky huge rewardBuy IOCat CMP 82.70 and on dips upto 82.25
T1: 86
T2: 88
SL: 81.5


Indian oil, IOC ShortIOC is in a clear downtrend which gave us a nice bounce to the Kijun sen / 0.5 fib level followed by 2 days of rejection. Will be shorting the futures lot of feb 2020.
Short 115.45
Sl = 118.30
Target 1 = 109 , RR = 2.26
Target 2 = Open and trail with daily heiken ashi candles if trade works out in our favor.


IOC Trade Setup !!TREND ANALYSIS & TRADE SETUP
Follow Chart Instruction.
Do not be Hurry for entry.
Wait for Proper Entry Setup.
Buy/Sell with Best Risk Reward.
Educational Chart Only.
You can Comment and ask the TREND ANALYSIS of any STOCK/SCRIPT/INDEX/FOREX.
Wait for entry setup, if available then Long/short.
R:R is 3-5 times.


Indian Oil Corporation (IOC)As per psychological Support & Resistance
Short Term Target= 122-23
Second Target= 129-30
Stop Loss=116-18

USOIL pullback trade usoil
guys kindly follow on twitter to communicate and connect better
i dont stay on tradingview often

IOC made bullish divergence on MACD histogram on weekly chartIndian Oil Corporation has given bullish divergence on weekly chart. The depth of histogram (bearish zone) is shallow via a vis previous bottom in price which made earlier.
Average Direction index just moved upward (>20) in weekly chart....Further, on weekly chart stock has taken support between 122-125 in last 3 occasion.
IT seems overall bullish pattern is formed for stock.

PAIR TRADE !!HPCL-VS-IOC!!HINDPETRO-VS-IOC PAIR TRADE
EXECUTE THE FOLLOWING
HPCL(HINDETRO)
DEC FUT
BUY@267.2
QTY:2100
CASH (DEL):
BUY @266.25
QTY:1235
IOC
DEC FUT
SHORT @127.4
QTY:7000
(3500*2)
!!EXECUTE BOTH TRADES!!
!!STATISTICAL ARBRITRAGE!!
!!HOLD FOR GAINS!!
!!FOLLOW UP-FOR UPDATE!!


IOC (Indian Oil Corporation Limited) SELL BELOW 116IOC (Indian Oil Corporation Limited) SELL BELOW 116

Indian oil corporation(IOC)IOC is near strong support and it is going to start its rally...
Tomorrow IOC can go down first towards 121 and from that point it'll start recover..
Intraday buy IOC @ 121.10-121.25 Target 123,124.05,125.85 Stoploss 120
For positional Buy @ 121.5 stoploss 118.8 Target open..

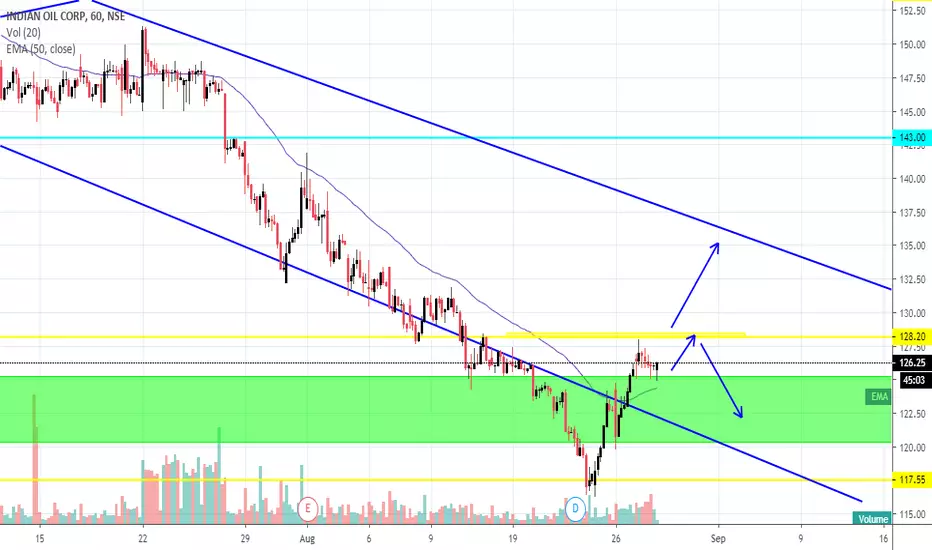
IOC Hourly ChartIOC Hourly Chart Analysis. Break above minor yellow resistance zone may trigger buy. If rejected then price may come down again