IRCTC
This chart appears to be a candlestick chart for IRCTC (Indian Railway Catering and Tourism Corporation) stock prices over a period from June to December 2024, with a descending trendline indicating a bearish trend overall. Here are some observations:
Bearish Trend: The descending trendline suggests that the stock has been in a general decline since June 2024. This indicates that the price of IRCTC shares has been decreasing over this period.
Support and Resistance: The trendline might act as a resistance level where the price struggles to break above. The price has touched this trendline multiple times, indicating it's a significant level for traders to watch.
Recent Bounce: Towards the end of the chart, there's a noticeable bounce in the stock price, suggesting some buying interest or a potential reversal. This could be due to various factors like positive news, earnings reports, or market sentiment.
Volume: If volume data were available, it would provide more context. Typically, a bounce with high volume could indicate stronger buying support.
Time Frame: The chart shows daily candlesticks, which means each candlestick represents one day of trading.
Current Price: The last price shown is 843.05 INR, with a slight upward movement at the end of December, indicating some recovery from the previous lows.
Future Outlook: If the price breaks above the descending trendline with significant volume, it could signal a potential trend reversal. Conversely, if it fails to break this resistance, the bearish trend might continue.
For a more detailed analysis or if you're looking for trading advice, consider:
Technical Indicators: Adding indicators like RSI, MACD, or moving averages could provide more insights into momentum and potential reversal points.
Fundamental Analysis: Looking at IRCTC's earnings, news, and market conditions could offer a broader perspective.
Market Sentiment: General market trends and sector performance could also influence IRCTC's stock movement.
If you're considering trading based on this chart, remember to set stop-loss orders and have a clear strategy for both entry and exit points.
Irctclong

IRCTC Long Idea......IRCTC looks good for reversal.
It is forming cup and handle pattern. Currently in Handle structure. 2-3 Quaters down the line it may touch ATH.
Targets are given in chart. SL for safe traders is trendline it was taking support on.
Risk management is Priority. Need to consider broader market conditions before taking position as swing.
I am personally going to average at horizontal support if at all it comes.
NOTE : Fundamentals are good. Top line 3Y sales growth CAGR = 77% , Bottom line 3Y Profit growth CAGR = 90%. Good ROE. No peer to compare P/E as Monopoly & P/E,P/B < median
I'm personally buying it whenerver falls 5-10%.

Weekly bullish flag BO in IRCTC with 20% upsideHi,
NSE:IRCTC has given a Bullish Flag Breakout on weekly charts with very good volume.
MACD is also on the bullish side on daily and monthly time frames and expecting to turn positive on weekly time frame. RSI is also on the bullish side on daily and weekly time frames.
In the current market scenario I am expecting that the bullish momentum will continue.
Complete price projection like entry, stoploss and targets mentioned on the charts for educational purpose.
Please share your feedback or any queries on the study.
Disclaimer: Please consult your financial advisor before making any investment decision.

Indian Railway Catering & Tourism Corporation - IRCTC - BreakoutDate : 1-Apr-2024
Rating : Buy - Positional Trade
LTP : Rs. 970.15
Targets: (1) Rs. 1,049 --> (2) Rs. 1,118 --> (3) Rs. 1,279
SL : Rs. 930
Technical View:
• NSE:IRCTC is in its primary uptrend since Oct-2023 and was recently going through it's secondary downtrend.
• After touching the high of 1,049 on 20-Jan-2024, it has retraced 18% to 862.75 level.
• NSE:IRCTC has broke out from its secondary down trend on 1-Apr-2024 with higher than average volume.
• RSI has crossed over 50 on 21-Mar-2024. MACD has crossed over 0 on 1-Apr-2024.
• On 21-Mar-2024 it has closed above 20 DMA.
• Looking strong to start a new swing from here.
Disclaimer : I am not a SEBI registered analyst/consultant and not recommending anyone to take any BUY or SELL position in stock market. Investing in stock market is risky and one should do a self analysis and validation before investing in stock market.

[LONG TERM] IRCTC LONG TERM IRCTC this stock only for long .
This Long term Investment only base on Indicator which is 5 EMA On Montly.
If you afford the stoploss then only take this trade for Long Term.
I didnot read any fundamental for this stock. This is purly on Indicator.
This is only for education purpose.

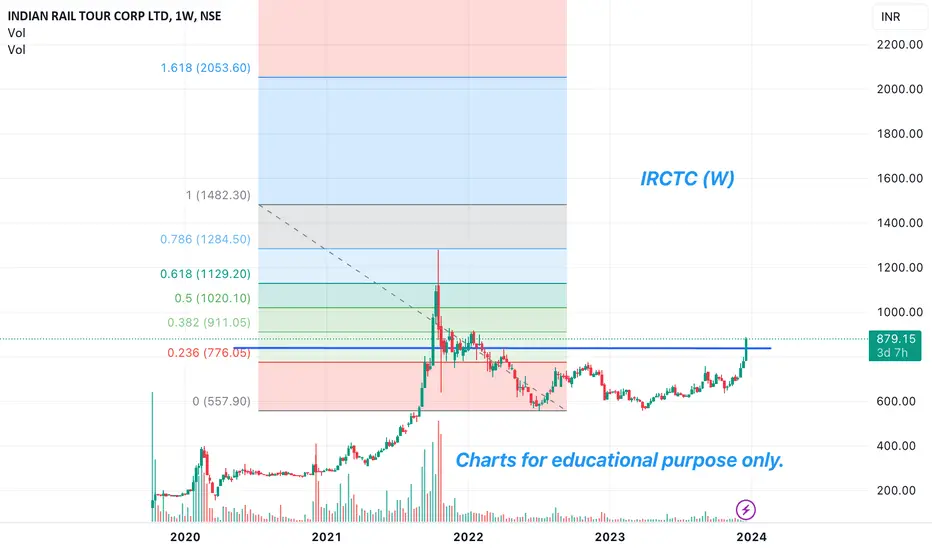
IRCTC (Looks Good On Chart)IRCTC has given a breakout at the 840 level. Closing above 840 (W) might open gates for 911, 1020, 1129, and 1284 levels.
Disclaimer: I am not a SEBI registered analyst. All the stocks are for educational purposes. Investors must consult a financial advisor before making any investment. It is not a buy or sell recommendation.
IRCTC: DOUBLE BOTTOM CANDIDATEFrom Nov'22 high stock was under pressure and tested the Jul'22 on 27-Mar'23. From there prices are bouncing back forming higher high and higher low on the lower degree time frame. There is also a formation of INVERSE HEAD & SHOULDER PATTERN which is a bottom reversal pattern whose neckline is 655 and currently prices are trading above this level on weekly chart which should be considered as the breakout of this bottom reversal pattern. The measured target for this pattern is coming about to be in the region of 775-780 zone which is also the neckline of Double bottom pattern on larger degree front.
TRADING STRATEGY:
Buy 662, SL: 616 TGT: 775-780

IRCTC Analysis (Head and Shoulders)! NSE:IRCTC ANALYSIS!
IRCTC Analysis on a daily Timeframe!
Descending Triangle Pattern Formation, Breakout and Retesting on a Weekly Timeframe!
Inverted Head and Shoulder Pattern Formation, Breakout and Retesting on a Daily Timeframe!
Bullish RSI Divergence in IRCTC!
Trend Reversal in IRCTC!
IRCTC has made Descending Triangle Pattern on weekly Timeframe , and it has given a breakout to its resistance trendline and retested its support level. If we reduce timeframe to Daily timeframe, then we can see the clear INVERTED HEAD AND SHOULDERS PATTERN at the bottom. We can see previous trend is Downtrend. If we combine RSI analysis with it, then we can see a Bullish RSI Divergence. After the bullish divergence the trend has been changed from Downtrend to an Uptrend. After that RSI and Price both are trending Upwards. This is a clear indication of the bullishness. I have extended neckline and support trendline both may act as a Support Trendlines.
Rest of all Analysis is on the chart itself and I have marked all the important levels with price do study thoroughly.
Thank You!
Important Note= Please have a look on my previous IRCTC Analysis which is based on Weekly Analysis.
Entry = Current levels are considered to be a good buy.
Stop Loss = Below 615.50
Targets = 1) 661.50 2) 66490 3) 711.55
Disclaimer = All my analysis is for Educational Purpose only. Before entering into any trade - 1) Educate Yourself 2) Do your own research and analysis 3) Define your Risk to Reward ratio 4) Don't trade with full capital

irctcirctc 610.35
in this stock up side is possible if it opens above 0.33 level of fib series.
entry with proper stoploss
Note :
this is only for education

long entrylooking for target 650 +
conceot based on parallel channel breakout
stop @ own risk
disclaimer - trade @ own risk

IRCTC LOOKS GOOD BUY @ 580 - 575IRTC looks a good buy around 580 - 575 with the SL of 555 for the marked targets on the chart.
To motivate us, Please like the idea If you agree with the analysis.
Happy Trading!
InvestPro India Team

IRCTC ANALYSIS!!! Short Term moves can be seen in IRCTC in the upcoming days.Huge liquidity taken, wait for the right time to entry in it.
It's a deep analysis on how the stock should move!!
Warning!!!
Do your own analysis and then enter in it. Don't follow blindly. Get help from ur financial advisor.

Irctc at support levelsIrctc at support levels of 610.
Expecting some upmove in short term. If volume is good and sustains at support levels it can see 661-775+
No recommendations, just my view based on chart.

IRCTC LONG BUY IRCTC With SL 692
Target 770-785
Note : Trading in any financial market is very risky. I post ideas for educational purpose only. It is not financial advice. Do not hold us responsible for any potential loss you may incur. Please consult your financial adviser before trading.

IRCTC ADX Showing momentum & expecting big rally IRCTC Expecting Breakout & Big rally above 760
Positive RSI on Daily & Weekly Time Frame
ADX Showing Positive Momentum
Keep on radar for quick gains
Huge potential above 760

intra long resistance breakout trade
buy @ 752 for tgt 766-778
lets c how it performs
disclaimer - trade @ own risk

IRCTC ready to flyRailway Sector stock IRCTC have picked up significant momentum & have given a breakout/ near a significant breakout level.
Volume Also looks good.

IRCTC: Ready for another impulseAfter the formation of ending diagonal stock has given an upside impulsive rally and undergone into a corrective phase. The recent price action suggests that corrective phase has been over and stock is ready for another leg of impulse on the upside.
One should buy the stock in the current levels or on dips near 730 zone , keeping SL of 660 look for the tgt of 840-45 and 920-25 region in the coming weeks.

06/10/2022 Research Report For IRCTCDisclaimer:
I am not SEBI registered person and this is not an investment advice and also please note this is only for education purpose. Also note I have already bought IRCTC shares for my own portfolio and also we can use this research again for my own portfolios. So don't influence yourself by this research. Please note before investing according to this educational research, please do your own research and also do take advice from your financial adviser before invest any single rupee. Your any profits and loss are totally your liability. No one is liable for that. Also, please note we will not never compensate your any loss. So before investing any single rupee, please do your own research according to your risk taking capacity and after that do invest and book profits on right time.
Buy @ C.M.P (Current Market Price)
Target 1:- 840
Target 2: 930
Target 3:- 1000
Sometimes for the global problems (Like: ECONOMICS:USIRYY , TVC:USOIL , TVC:UKOIL , ECONOMICS:USINTR , WAR and etc. ) the stock price can be go on down, BUT IF YOUR RESEARCH IS ACCURATE, THEN BELIEVE IN YOURSELF & HOLD SHARES WITHOUT STOPLOSS.SELF CONFIDENCE IS LIKE GOD. BELIEVE GOD.
Also If You Have Believe on My Research , Then That My Past Year Research Report Will Also Be Active:-


IRCTC Chart Analysis and Important Key Levels to Watch 2022 IRCTC Chart Analysis and Important Key Levels to Watch 2022
Decending Triangle Chart Pattern
Stoploss below 700 if Closes EOD
For More Details Search in Google - Stock review Manoj Shnde 27485

IRCTC LongConsolidating for a long time now + broke trend + retest done + above 38% fib level.
Its a risk worth taking!!! NSE:IRCTC
