Short ITCThis is a monthly chart ananlysis
I have various confirmations to short ITC...
1 . previous support may act as resistance
2. it is at 50% fibonacci line where it has given a long wick..showing more selling pressure
3. the move ending at 50% fib level is of same length of previous move .....
.
Lets see what happens this is just a view....
ITC

ITC (Price action)Price has been in a narrow triangle range. With small SL can initiate positional longs
ITC Updated Trend Analysis !! Investment PickTREND ANALYSIS & TRADE SETUP !
WAVE ANALYSIS !!
Follow Chart Instruction.
Do not be Hurry for entry.
Wait for Proper Entry Setup.
Buy/Sell with Best Risk Reward.
Educational Chart Only.
Wait for ENTRY CONFIRMATION !
Risk:Reward: 8-10 times.


ITC at a crucial point yet againOne of the most talked-about stocks of the Indian markets, ITC, is at a crucial zone yet again. 200DMA + 200 psych level + support zone + RSI40.
It's retested this level 9 times but is forming lower highs. Will be interesting to see if we're able to see a bounce this coming week...
Marked as a 'Long' with a stop below 200DMA, roughly 4-5%.

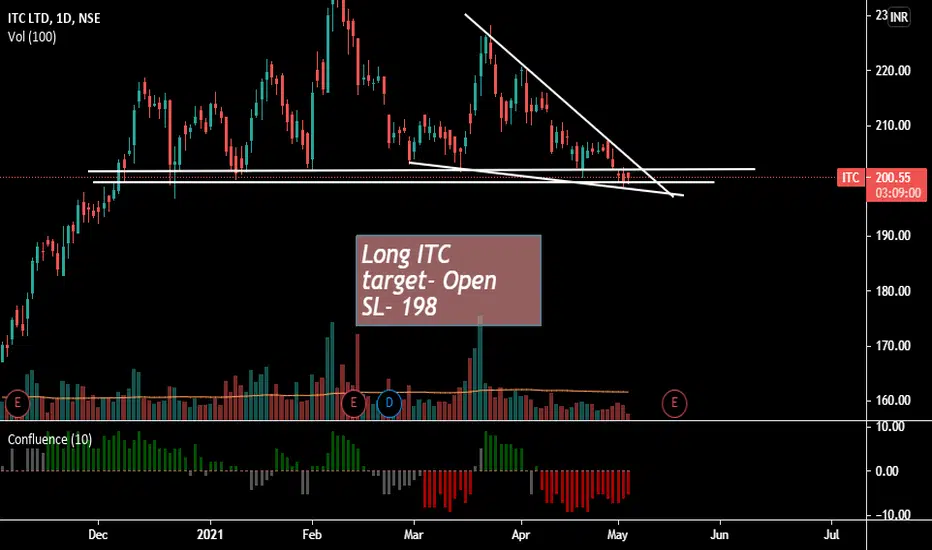
ITC Buy RangeITC bullish XABCD pattern and ABCD pattern.Buy ITC in range of 201 to 204 SL 199.10 on closing basis.
This is for learning purpose.


Long in ITC for longer term with this small stopGo long in ITC. Long in ITC for longer term with this small stop as mentioned in Chart. You don't need any indicator for ITC.
Simply follow the chart and keep stop below 195 on daily closing basis only. If it doesn't close below that then expect 235/240/250/270 then 310/320/350. Just keeping less stop with bigger profit can give you good profit with good dividend.
This is only for long term investment or the target of 350.
PS: I am not a certified and SEBI registered analyst. All my postings are only for educational purpose. Please consult with your adviser before your take any investment decision.
Indicator used: Super trend in daily time frames and Support in Price actions.

big movement excepted in ITC✌️study purpose only
big movement expected in ITC
if break 210.55 in fut tgt of 220 soon


#WHIRLPOOL CMP2351 #TARGET 2663 #FMCG #ITC #DABUR #HINDUNILVR DAILY CHART ANALYSIS
#WHIRLPOOL
NSE: WHIRLPOOL
Short Term Quick Profit
CMP 2351.20
Target 2663.70
SL : 2190
Timeframe < 60 Days
Can hold for longer time
Factors:
BULLISH WEDGE BREAKOUT
Trend Following
Rising Volume with rising Prices.
Flag pattern breakout.
Pennant Pattern Breakout with Bullish Candle.
Retest Successful.
Higher Highs & Higher Lows.
Broken above RESISTANCE levels
Trading at SUPPORT levels
Earnings are strong.
Bullish Wedge Breakout
Risk Return Ratio is healthy.
And
Rising from Double Bottom Pattern to Flag Pattern forming.
If you like my work KINDLY LIKE SHARE & FOLLOW this page for free Stock Recommendations.
With 💚 from Rachit Sethia

Time to Invest in ITC !!!!TREND ANALYSIS & TRADE SETUP !
WAVE ANALYSIS !!
Follow Chart Instruction.
Do not be Hurry for entry.
Wait for Proper Entry Setup.
Buy/Sell with Best Risk Reward.
Educational Chart Only.
Wait for ENTRY CONFIRMATION !
Risk:Reward: 8-10 times.

#ITC .. Flip is comingITC has been in an uptrend since last year.. It is now confirmed to be trading in a rising wedge formation in medium term and in a descending triangle formation in short term... Both have bearish connotations..
Volume oscillator also has downtrend..
200-205 levels have been extremely strong support in the past..but strong support also means strong resistance...
Look for a break below 200 level .. It would be a sign to close long position (or open short position)..
Only Educational, not a call.. Trade at your own risk..

HUL - HALLA BOL 🐛 🐛#LONG
entry above 2402.20
target 1 - 2425/2431
target 2 - 2462 / 2477.85
target 3 - 2496
Check these Upcoming ideas - STILL ACTIVE
Check these successful trades & approach on Britannia , Mothersonsumi , DLF , Biocon , Daawat , Infosys , HBL power , HDFC life , Hind ZINC given below
If you like my analysis do like & follow me as a token of appreciation. If you have any queries on any stock let me know.
Leave a comment that is helpful or encouraging. Let's master the markets together

Britannia Double bottom Breakout!!Britannia Double bottom neckline breakout and indicators are also giving positive signals.
Stock is trading at lower PE than Industry but very close to Historical PE.

ITC for Investors & positional tradersITC for Investors & positional traders
looking at monthly chart,
Price Movment : after covid market crash ITC respected almost 9yr old monthly trend line and made a base for uptrend again by forming HH & HL on monthly time frame.
Volume : at the same time after covid dip monthly volume is also increased almost more than twice compare to past few years before covide dip.
looking at monthly volume definitely Accu mulation of ITC stock is going on .
Wave study : if we talk about waves bullish breakout of recent down trend line may end corrective wave 2 and head us towards wave 3 which generally calculated as 1.6 times the wave 1 (previous uptrend) from the price point of covide fall, price dip.
Very good opportunity for Investors.
Trade/Investment Execution can be as below
Buy @ Current levels (any price above 200 to 225 )
STOP LOSS : 190
Target : T1 270, T2 320, T3 360, T4 - depend on future price moment (generally 1.6 times of wave 1 )
Disclaimer : this is just a study on stock investment idea, please do your own research to understand price movement, Always Respect STOP LOSS in case trade/investment tern in a loosing trade/investment.


Intraday levels - 07 June 2021 - After a long fall ITC moves to fill the gap , if moves down wait for retest
- Use pivot for small target
- Target marked in chart

Support Resistance Learning in Lucid manner on Chart of ITCI draw a support and resistance line for learning purpose for beginner and for sharpen the axe of medium and experience Trader also.
learning is important it is every where so garb it as much you can
mcpriceaction

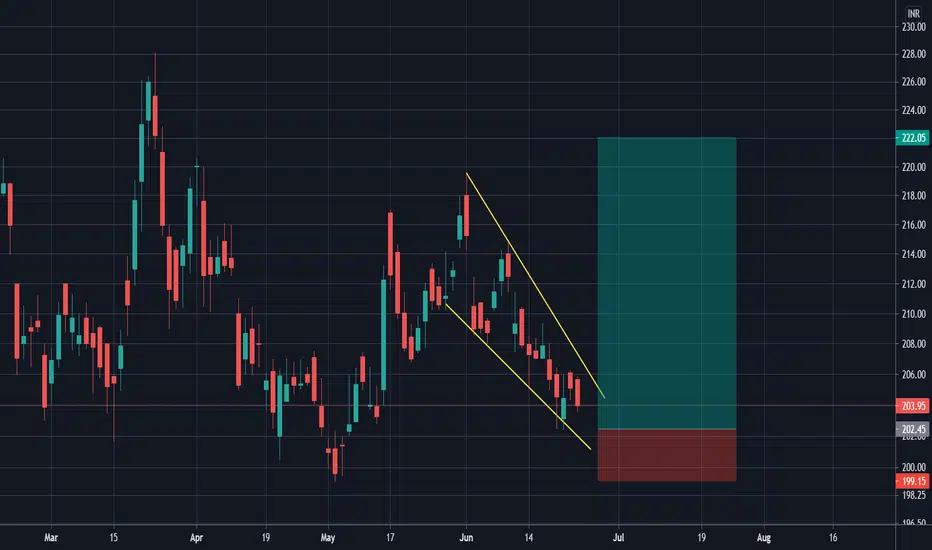
ITC LONGAccumulate ITC between 207-205 with sl 202
Short Target 1= 219 Target 2= 225
Long tern Target 238
Note : Trading in any financial market is very risky. I post ideas for educational purpose only. It is not financial advice. Do not hold us responsible for any potential loss you may incur. Please consult your financial adviser before trading.

Intraday levels - 03 June 2021- ITC moves to fill the gap Resistance level
- Support and Resistance levels marked in chart

DAAWAT - Symmetric triangle breakout !!!!!!DAAWAT - Symmetric triangle -
Breakout alert ahead.
Self explanatory chart.
For educational purpose only. I am not a sebi registered expert. Trade at your own risk. Feel free to text & Share your views.
