Itc - Sideways to Bullish in coming daysStock seems to be near the end of bearishness
Multiple strong conjunctive supports arriving
494 - 496 strongest support for the stock
View negates below 492
Possible targets 515/530
Itctrade

ITC looks BULLISH, Good for long term.In this video, I have provided my view on ITC for swing trading as well as long term investing.
Watch the video for more details.

ITC strong uptrend target price 314 316ITC strong buying trend in day chart...with hight delivery percentage last 5 trading. so next target 314, 320,328.Time to go for long, get ready to catch the profit. This is knowledge sharing ideas only. If you want to invest consult with your advisor once . Thank you.

#itc Trade setupNSE:ITC
Whoever holding this stock from lower level, then can keep stop loss at 238(closing basis)
whoever want to take trade they need to understand first current candle and that's DOJI if break low then it might take next support at 238 and if break high of current DOJI then it will activate this harmonic chart and long side target would be 299 on trailing basis.
ones ITC activate this pattern one can short ITC if find reversal.
📌 To Trade on This Chart, You Should Have Reversal Trading Knowledge. As Harmonic is One Of The Best Reversal Trading Strategy, But Always Remember That Harmonic Patterns Also Can Fail (there is no holly grail In Stock Market). That's Why One Should Must Have Knowledge Of Reversal Trading To Trade On Harmonic Patterns .
📌 That Dash Line Is Called PRZ, From That Dash Line To that Horizontal Simple Line Area Is Whole PRZ(Price Reversal Zone).
******whatever charts or levels sharing here or on any other platforms are just for educational purpose only, Not A Recommendation To Buy Or Sell. Please do your own analysis before taking any trade on them. We are not SEBI registered.

ITC Weekly Gann S/R Levels.ITC 's weekly Support and Resistance levels According to Gann price Square where ITC can take a support and face resistance in coming week
levels with # are most important among those levels.

Simple Trade Setup | ITC | 16/05/2022 [INTRADAY]NSE:ITC
Observations:
1) On 1day time frame, it has made morning start pattern.
Please refer below chart : 1day time frame.
-------------------------------------
Trade Setup for 16-05-2022
1) Don't Jump in to trade at the beginning of the market. Let it get settle for 15-20min first and judge the price action.
2) Everything is mentioned on the chart. I hope it is easy to understand.
3) All the levels will work as support, resistance, entry and exit w.r.t price action near that level.
4) Avoid gap up or gap down chase. Wait and trade between levels.
Please refer below chart for levels.
Hope I made it easy to understand it.
Do comment your doubt or suggestion.
Note: Trade with Strict SL. It may or may not hit all the levels. So one can book profit / loss at respective level considering how price action works near that level.

Simple Trade Setup | ITC | 09-05-2022 [INTRADAY]NSE:ITC
Observations:
1) On 1hr time frame, we can see it gave breakout of triangle pattern.
Please refer below chart : 1hr time frame.
2) On 1 day time frame, we can see it gave closing above the critical level of 265
Please refer below chart : 1day time frame.
-------------------------------------
Trade Setup for 09-05-2022
1) Don't Jump in to trade at the beginning of the market. Let it get settle for 15-20min first and judge the price action.
2) Everything is mentioned on the chart. I hope it is easy to understand.
3) All the levels will work as support, resistance, entry and exit w.r.t price action near that level.
4) Avoid gap up or gap down chase. Wait and trade between levels.
Please refer below chart for levels.
Hope I made it easy to understand it.
Do comment your doubt or suggestion.
Note: Trade with Strict SL. It may or may not hit all the levels. So one can book profit / loss at respective level considering how price action works near that level.

Simple Trade Setup | ITC | 04-05-2022 [INTRADAY]NSE:ITC
Observations:
1) On 1hr time frame, we can see formation of triangle pattern.
I have drawn resistance channel and support channel.
Please refer below chart : 1hr time frame.
2) On 1 day time frame, we can see 265 will be crucial level.
Please refer below chart : 1day time frame.
-------------------------------------
Trade Setup for 04-05-2022
1) Don't Jump in to trade at the beginning of the market. Let it get settle for 15-20min first and judge the price action.
2) Everything is mentioned on the chart. I hope it is easy to understand.
3) All the levels will work as support, resistance, entry and exit w.r.t price action near that level.
4) Avoid gap up or gap down chase. Wait and trade between levels.
Please refer below chart for levels.
Hope I made it easy to understand it.
Do comment your doubt or suggestion.
Note: Trade with Strict SL. It may or may not hit all the levels. So one can book profit / loss at respective level considering how price action works near that level.

ITC Analysis !! Broke Out📈 ITC Ltd. 📉
This broke out from a Resistance Zone of 234-240 after testing 3 times. ITC on a larger chart forming a triangle pattern which won’t be visible in this chart but I can share on demand.
On Buy Side I am looking for Targets of 260-264.
StopLoss should be kept below 230-232zone.
It offers 1:3 Risk To Reward.
ITC on a larger chart forming a triangle pattern which won’t be visible in this chart but I can share on demand.
All Important Supports and Resistances are drawn in chart. All levels are on closing basis.
Please have a look and revert back if you need some more study on it.
Disclaimer : Consult Your Financial Advisor Before Taking Any Decision On This Analysis.

Swing SetupEXPLANATION : This is a 1 hour time frame chart of ITC . The stock has been consolidating for days in a descending channel and formed Falling Wedge pattern , If stock taking support from Demand zone we buy at the bottom and sell at the top. I am seeing a very good buying opportunity in ITC because of many reasons . If give a strong breakdown and broke its Demand zone with high volumes and retest the same , I am bearish on ITC . Always be extra cautious with breakout trade with confirmations .
If you like this analysis give a Like // Follow for more updates , let me know in comments below :)

Levels for - 04 Oct 2021EXPLANATION : This is a 1 hour time frame chart of ITC , It has formed Symmetrical triangle pattern ; A symmetrical triangle chart pattern represents a period of consolidation before the price is forced to breakout or breakdown. A breakdown from the lower trendline marks the start of a new bearish trend , while a breakout from the upper trendline indicates the start of a new bullish trend . Both side levels marked in chart.
If you like this analysis give a Like // Follow for more updates , let me know in comments below :)


ITC WAIT AND WATCHLast week market was overall bullish and sellers had a full control over market. It is still seeming weak and will be in same condition in upcoming weak as per my analysis but as we know that market can change its direction any-time so we can not relay only on analysis.
So in ITC chances are too high that market will open in downward side but there is a also small chances to open market in upside so wait until 9:45 and after that enter into market accordingly.
PUT Stop Loss and Take Profit targets according to your own Risk Appetite.
Happy Trading. :-)
Note :
Trading foreign exchange and stocks on margin carry a high level of risk and may not be suitable for all investors. The high degree of leverage can work against you as well as for you. Before deciding to trade foreign exchange or stocks you should carefully consider your investment objectives, level of experience, and risk appetite. The possibility exists that you could sustain a loss in excess of your initial investment. You should be aware of all risks associated with stock and foreign exchange trading and seek advice from an independent financial divisor if you have any doubts. I am not a licensed financial advisor and this content is not financial advice.

ITC ( Can be a Good Swing ? )ITC can be Good Swing for a shorter Period of Time
.
.
.
DM for your Enquiries

🚬 #itc #nifty #banknifty #niftybank #niftyfmcg #fmcgNSE:ITC
as today was result so be careful in this trade if find reversal or support from given PRZ levels then only long this stock. Learn Apply Grow
******whatever charts or levels sharing here are just for educational purpose only not a recommendation. please do your own analysis before taking any trade on them. we are not SEBI registered.

ITC AT FIBONACCI RETRACEMENT ITC is trading at monthly 200EMA support along with Fibonacci support. From here downside is limited considering fundamental ratios. Not expecting much from results. However, there is a strong demand zone at 150-165. ITC can be a big bet for the year 2021.
CMP - 174.75
Short Term Target - 190
Mid Term Target - 220

ITC LongBUY BETWEEN 166-168
SL-164
TARGET-174/177++++
===========================
BUY 170CE BETWEEN 5-5.5
SL-4
TARGET-8-10++++

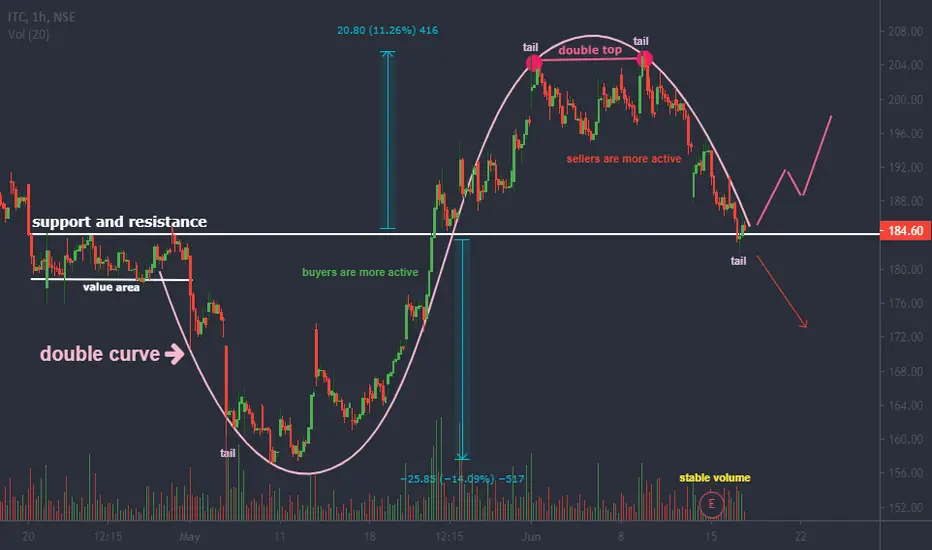
ITC price actions:Strong support 181.55 below, this price stock can slop up-to 174.30
If the price cross 186.35 to be in safe side stock can move up-to 192.70.
The stock moment is very slow.
In support line candle made a tail which shows price rejection.
A double curve has created and having a strong support level.