GBP/JPY WEEKPLAN: Ready for Super OB BuyMarket Structure Analysis
Long-Term Trend: The GBP/JPY pair is in a strong uptrend, confirmed by a series of consecutive higher highs and higher lows (BOS - Break of Structure).
Recent Change: Recently, the price has had a minor structural shift (M-MSS or ChoCH - Change of Character) by breaking the most recent low within the bullish structure. This signals that a downward correction might be underway.
Current Status: After the structural shift, the price has created a lower high and is currently in a corrective downward movement.
Analysis of Key Zones
Support/Buy Zone (BUY ZONE OB):
Location: The price range from ~199.000 to ~199.200.
Significance: This is a crucial Order Block (OB). This zone is where "Smart Money" placed large buy orders to push the price up, creating a BOS beforehand. After the price corrects, it is highly likely to retrace to this zone to "fill" the remaining orders and continue the uptrend. This is the most potential entry point for a long position.
Resistance/Sell Zones (OBS and Imbalance):
Location:
OBS: The price range from ~200.400 to ~200.600.
Imbalance: The price range from ~199.600 to ~200.400.
Significance: These are temporary resistance zones. The Imbalance is a liquidity void created by the rapid price drop, and the price might retrace to fill it before continuing its decline towards the BUY ZONE. The OBS is an area with a cluster of sell orders, and the price has reacted to this zone in the past.
Stop Loss Points:
SL for a short trade: Placed above the highest peak (~200.800) to protect a potential sell order.
SL for a long trade: Placed below the BUY ZONE (~198.800) for risk management.
Detailed Trading Plan
Based on the analysis, there are two main trading scenarios:
Scenario 1 (Wait for a Buy - Primary Plan):
Strategy: Wait for the price to continue its corrective pullback to the strong support zone.
Entry: Place a pending buy order in the BUY ZONE OB (~199.000 - 199.200).
Reasoning: This is the strongest support zone where the price is highly likely to reverse to continue the long-term uptrend.
Take Profit:
TP1: The OBS zone (~200.400 - 200.600).
TP2: The recent highest peak (~201.200).
Stop Loss: Place it below the BUY ZONE (~198.800).
Scenario 2 (Short-Term Sell - Secondary Plan):
Strategy: A short-term trade, against the main trend.
Entry: Consider a short-term sell trade when the price retraces to fill the Imbalance (~199.600 - 200.400) or touches the OBS zone (~200.400 - 200.600).
Reasoning: This scenario capitalizes on the corrective downward move before the price potentially turns around.
Take Profit: The BUY ZONE OB (~199.000).
Stop Loss: Place it above the peak of the OBS zone (~200.800).
Conclusion:
The primary trading plan is to wait for a buy entry in the BUY ZONE OB because it aligns with the main trend and offers a better risk-to-reward ratio. The sell scenario should be treated as a short-term, higher-risk trade, going against the primary trend. Strict risk management is essential for both scenarios.
J-jpy

USD/JPY(20250910)Today's AnalysisMarket News:
U.S. employment data was significantly revised downward, with the number of jobs for the 12 months ending in March revised down by 911,000.
Technical Analysis:
Today's Buy/Sell Levels:
147.08
Support and Resistance Levels:
148.32
147.85
147.55
146.60
146.30
145.84
Trading Strategy:
On a breakout above 147.55, consider a buy entry, with the first target at 147.85.
On a breakout below 147.08, consider a sell entry, with the first target at 146.60

USD/JPY(202509008Today's AnalysisMarket News:
Non-farm payroll growth fell significantly short of expectations, with June's data revised downward to negative territory, marking the first contraction since 2020. The unemployment rate hit a nearly four-year high.
Technical Analysis:
Today's buy/sell levels:
147.57
Support and resistance levels:
149.28
148.64
148.23
146.92
146.51
145.87
Trading Strategy:
On a breakout above 148.23, consider a buy entry, with the first target price being 148.64.
On a breakout below 147.57, consider a sell entry, with the first target price being 146.92

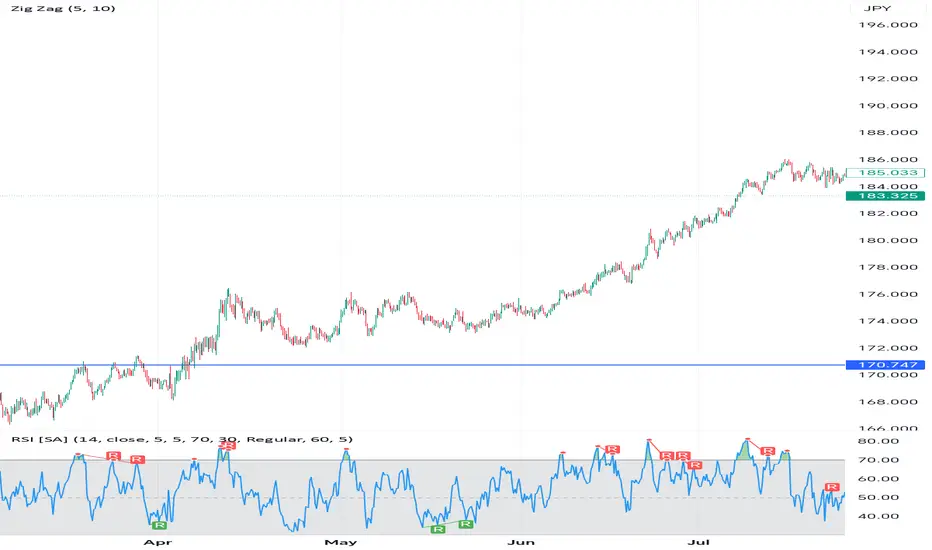
CHF/JPY 4H Technical Analysis – Bulls Still in ControlThe CHF/JPY currency pair has been on a strong bullish run since April, with price moving in a clear uptrend of higher highs and higher lows. On the 4H chart, the pair recently reached the 185.03 resistance zone before retreating slightly, which now raises the question: can the bulls sustain momentum, or is a correction due?
Trend Overview
The medium-term structure remains bullish as price continues to respect the rising trend.
Since breaking above 176.00, buyers have consistently pushed the pair higher, reflecting strong Swiss franc demand against the yen.
Current market action suggests consolidation after the latest rally, with traders carefully watching the 185.00–186.00 level.
Resistance Zones:
185.00 – 186.00: Recent swing high, potential selling pressure.
190.00: Major psychological barrier if bulls break higher.
Support Zones:
183.00 – 182.50: Short-term demand zone where buyers may re-enter.
180.00: Next key downside level if 183.00 fails.
170.75: Major structural support, unlikely to be tested unless a deep correction occurs.
Momentum Indicators
RSI (14): Currently sitting near the mid-range (50–55), suggesting neutral momentum after a strong overbought reading earlier this month.
RSI rejected several times above 70 in recent weeks, pointing to potential exhaustion at higher levels, but no confirmed bearish divergence yet.
Bullish Outlook
If price holds above 183.00, bulls could attempt another breakout above 185.00.
A successful close above 186.50 would likely open the path towards 190.00.
Bearish Outlook
A failure to hold the 183.00 – 182.50 zone may trigger deeper correction towards 180.00.
Breaking below 180.00 would shift momentum and expose 176.50 – 174.00.
Trading Plan (Educational Only – Not Financial Advice)
Bullish bias remains intact.
Consider buying on dips above 183.00 with targets at 185.00 and 186.50.
Alternatively, look for sell opportunities if price rejects strongly at 185.00–186.00 with bearish confirmation signals.
Risk management is crucial, as the pair has shown strong volatility in recent weeks.
Conclusion
The CHF/JPY pair remains in a dominant uptrend, but traders should stay cautious as price approaches the heavy resistance at 185.00–186.00. A breakout above this level could fuel a rally toward 190.00, while a rejection may bring a healthy correction back to 180.00 support.
USDJPYIt looks like price completed its objective just before Friday’s news release, after which USD dropped sharply. From a technical perspective, structure has flipped from bullish to bearish. A clean correction to the upside into the 148.0 supply zone followed by a drop would make perfect sense. I’ll be watching to see if this develops into a swing move.

AUDJPY SELLSCurrent price action is bearish, with downside momentum confirming bearish order flow. Before considering shorts, I reviewed where price previously pushed higher and identified a key daily demand zone — an unmitigated wick that sparked the last major bullish move. This is important context: even though the 4H structure is bearish, bulls could still step in with enough volume to break supply.
I unfortunately missed the long entry at that demand zone, which would have been an ideal trap for a win–win scenario. For now, I’ve marked the nearest supply zone. Price just missed tapping into it, so I’ll patiently wait for when it taps. And then I’ll look for confirmation to enter shorts if the opportunity sets up.

Gbpjpy - Buy Setup - It appears you are inquiring about GBP/JPY, the currency pair representing the exchange rate between the British Pound Sterling (GBP) and the Japanese Yen (JPY). This pair indicates how many Japanese Yen are needed to purchase one British Pound. As of March 28, 2025, the GBP/JPY exchange rate was approximately 193.94 JPY, reflecting a decrease of 0.85% from the previous trading session .
The GBP/JPY pair is known for its volatility, influenced by factors such as economic indicators, interest rate differentials between the UK and Japan, and geopolitical events. Traders often monitor this pair closely due to its potential for significant price movements.
For real-time charts, historical data, and technical analysis, platforms like TradingView provide comprehensive resources . Additionally, financial news outlets such as Reuters offer up-to-date information on exchange rates and market trends .
If you have specific questions about GBP/JPY or need further details, feel free to ask.
Looking for sellside in USDJPY...Hello traders!
Yen gave the draw targets as I had previously outlined on X and TradingView & now we're looking for sellside.
As long as price is held below the daily ifvg, I'm bearish.
Already executed a scalp today on the 15 seconds chart in alignment with the said draw.
Not financial advice.
GLGT.

CHFJPY- ORDER FLOW ANALYSIS CHFJPY BullishThis currency pair is still bullish, now bulls are ready to make new Higher high, Waiting for a buy signal on lower timeframe.

Advanced Trading With DataBase Part -2 #Nse #BseDefine Your Risk Tolerance and Goals: Before diving into options trading, assess your risk tolerance and establish clear trading objectives. Understand how much risk you’re willing to take on and what you aim to achieve.
Diversify Your Options Strategies: Spread your risk by using various options strategies. Consider covered calls, protective puts, and other approaches to safeguard your investments.
Set Entry and Exit Points: Determine specific levels at which you’ll enter and exit trades.
Having clear guidelines helps you avoid emotional decisions during market fluctuations.
Limit Maximum Risk Per Trade: When buying options, consider using debit spreads. These allow you to define your maximum risk upfront while still benefiting from potential gains.
Allocate Capital Wisely: Allocate a specific portion of your capital to each trade. Avoid overcommitting to any single position.
Diversify Across Underlying Assets: Spread your options positions across different stocks or indices. This diversification helps mitigate risk associated with individual assets.
Monitor and Adjust: Stay informed about market conditions and adjust your positions as needed. Be flexible and adapt to changing circumstances.

Moving to the upsideEURJPY is looking for a movement to the upside, wait for the correction & expecting target to reach at 165.350

Movement to the downsideEURJPY is looking for the downside expecting target at 162.600 & clear movement to the downside.

Looking for ShortGBPJPY is looking for short after forming reversal formation & clear movement to the downside to reach at 189.500

Looking for LongGBPJPY is looking for buying opportunity after forming larger flag & expecting a movement to the upside. Target to expect at 195.000


Reaching at 147.200USD/JPY has forming a correction for a movement to the downside, expecting to reach at 147.200 for short term.

usdjpy long setup usdjpy long setup after liquidity breach
if we can find internal liquidity between

gbpjpygbpjpy is in bullish mode
if bos is broken and it's coming back to demand zone and we can look for long oppertunity at demand zone

GBPUSD | 1D | my view Please be careful with this pattern most of the time it gives false breakouts and sudden fall, sometimes it takes a retest and creates a bullish setup, if we see a rejection from the resistance level we can look for shorting opportunities, if we see a successful breakout retest and bullish confirmation candles then we can go for the long position. (only enter if we get a confirmation candle, do not enter in a trade early or without analysing the chart)

Mutiny Sends Ruble to Lowest in 15 Months Mutiny Sends Ruble to Lowest in 15 Months
In one of the most turbulent trading sessions this year, the Russian ruble reached its lowest point against the US dollar in nearly 15 months on Monday. This decline followed the failed mutiny attempt by The Wagner group’s armed mercenaries over the weekend, which caused significant concern among traders. Initially catapulting to approximately 87 rubles per US dollar, the ruble later recovered some of its losses, settling at around 84.40, down 0.90% against the greenback.
The Wagner group, led by troops loyal to their leader, made an unexpected advancement toward Moscow, covering hundreds of miles before eventually reversing course. In a deal struck with the Kremlin, it is reported that the group's leader, Prigozhin, will go into exile in Belarus. This incident is regarded as the most significant challenge to Vladimir Putin's rule and could weaken his leadership.
The armed uprising also caused volatility in other markets. The international benchmark, Brent crude, rose by 0.8% to approximately $74 per barrel. The trading volume between the Russian ruble and Tether's USDT nearly quadrupled from $4 million on Saturday to $15 million on Sunday.
In other developments, the Japanese yen strengthened by 0.11% against the US dollar, trading at 143.50 per dollar. Vice Finance Minister for International Affairs, Masato Kanda, stated that Japan was not ruling out intervening in the currency markets again. He expressed concerns about the yen's rapid and one-sided depreciation against the dollar. Japan previously intervened in the foreign exchange markets in September and October of the previous year when the yen hit a 32-year low of nearly 152 per dollar.

GBPJPY sell setup right now workingGBPJPY can make a reversal and going down to 169.500 and below which we may see the actual trend bearish or it's just a correction . So , to be on a safe side with the stop loss above this week's high and target at the above price .You can get a great risk- reward .
Enjoy trading
Trade only with what you can lose
Happy week

AUD/JPY Near Important Level.price has reached near previous 25 days high, at an important level of 90.15 , if this level is broken than the price can go upto a target of 90.900 and then 91.33. price is above 200 moving average right now if it shows weakness and closes below 200 MA than a short trade can be taken below 89.5 and target of 88.65 can be achieved .
note- trade must be taken only after an 1 hr candle close below/above the level.
