RSI based Crude Oil StrategyRSI Based Strategy on commodity.
We can use RSI in two timeframe to identify Bullish and bearish sentiments.
5 & 15 Mins timeframe is best for intraday Trading.
Add two set of chart of RSI and make upper rsi band at 60 and lower rsi band at 40.
In 15 min timeframe, if upper band value greater than 60.it means we have to find out buy trade. And RSI lower band is less than 40, we have to find out sell trade.
J-OIL

crude oilCrude weekly bottom with deep crab then upside 2.41% level
now completed reciprocal ab=cd with previous support area
in 4 hour try to forming head and shoulder pattern
Buy suggested above the closing of 6760 for the target of 7663-8556-9399-10005
holding trade.

Oil and Gas in focus ONGC The stock ONGC has been trading with a higher high and higher low price formation.
Today, the stock broke out from a this horizontal line on above average volume.
Upward Momentem possible
Comment All your Views

OIL - Ichimoku Bullish Breakout Stock Name - Oil India Limited
Ichimoku Cloud Setup :
1). Today's close is above the Conversion Line
2). Future Kumo is Turning Bullish
3). Chikou span is slanting upwards
All these parameters are showing bullishness at Current Market Price
and more bullishness AFTER crossing 225
#This is not Buy and Sell recommendation to any one. This is for education purpose and a helping hand to learn trading in Market.
# Cloud Trading
# Ichimoku Cloud
# Ichimoku Followers
I hope you all like my analysis.
Please do share your thoughts into comment section.
Please give a like, share & subscribe for daily analysis.

Clear Cut Flag N Pole Pattern in Crude Oil Clear Cut Flag N Pole Pattern Spotted on Crude Oil 1HR Timeframe Do share your Views.
Thank You.

Gail: Triangle Breakout Gail India
Return potential - 8-10% / 15-16.5%
Risk: 3-6%
Risk::Reward ratio is 1::3 / 1::2.5
- Rest Every thing mentioned in the chart. Use it to plan your trade accordingly...!!!
Do let me know if you find the analysis and insights helpful.
Like and Follow for more ideas like these...!!!
Take care & safe trading...!!!
Disclaimer
- The view expressed here is my personal view
- Past performance is not a guarantee for future predictions
- I have been wrong in the past and can be wrong again in future too
- Use this for educational purpose
- Any decision you take, you need to take responsibility for the same
- It's your hard earned money. Treat it wisely
- Trade / Invest keeping in mind your trading style, goals and objectives, time horizon & risk tolerance
- if trading in F&O, understand that F&O trading involves risk
- Do take proper risk management measures
- Do your own analysis and consult your financial adviser if need be

GAIL - ShortA short-term reversal move can be expected due to profit booking. The market has also peaked and there is a chance for the crude price to increase in the coming weeks. This can also affect the stock price adversely.

IOC: Chart set up suggests Buy on DipsIOC
The stock is in strong territory and has support at 73.5 / 68
Target for the current set up 79 / 84 / 90
Take care & safe trading...!!!
Disclaimer
- The view expressed here is my personal view
- Past performance is not a guarantee for future predictions
- I have been wrong in the past and can be wrong again in future too
- Use this for educational purpose
- Any decision you take, you need to take responsibility for the same
- It's your hard earned money. Treat it wisely
- Trade / Invest keeping in mind your trading style, goals and objectives, time horizon & risk tolerance
- if trading in F&O, understand that F&O trading involves risk
- Do take proper risk management measures
- Do your own analysis and consult your financial adviser if need be

oil is boiling looks like a small breakout next resistance on another trend line but looks like oil is going to boil from here
watch out

brent crude whats next?weak setup on charts ,can see more declines as it is in downtrend
a dual top formation also took place
near term support at 81
trading below key averages

FCPO | End of downsideFCPO has been on the downside for an extended period, corrected huge.
now we are looking for upside movement.
as one can see RSI is also supportive, it may turn upside anytime soon.

USOIL Trading Plan - 17/Nov/2022Hello Traders,
Hope you all are doing good!!
I expect USOIL to go UP after finishing this correction.
Look for your BUY setups.
Please follow me and like if you agree or this idea helps you out in your trading plan.
Disclaimer: This is just an idea. Please do your own analysis before opening a position. Always use SL & proper risk management.
Market can evolve anytime, hence, always do your analysis and learn trade management before following any idea

Next move - Crude Oil - MCX
Expecting next move in Crude Oil - Option A. It may happen from tomorrow 09th Nov

WTIOCUSD(Crude) make or break levelCrude oil making a bearish pattern and still showing the sign of bullishness. Fight between Bull and Bears for the trend to continue. Which way will It go?
Crude respects the levels we analyzed In early posts, shows a good move over the period. The up-trend move after the breakout of the price mark of $87.894, was slowed down after the price tried to breach the overhead resistances of $90 that we suspected to be a major resistance zone. But moreover, there was a diversion which you can see in the picture created on 27/10/22 ( Diversion was found with the help of an indicator known as RSI).
When we see in the 1H chart, the price is showing bullish movement by making pin bars which can mean buyers are getting active around the $87.89 Price mark. But the price will be concerned bullish only when the price sustains above the $90 zone then we can say the view of the counter is bullish and look for buy on dips.
But on another side of the coin, you can see a bearish Head And Shoulder pattern and if the pattern is triggered then I believe Crude can be seen trading in the $83-$84 range shortly, and the view can be changed to sell on really. Until then you need to decide the strategy technics for trading this counter this is my view on the counter until I see the price breaching my analyzed levels

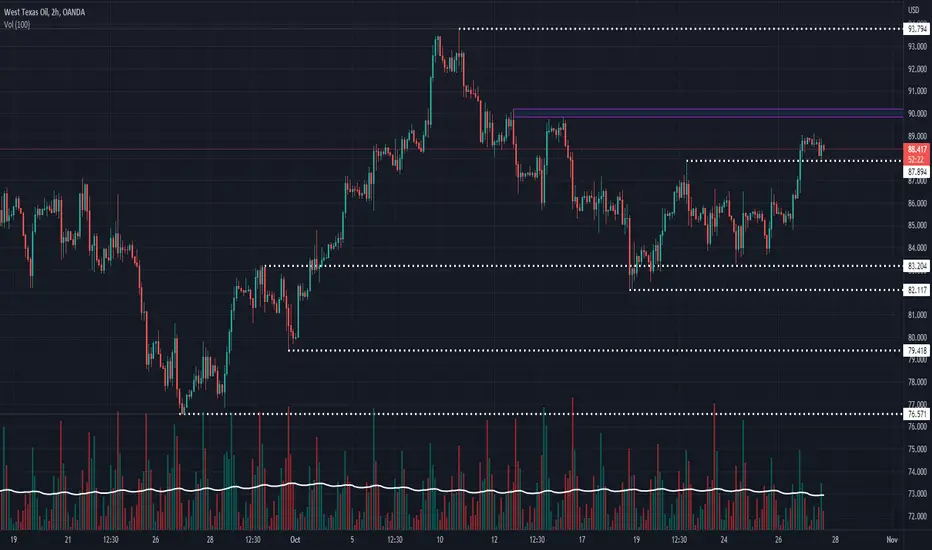
Update on the WTICOUSD(Crude Oil) WTICOSUD(Crude Oil) is showing some interesting movement on major levels. Major upper and lower levels could be breached in the future.
Crude Oil is showing a strong upward movement in the 1Hour chart breaching the level of $87.894. It seems that the counter is consolidating, if the price retests the levels of $87.80 and makes any type of bullish pattern or sign, then the counter can be stated to buy on dips. However, if the price cuts under the $87.80 price mark you can say it’s a falls breakout. It seems to me that the levels from $87.894 to $82.117 are the consolidation zone because of the major support mark of $83.204 to be pressed as per ‘Hourly’ charts like 1H,2H,3H, and 4H respectively.
If the price retests the $87.80 mark shows singings of a bullish move. I see overhead resistances at the price mark of $90.00 and $94.00.
• $90.00 can be considered as overhead resistances since the recent fall after the first structure change breakout. Price was rejected twice from the zone of $90.189 to $89.826 and a major fall was seen, hence the mark of $90 as per the hourly chart
• $94 mark was considered, because of the major fall seen from this mark after the first structure change breakout.
After the signs of a retest of the $87.80 mark, the counter can be considered as “Buy On Dips”(BOD). Then after the First Structure Change in the 1Day chart if the price sustains above the price mark of $94 you can consider the counter going in an uptrend.
There is also the major possibility of the breakdown of crude, considering fundamental things. The major support level that you can see as of now is $83, if the price breaches the zone of $83.204 to $82.117 this counter can be considered as a sell-on really and the price can be seen touching the support levels of $79.418 & $76.571 as well.
In my opinion, if the price breaches the mark of $76.5 and continues to move, and also if the major level in the 1day chart breaks down, then Crude would continue the Downtrend and we can say that this was just a consolidation phase.
Furthermore, support levels in daily and weekly charts are $66.391, $62.069, $33.501 & $11.104 as far as I can see, after creating a Multi Time Frame view(MTF) from an “only chart analysis perspective”. practically speaking these levels aren’t possible in today’s economical times.
“WTICOUSD” is the code for ‘crude oil’ on the ‘trading view’ platform source known as “OANDA” to see the chart I’m talking about.
USOILPrice has brocken out of the channel, we expected price to continue sell side after the consolidation

Brent oil buyers need successful break of $100 to keep controlBrent oil crossed a downward-sloping resistance from mid-June to refresh the monthly top on Friday. However, a sustained break of the 100-day EMA, around $99.50 by the press time, as well as the $100.00 threshold, appears necessary for the buyer’s conviction. Following that, the black gold price could quickly rise towards the 50% Fibonacci retracement of the June-September downturn, near $105.00. In a case where the commodity remains firmer past $105.00, it can easily challenge the July 29 swing high surrounding $111.30.
Alternatively, pullback moves could aim for the previous resistance line, around $95.20 at the latest, a downside break of which could tease the sellers. In that situation, the bear could aim for the weekly support line near $91.50 before rushing toward the $90.00 round figure. It’s worth noting that the oil’s sustained trading below $90.00 won’t hesitate to revisit the multi-month low marked in September, around $83.25.
Overall, Brent oil prices recently overcame one key hurdle to the north but the buyers need validation.

CRUDE OIL BREAK OUT UPSIDE Crude oil past 1 weeks Trading on sideways now its breakout upside Expect upside towards 7000
bottom support 6790/ 6720

Breakdown in Oil India Limited (OIL)...Chart is self explanatory. Levels of breakdown, possible down-moves (where stock may find support) and resistance (close above which, setup will be invalidated) are clearly defined.
Disclaimer: This is for demonstration and educational purpose only. This is not buying or selling recommendations. I am not SEBI registered. Please consult your financial advisor before taking any trade.

What 1-hour chart says? Fundamental Development: Oil prices fell on Wednesday, taking a breather from a near 4% surge the previous day, on receding fears of an imminent output cut by the Organization of the Petroleum Exporting Countries and allies, a group known as OPEC+. Global benchmark Brent crude futures fell 40 cents, or 0.4%, to $99.82 a barrel, after rising 3.9% on Tuesday. The U.S. West Texas Intermediate crude futures contract was down 27 cents, or 0.29%, at $93.47 a barrel, having jumped 3.7% the previous day. Both contracts soared on Tuesday after the energy minister of de facto OPEC leader Saudi Arabia flagged the possibility of supply cuts to balance a market it described as "schizophrenic", with the paper and physical markets becoming increasingly disconnected.
Short Term Technical View: In daily chart XTIUSD is trading below 200 SMA & in 1-hour chart, XTIUSD is trading above middle line of Bollinger band indicator. As per RSI Indicator showing bullishness in 1-hour chart, XTIUSD pivot level is 92.75 as per today 1-hour chart, my view is buy on dip strategy is good for XTIUSD. Buy range of XTIUSD is 92.75 to 92.50 and there is very strong support zone at 91.50.
Alternative Scenario: If XTIUSD will trade above 91.50 and sustain below in U.S. Session so it will be, give great opportunity to sell with the target of 90 with the stop loss of 92.75. (Note: Crude oil inventories at 8 PM IST)

Effect of crude oilBrent crude oil has crossed the mark of 99 , since we know that the rise in oil prices leads to pressurization in paint prices,
Asian paint looks weak though. enter as previous day low breaks for the target of 3281 and 3188.
I am not sebi registered , you are responsible for your profits and losses.

What 1-hour chart says? Fundamental Development: Oil prices dipped on Friday after two days of gain, as market participants weighed worries about global economic slowdown - that could dampen fuel demand - against expectations of tighter supplies toward year-end. Brent crude futures fell 36 cents, or 0.4%, to $96.23 a barrel after settling 3.1% higher on Thursday. U.S. West Texas Intermediate crude was at $90.29 a barrel, down 21 cents, or 0.2%, following a 2.7% increase in the previous session. Still, the benchmark contracts headed for weekly losses of about 1.5%. U.S. CRUDE inventories fell sharply as the nation exported a record 5 million barrels of oil a day in the most recent week, with oil companies finding heavy demand from European nations looking to replace crude from warring Russia.
Short Term Technical View: In 1-hour chart, XTIUSD is trading below middle line of Bollinger band indicator. As per RSI Indicator showing Weakness in 1-hour chart, XTIUSD pivot level is 89.15 as per today 1-hour chart, my view is sell on rise strategy is good for XTIUSD. Sell range of XTIUSD is 90 to 90.25 and there is very strong resistance zone at 91.50.
Alternative Scenario: If XTIUSD will trade above 91.50 and sustain above in U.S. Session so it will be, give great opportunity to buy with the target of 93 with the stop loss of 89.

What 1-hour chart says? Fundamental Development: Oil prices little changed on Thursday as investors grappled with falling stockpiles in the United States, rising output from Russia and worries about a potential global recession. Brent crude futures climbed 15 cents, or 0.2%, to $93.80 a barrel. U.S. crude futures gained 4 cents, or 0.1%, to $88.15 a barrel. Prices rose more than 1% during the previous session, although Brent at one point fell to its lowest since February. Futures have fallen over the past few months, as investors have pored over economic data that has spurred concerns about a potential recession that could hurt energy demand. British consumer price inflation jumped to 10.1% in July, it is highest since February 1982, intensifying a squeeze on households.
Short Term Technical View: In 1-hour chart, XTIUSD is trading at middle line of Bollinger band indicator. As per RSI Indicator showing Weakness in 1-hour chart, XTIUSD pivot level is 87 as per today 1-hour chart, my view is sell on rise strategy is good for XTIUSD. Sell range of XTIUSD is 88.25 to 88.50 and there is very strong resistance zone at 89.50.
Alternative Scenario: If XTIUSD will trade above 89.50 and sustain above in U.S. Session so it will be, give great opportunity to buy with the target of 90.50 with the stop loss of 88.50.
