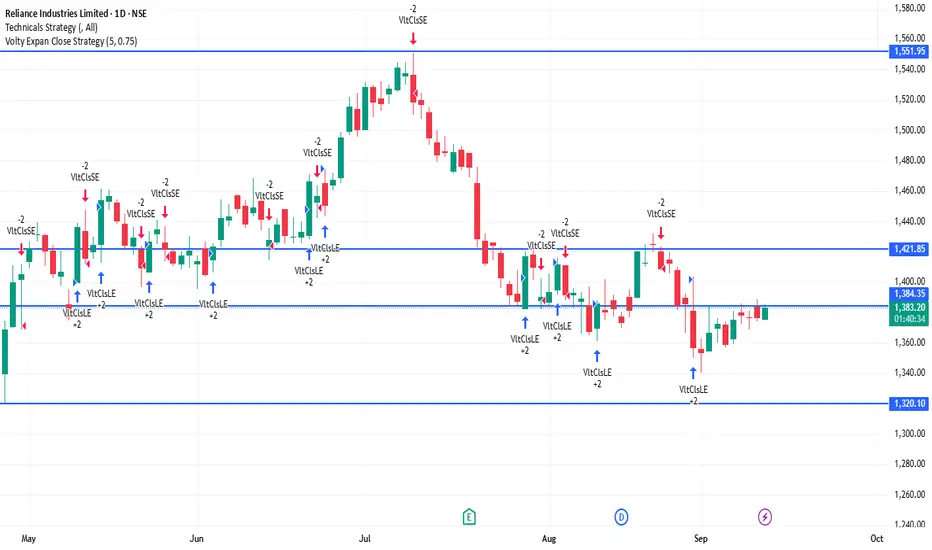
RELIANCE 1D Time frameCurrent Price Action
Reliance is trading around ₹1,384.
Day’s low is near ₹1,375 and high is near ₹1,385.
Price is consolidating in a narrow band after recent gains.
⚖️ Key Levels
Immediate Resistance: ₹1,385 – ₹1,390
Next Resistance: ₹1,400 – ₹1,410
Immediate Support: ₹1,375
Strong Support: ₹1,360 – ₹1,350
📊 Indicators
Moving Averages: Short- and medium-term averages remain bullish, confirming uptrend strength.
RSI (14-day): Around 58–60 → showing bullish momentum, still not overbought.
MACD: Positive crossover → indicates bullish bias.
📈 Outlook
As long as Reliance holds above ₹1,375, the bias stays bullish.
A breakout above ₹1,390 – ₹1,400 can push the stock toward ₹1,410 – ₹1,420.
If it falls below ₹1,375, it could slip toward ₹1,360 – ₹1,350.
JIOFIN
SENSEX 1D Time frame📍 Current Price Action
Sensex is currently trading around 81,577.
Day’s low is near 81,216 and high is near 81,589.
The index is consolidating near recent highs.
⚖️ Key Levels
Immediate Resistance: 81,600 – 81,850
Next Resistance: 82,000 – 82,200
Immediate Support: 81,200 – 81,000
Strong Support: 80,800 – 80,500
📊 Indicators
Moving Averages: Short-, medium-, and long-term averages are in bullish alignment → trend remains positive.
RSI (14-day): Around 60–62 → shows bullish momentum, not in overbought zone.
MACD: Positive, confirming bullish bias.
📈 Outlook
As long as Sensex holds above 81,000, the bias stays bullish.
A breakout above 81,850 – 82,000 can open upside toward 82,500+.
If it slips below 81,000, a pullback toward 80,800 – 80,500 is possible.

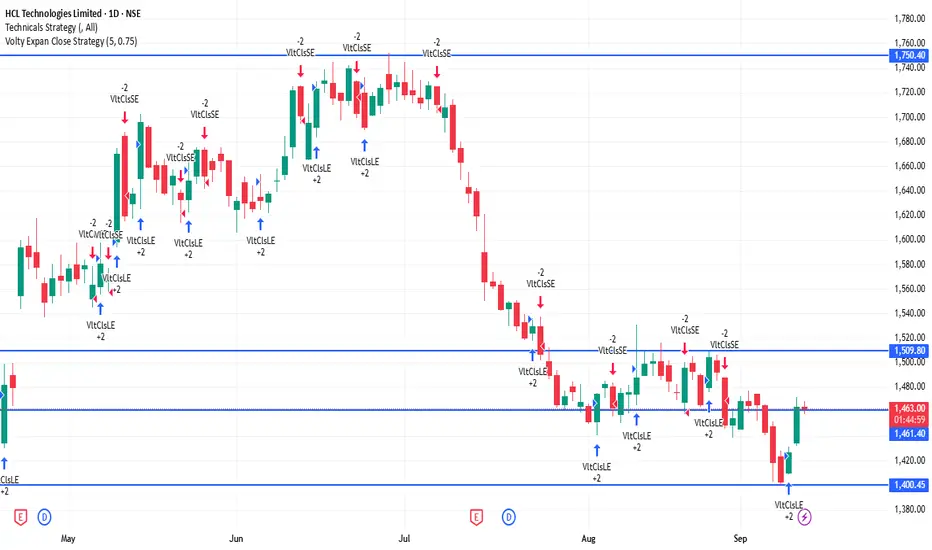
HCLTECH 1D Time frame📍 Current Price Action
HCLTECH is trading around ₹1,464.
Day’s low is near ₹1,458, and high is around ₹1,470.
The stock is consolidating near the upper end of its intraday range.
⚖️ Key Levels
Immediate Resistance: ₹1,470 – ₹1,475
Next Resistance: ₹1,495 – ₹1,500
Immediate Support: ₹1,450
Strong Support: ₹1,430 – ₹1,420
📊 Indicators
Moving Averages: Short-term MAs (5-, 10-day) slightly lagging, medium-term (20-, 50-day) supportive → trend mildly bullish.
RSI (14-day): Around 66 → showing bullish momentum, approaching overbought.
MACD: Positive, indicating mild bullish bias, but momentum is not extremely strong.
📈 Outlook
If HCLTECH holds above ₹1,450, potential upside toward ₹1,470 – ₹1,495 exists.
A breakout above ₹1,475 could open room toward ₹1,500.
On the downside, a drop below ₹1,450 may test ₹1,430 – ₹1,420 support.
Overall bias: Slightly bullish, but caution near resistance.
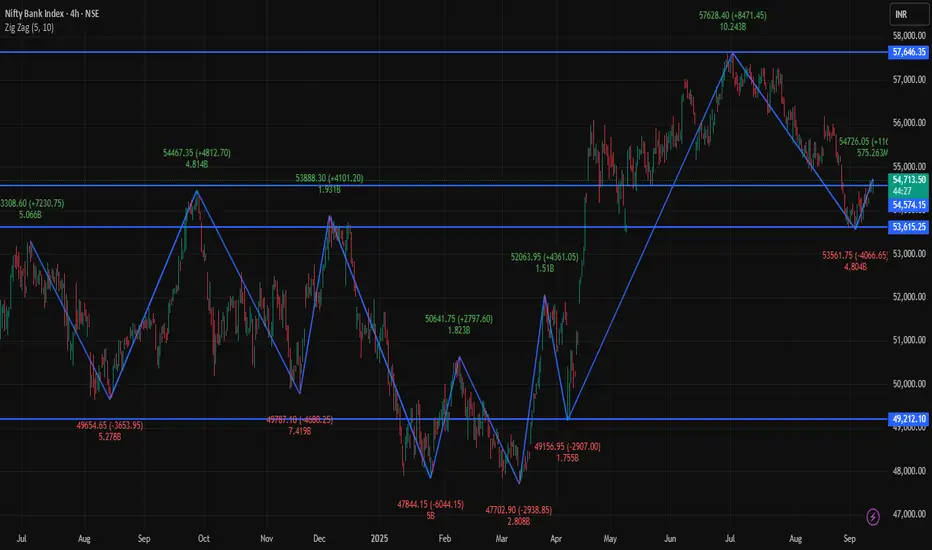
BANKNIFTY 4H Time frameCurrent Snapshot
Current Price around: ₹54,713 - ₹54,600
Day’s Range (4H): ₹54,400 – ₹54,705
Previous Close: ₹54,216
Opening Price (4H): ₹54,554
Volume: Moderate
🔑 Key Support & Resistance Levels
Immediate Support: ₹54,550
Next Support: ₹54,400
Immediate Resistance: ₹54,705
Next Resistance: ₹55,000
📈 Trend & Indicators
Trend: Mildly bullish; trading around 50-hour moving average.
RSI (14): 62 – Neutral to slightly bullish.
MACD: Positive → indicating mild bullish momentum.
Moving Averages: Short-term averages indicate neutral to slightly bullish bias.
🔮 Outlook
Bullish Scenario: Sustained move above ₹54,705 may push toward ₹55,000.
Bearish Scenario: Drop below ₹54,550 could bring a retracement to ₹54,400.
Neutral Scenario: Consolidation between ₹54,550 – ₹54,705; breakout needed for directional move.
📌 Key Factors to Watch
Performance of major banking stocks in BANKNIFTY.
Economic indicators such as interest rates and RBI policy updates.
Global market cues including US indices, crude oil, and currency movements.
SBIN 1H Time framePrice Snapshot
Current price around : ~ ₹818
52-week high/low: ~ ₹875 / ₹680
Recent price action: modest upside from support, but resistance overhead
📈 Indicators & Momentum (Hourly Approx)
Moving Averages (short-period) are just below current price → giving support
Medium/longer hourly MAs (20-50 hr) are above → resistance zones
RSI (1-hour): neutral to slightly bullish, not overbought yet
Momentum indicators show mild strength but not a breakout — watching for volume to confirm
🧭 Short-Term Outlook
Bullish scenario: If SBI holds above ~₹820 and breaks past ~₹825-830, upward target could be ~₹840+
Bearish scenario: If it loses support around ~₹805-810, risk of pullback toward ~₹800 or below
Bias: Slightly bullish in the short term, provided support holds and resistance tests are successful

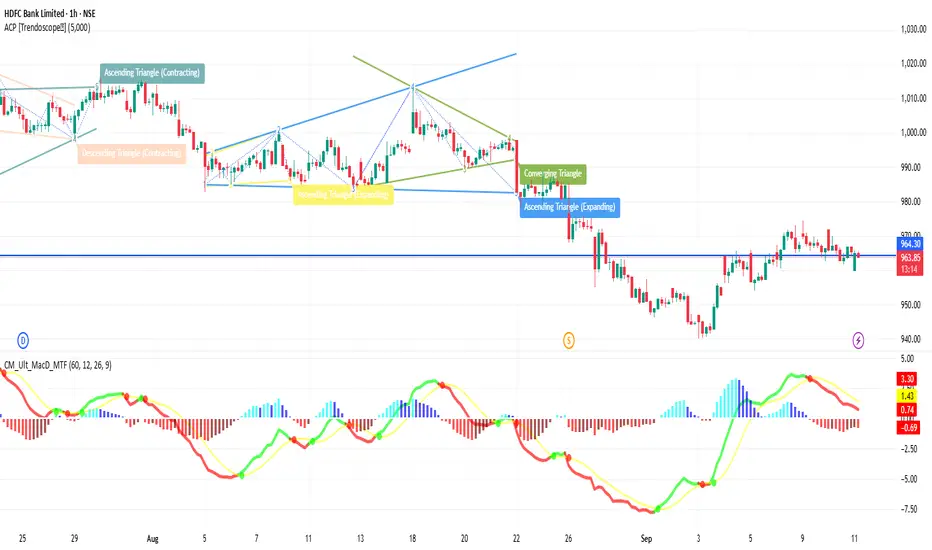
HDFCBANK 1H Time frameKey Price & Market Info
Current Price: ~ ₹960-965
52-Week Range: ~ ₹806 – ₹1,018
Daily Range (recent): roughly between ₹959 – ₹966
🔎 Technical Indicators & Momentum
RSI (14-hour): ~ 42-45 → Neutral to mildly weak
MACD (hourly estimates): Slightly negative → some bearish pressure
ADX (trend strength): Moderate (~20-25) → trend is present but not very strong
Moving Averages:
Short-term (5-10 hour) MAs seem to be acting as minor resistance/support zones near current price
Mid-term MAs (50-hour) are above the price → resistance upward
Long-term support (200-hour MA) is well below current price → that gives some downside cushion
🔧 Support & Resistance (1-Hour)
Immediate Resistance: ~ ₹970-975
Near Resistance Zone: ~ ₹985-₹990
Support Levels: ~ ₹950-₹955 first, then ~₹940 if weakness increases
🧭 Short-Term Outlook
Bullish Case: If price breaks above ~₹970-975 with volume, upward move toward ~₹985+ might be possible.
Bearish Case: Failing resistance and dropping below ~₹950 might test lower support ~₹940.
Overall Bias: Slightly bearish to neutral—more inclined to expect consolidation or minor pullback unless strong upward catalyst appears.
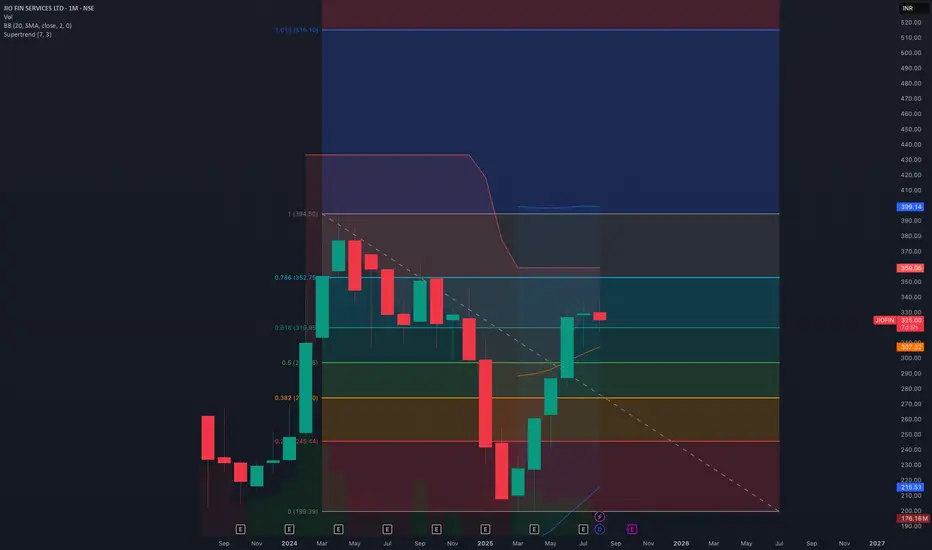
JioFin Viewcompany has started landing and also, it is backed by two mammoth orgs which has years of experience in finance as well as in distribution.
Worst is over for the company and IMO it should now head north only.
Possible if it catches the trend and tick all the boxes it may surprise investors on the returns side.
CMP: 325
SL: 280
TARGET: 525
Time Frame: 12 Months
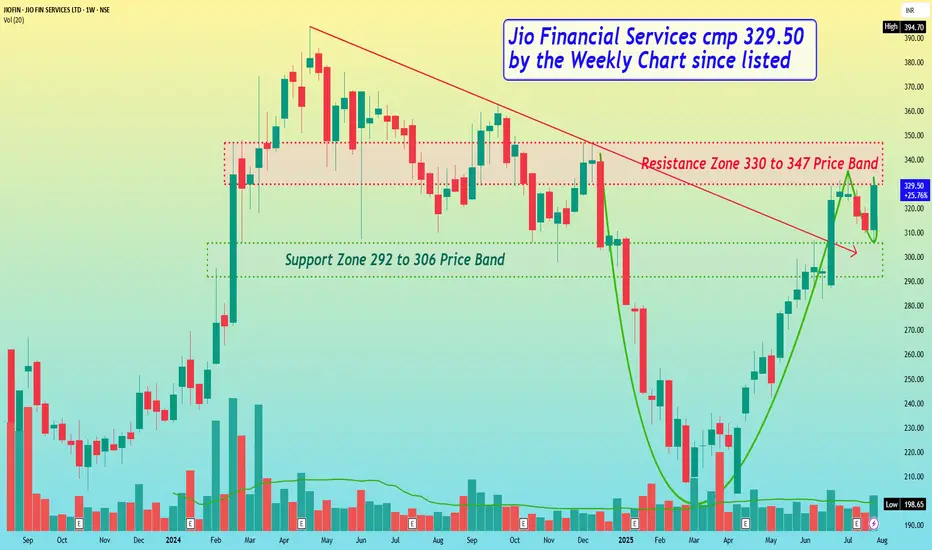
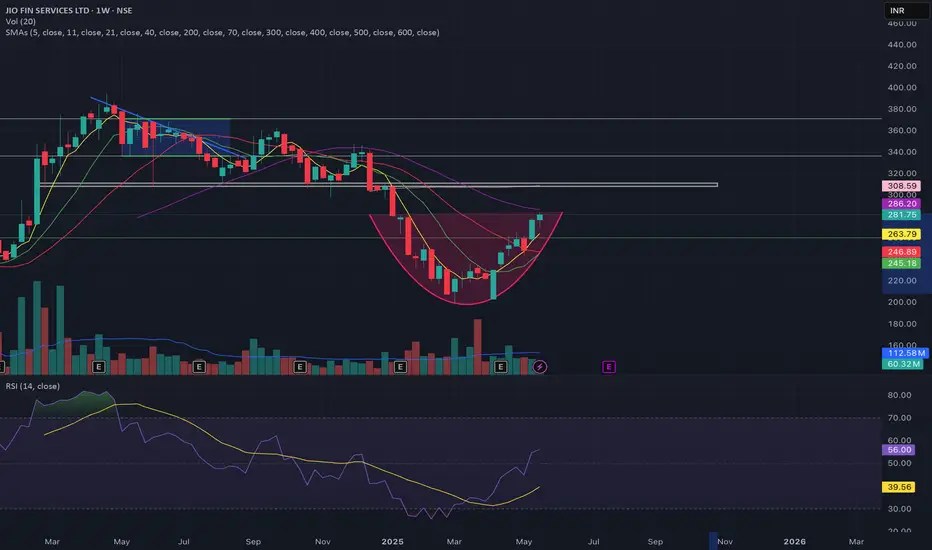
Jio Financial Services cmp 329.50 by the Weekly Chart since listJio Financial Services cmp 329.50 by the Weekly Chart since listed
* Support Zone 292 to 306 Price Band
* Resistance Zone 330 to 347 Price Band
* Price Breakout from Falling Resistance Trendline
* Volumes getting in sync with average traded quantity
* Bullish Cup and Handle done with Resistance Zone neckline
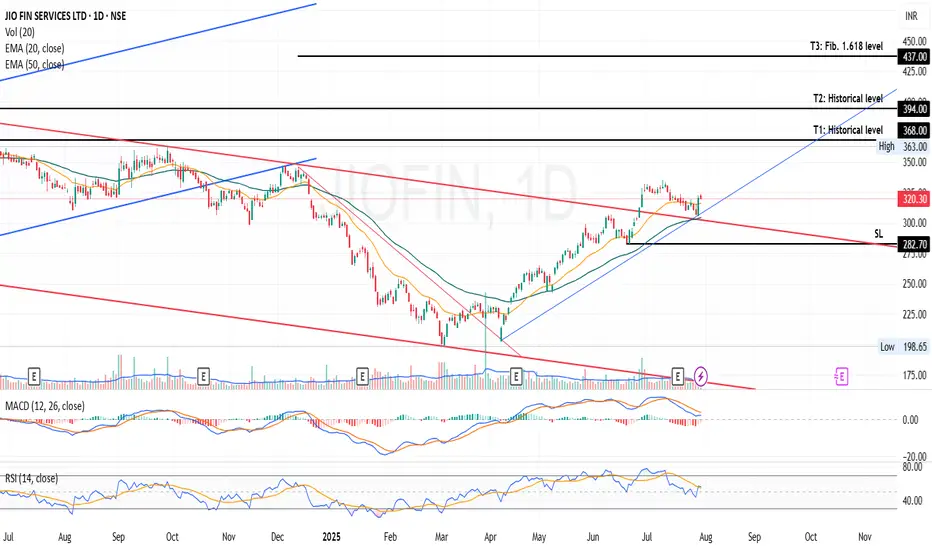
Jio Financial Services Ltd - Breakout OpportunityDate : 30-Jul-2025
LTP : Rs. 320.30
Targets: (T1) Rs. 368 --> (T2) Rs. 394 --> (T3) Rs. 437
SL : Rs. 282
Technical View:
• NSE:JIOFIN was going through primary downtrend since Apr 2024. From it's lifetime high of 394.70 in Apr 2024, it has retraced 50% to 198.65 in Mar 2025.
• From Apr 2025, NSE:JIOFIN has started moving in secondary uptrend within its primary downtrend and had given a breakout from its primary downtrend on 26-Jun-2025 with higher than average volume.
• on 28-Jul-2025, NSE:JIOFIN has re-tested the downtrend line and bounced back closing above 20 DEMA.
• NSE:JIOFIN is currently trading above 20 DEMA and 50 DEMA.
• MACD is trading at 2.38 and RSI is trading at 56.18.
• Looking good to continue the current momentum.
If you have liked this analysis, please Boost/Like this idea and follow my ID for more ideas.
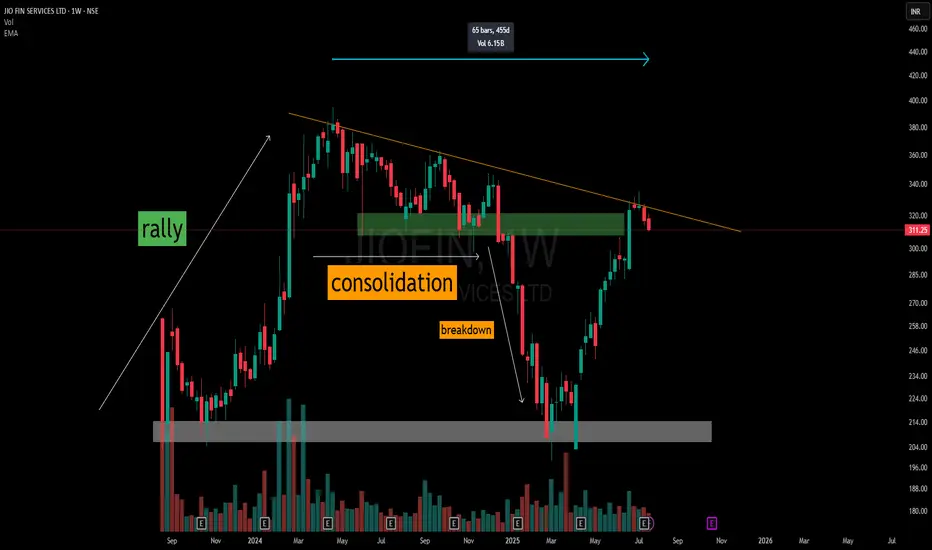
455-Day Counter Trendline | From Breakdown to V-RecoveryThis weekly chart of Jio Fin Services Ltd illustrates a multi-phase price structure over 455 days:
🔹 Initial Rally — Kicks off from a defined accumulation base (grey zone), marking the start of a strong impulse leg.
🔹 Consolidation Phase — Price enters a descending triangle formation just below a historical resistance band.
🔹 Breakdown — Clean breakdown from the triangle pattern sends price sharply downward.
🔹 V-Shaped Recovery — A strong reaction off the original base zone leads to a sharp reversal.
🔹 Back to the 455-Day Counter Trendline — Price now tests the long-standing counter trendline, which has remained intact throughout.
📌 This chart demonstrates how historical price structures—especially well-defined base formations and trendline resistances—continue to act as critical reference points for future price action.
🛠️ No predictions here. Just a structured breakdown of price behavior and major decision zones traders are often drawn to.
Jio Financial Services (JIOFIN) at ₹316.45**Jio Financial Services (JIOFIN) at ₹316.45: Premium Play or Future Powerhouse?**
Jio Financial Services (JIOFIN) trades at ₹316.45, a massive entity with over ₹2.01 lakh Cr market cap, backed by the Reliance ecosystem. The question for traders and investors: Is its significant premium justified?
**Key Insights:**
* **Strong Backing & Shareholding:** Promoters hold 47.12%, with healthy institutional presence (DIIs 14.78%, FIIs 12.30%). This indicates significant confidence from core stakeholders.
* **Financials: Growth & Investment-Centric:** Sales saw a decent 10% growth (Mar'25 vs Mar'24), with Operating Profit jumping 27% to ₹1,977 Cr. OPM remains high at 76%. However, 2024 cash flow from operations was negative, heavily reliant on investing activities, suggesting its current model is more investment/holding company-like.
* **Staggering Valuation:** JIOFIN's P/E of 124.80 dwarfs peers like Bajaj Finance (P/E 36.10) and SBI Cards (P/E 44.50). This isn't about current earnings; it's a massive bet on future disruption.
* **Price Action & Volatility:** Despite its pedigree, JIOFIN's 1-year return is -5.45%, and it shows significant monthly volatility. This reflects the market's ongoing price discovery for a stock valued heavily on future potential.
**The Black Belt Take:**
JIOFIN is a high-conviction, high-valuation play. It's a bet on Reliance's ability to revolutionize India's financial sector.
* **For Traders:** Expect continued volatility. Short-term opportunities exist, but precise risk management is non-negotiable given the valuation sensitivity.
* **For Investors:** This is a long-term "future growth" story. Consider accumulating on significant dips if you believe in its disruptive potential. For the conservative, waiting for more established operational cash flows and a more reasonable valuation might be prudent.
Is the "Jio Factor" enough to justify this premium, or should investors wait for the fundamentals to catch up?
---
**Disclaimer:** This article is for educational purposes only. Please consult a SEBI-registered financial advisor before making investment decisions.

Jio Finance Jio finance could test below support 📉 at 300 within 25th July 2025 marked on the chart
Disclaimer :
It's a personal view not a financial advice and I assume no responsibility and liability whatever outcome arises.

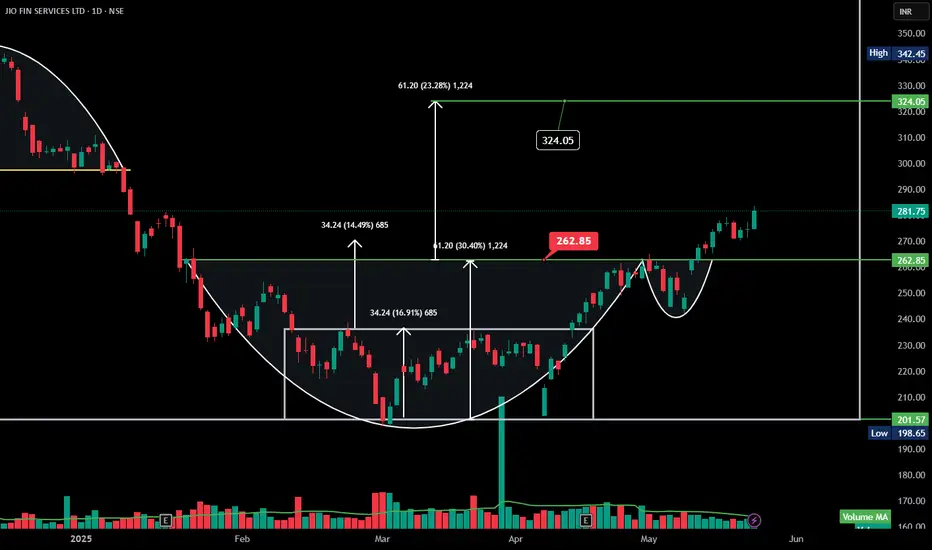
JIOFIN | Cup & Handle | Daily
### 🏦 \ NSE:JIOFIN (Jio Financial Services) – Cup & Handle Breakout
🔍 **Pattern:** Cup & Handle
📈 **Breakout Level:** ₹306.50
🎯 **Target:** ₹324.05 (+5.6%) | Extended target: ₹347.35
📉 **Stop-loss suggestion:** Below ₹282.85
📊 **Volume:** Strong surge confirms breakout
🔁 **Structure:** Cup → Handle → Breakout
🧠 **Context:** Recovery after consolidation from 52-week high
🧾 **Insights:**
* Major cup formed post-downtrend with deep consolidation near ₹200
* Breakout from smaller handle within larger bullish structure
* Volume spike validates the bullish intent
* Multiple higher lows with strong buyer participation
📌 **Bias:** Bullish above ₹306.50
> Textbook breakout with volume confirmation. Watch for retest near ₹306–₹308 as buying opportunity.
\#JioFinancial #NSE #TechnicalAnalysis #BreakoutTrading #CupAndHandle #StocksToWatch


JIOFIN ready to give a breakout with target of 360CUP formation in W.
Support visible on the MA.
Presently at resistance.
Next resistance at 310.
RSI above 50.
Wait for breakout for target of 360
JIOFIN | Cup & Handle Breakout! Target ₹324 Here is the **technical analysis** for **JIO FIN SERVICES LTD (NSE)** based on your chart:
---
### 📊 **Technical Analysis – JIO FIN SERVICES LTD**
**Pattern Identified:** Cup and Handle
**Breakout Level:** ₹262.85
**Target Price:** ₹324.05
**Current Market Price:** ₹281.75
**Potential Upside:**15% from current levels
---
### ✅ **Bullish Signals:**
* **Cup and Handle Formation:** A textbook bullish continuation pattern signaling accumulation followed by a breakout.
* **Breakout Confirmation:** Price has broken above the resistance zone (₹262.85) with strength and follow-through buying.
* **Volume Confirmation:** Breakout was accompanied by higher-than-average volume, reinforcing the validity of the pattern.
* **Measured Move Target:** Based on the cup depth (₹61), the projected target is ₹324.05.
---
### 📌 **Key Levels:**
* **Immediate Resistance:** ₹324.05 (target zone)
* **Support Zones:**
* ₹262.85 (handle breakout support)
* ₹201.57 (previous swing low, base of cup)
---
### 📈 **Conclusion:**
JIO FIN SERVICES is displaying strong bullish momentum after confirming a **Cup and Handle** breakout. As long as the price holds above ₹262.85, the stock may trend toward ₹324+. A retest of the breakout zone can be a good opportunity to accumulate.
---
YOUR EVERYDAY BANKJio Financial - CMP 280
JFSL was originally incorporated as Reliance Strategic Investments Private Limited in July, 1999 under the Companies Act 1956. Jio Financial Services Limited was incorporated in July, 23. JFSL is a NBFC-ND-SI registered with RBI. The company is a holding company and will operate its financial services business through its consumer-facing subsidiaries namely Jio Finance Limited (JFL), Jio Insurance Broking Limited (JIBL), and Jio Payment Solutions Limited (JPSL) and joint venture namely Jio Payments Bank Limited (JPBL). Jio Financial Serv
This is just to boost my confidence. No Suggestions for buying. I will keep checking and updating my mistake if last post gone wrong...
Disclosure: I am not SEBI registered. The information provided here is for educational purposes only. I will not be responsible for any of your profit/loss with these suggestions. Consult your financial Adviser before making any decisions.

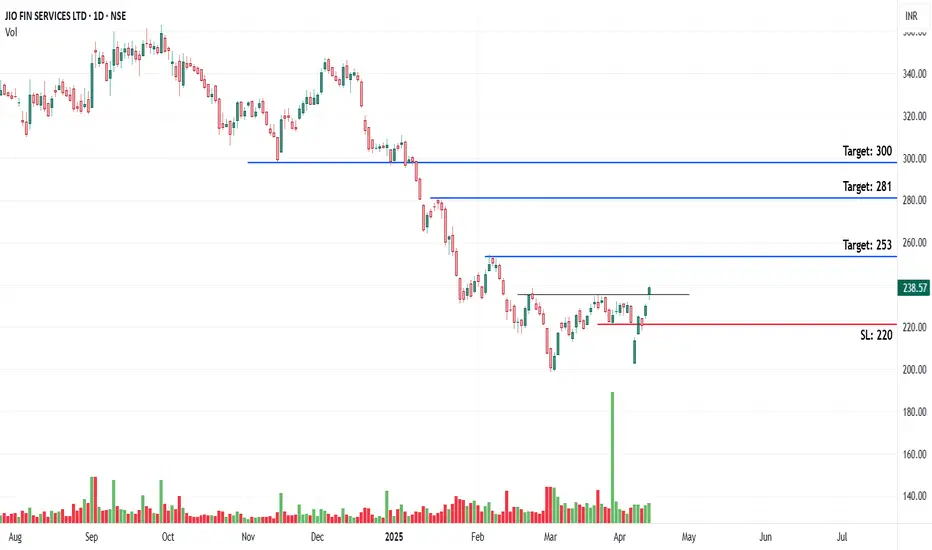
Double bottom breakout in JIOFINChart -> JIOFIN Daily
CMP: 238
Good Range to Buy: 230 to 240
Targets: 253, 281, 300
SL: 220 Daily Close
Disclaimer: This is for educational purposes only, not any recommendations to buy or sell. As I am not SEBI registered, please consult your financial advisor before taking any action.
Jio Finance Technical Weekly Time Frame#jiofin Financial Services #JFS is a significant player in the Indian financial sector, known for its digital-first approach to financial services. Here's an overview based on recent information #

Jio - Short Term Trade - LongJio could have completed correction. But difficult to say.
However, we have 5W down on daily and can look for a pullback to 260.
SL 230.

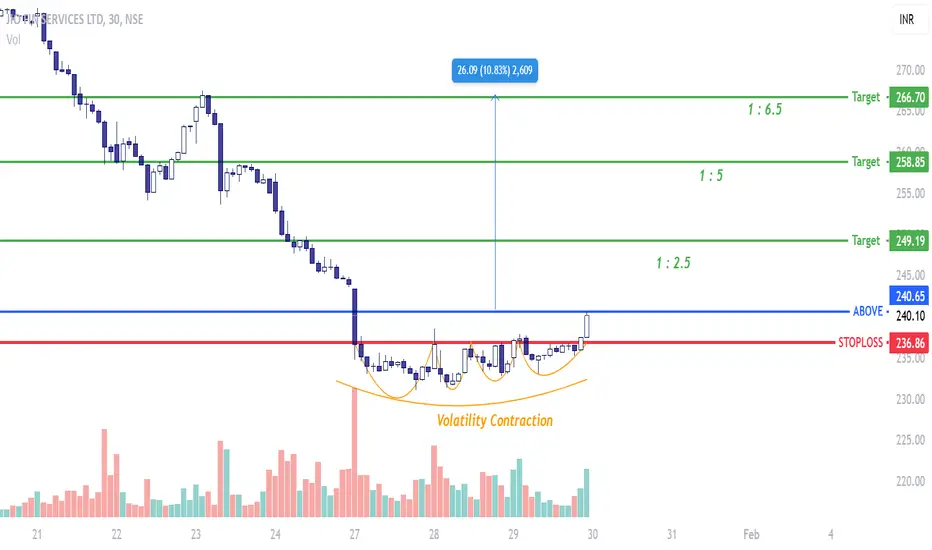
JIO FIN SERVICES - Swing ContenderOn the larger scheme of this this stock has been beaten down and the trajectory is deep negative. However, in the very short term the stock can correct its trajectory and as a trader one can make use of these opportunities.
A volatility contraction has happened forming a base on shorter timeframe. Expecting this stock to perform well over the next 2 days.
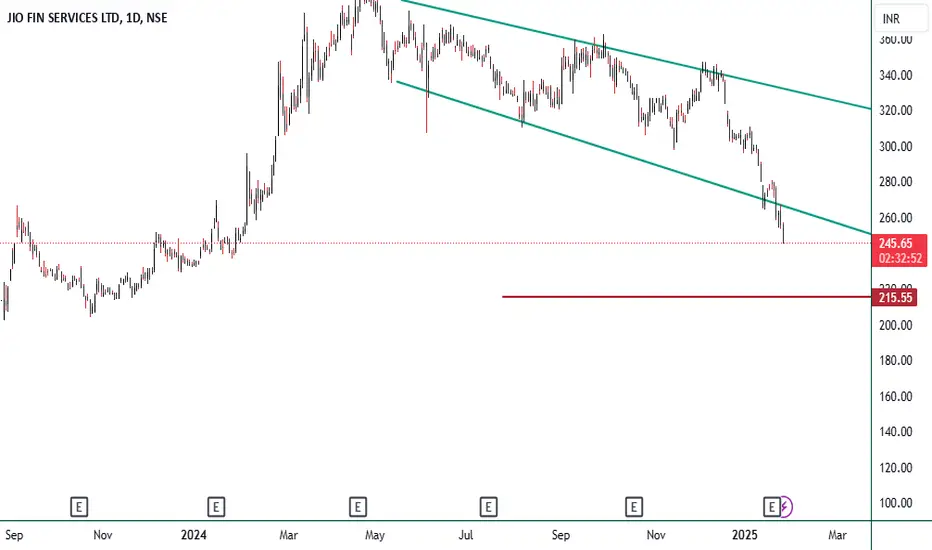
JIOFIN DOWNTREND movement expected upto 216Symbol JIOFIN
TIMEFRAME Day
Analysis Breakout from the descending Triangle.
Target 216
Jio Fin - Plain N Simple Analysis !!!Stock in strong support Zone
Zone area - 265 - 280
Also a Previous Flip Zone
Expecting - Bullish
View negation below 263
Area of Buying - 270 - 278
Upside Targets 330 - 350
Risk Reward - Excellent
