BANKNIFTY 1D Time frame📍 Current Level
₹54,669.60
Short-Term Outlook
Bullish Scenario: A sustained move above ₹55,000 could lead to a test of the 52-week high around ₹57,628.40.
Bearish Scenario: A drop below ₹54,300 may signal a potential pullback toward ₹54,000.
Kotakmahindrabank

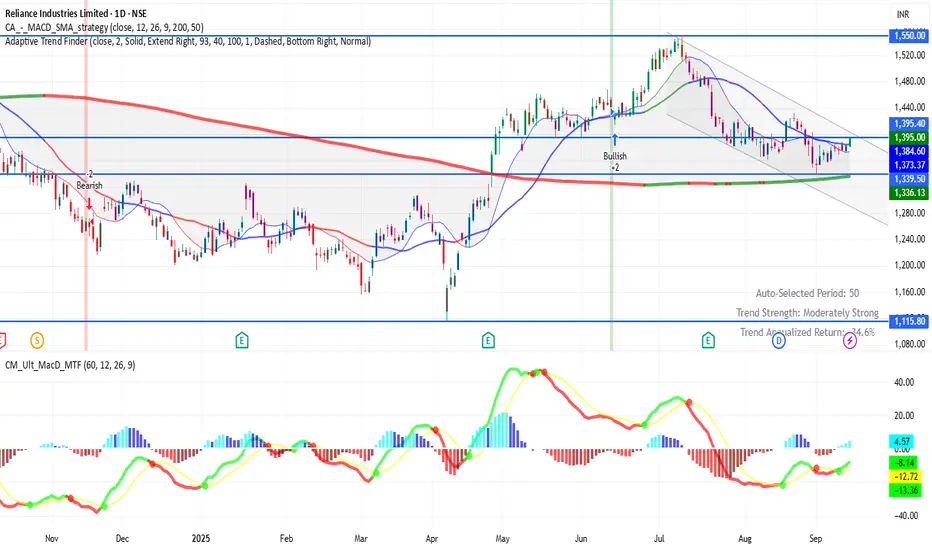
RELIANCE 1D Time frame📍 Current Price
₹1,395.00 (closing price)
Short-Term Outlook
Bullish Scenario: A sustained move above ₹1,400.00 could lead to a test of the 52-week high around ₹1,551.00.
Bearish Scenario: A drop below ₹1,375.00 may signal a potential pullback toward ₹1,350.00.

ICICIBANK 1D Time frame📍 Current Price
₹1,417.70 (closing price)
Short-Term Outlook
Bullish Scenario: A sustained move above ₹1,430 could lead to a test of the 52-week high around ₹1,500.
Bearish Scenario: A drop below ₹1,390 may signal a potential pullback toward ₹1,350.

AXISBANK 1D Time frame📍 Current Price
₹1,105.30 (up 1.64% from previous close)
Short-Term Outlook
Bullish Scenario: A sustained move above ₹1,115 could lead to a test of the 52-week high around ₹1,281.65.
Bearish Scenario: A drop below ₹1,080 may signal a potential pullback toward the ₹1,050 level.

NATURALGAS1! 1D Time frame📍 Current Price
₹261
🔑 Key Levels
Immediate Resistance: ₹268 → ₹272
Immediate Support: ₹257 → ₹253
52-Week High: ₹366
52-Week Low: ₹188
Short-Term Outlook
Bullish Scenario: Sustained above ₹272 → possible move toward ₹280–₹285
Bearish Scenario: Falls below ₹257 → may test ₹253–₹250

RELIANCE 1D Time frame Current Status
Price around ₹1395
Day range: ₹1380 – ₹1396
52-week range: ₹1115 – ₹1551
Key Levels
Support zones: ₹1380 → ₹1370 → ₹1350
Resistance zones: ₹1400 → ₹1410 → ₹1430
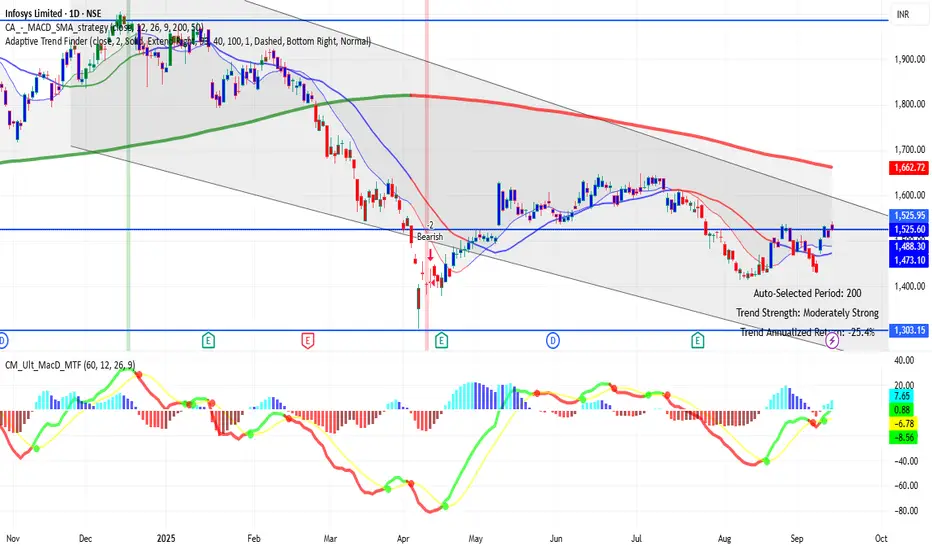
INFY (Infosys) 1D Time Frame Current Status
Price around ₹1525
Positive momentum today
Key Levels
Support: ₹1510 → ₹1500
Resistance: ₹1535 → ₹1545
Outlook
Holding above ₹1510 keeps trend bullish. Break above ₹1535–1545 can push price higher, but falling below ₹1500 may bring weakness.
NIFTY (1D timeframe)📍 Current Level
Trading around 25,114
🔑 Key Levels
Immediate Resistance: 25,150 → 25,200
Immediate Support: 25,000 → 24,950
Deeper Support: 24,800 → 24,600
✅ Outlook
If Nifty sustains above 25,150–25,200, more upside can open up.
If it slips below 24,950–25,000, weakness may extend toward 24,800–24,600.
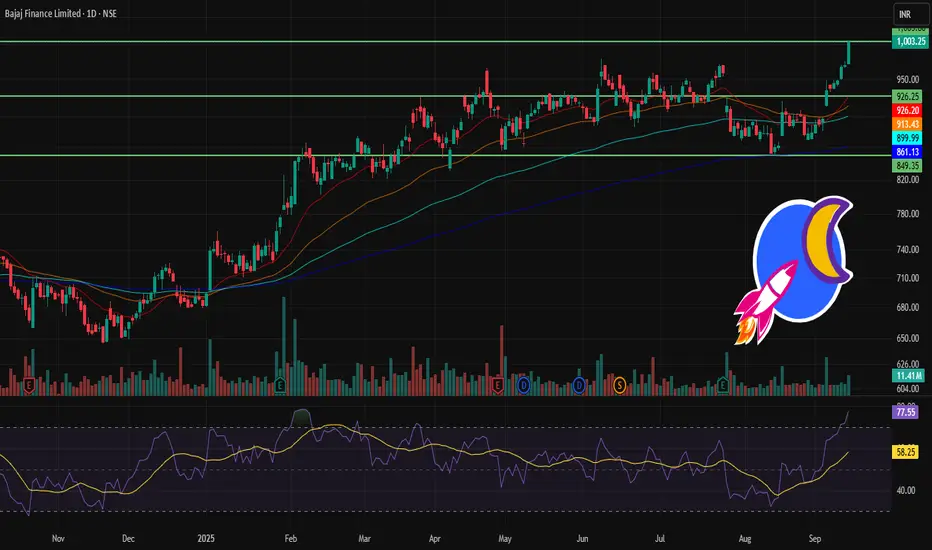
BAJFINANCE 1D Time frame🔢 Current Level
Trading near ₹1,003
🔑 Key Resistance & Support Levels
Resistance Zones:
~ ₹1,020 – ₹1,030 (immediate resistance)
~ ₹1,050 – ₹1,070 (stronger resistance above)
Support Zones:
~ ₹980 – ₹970 (first support)
~ ₹950 – ₹940 (secondary support)
~ ₹920 – ₹900 (deeper support if selling pressure builds)
📉 Outlook
Bullish Scenario: Sustaining above ₹1,000 may drive price toward ₹1,020 – ₹1,070.
Bearish Scenario: A break below ₹980 can drag it toward ₹950 or even ₹920.
Neutral / Range: Likely sideways between ₹980 – ₹1,030 until a breakout.
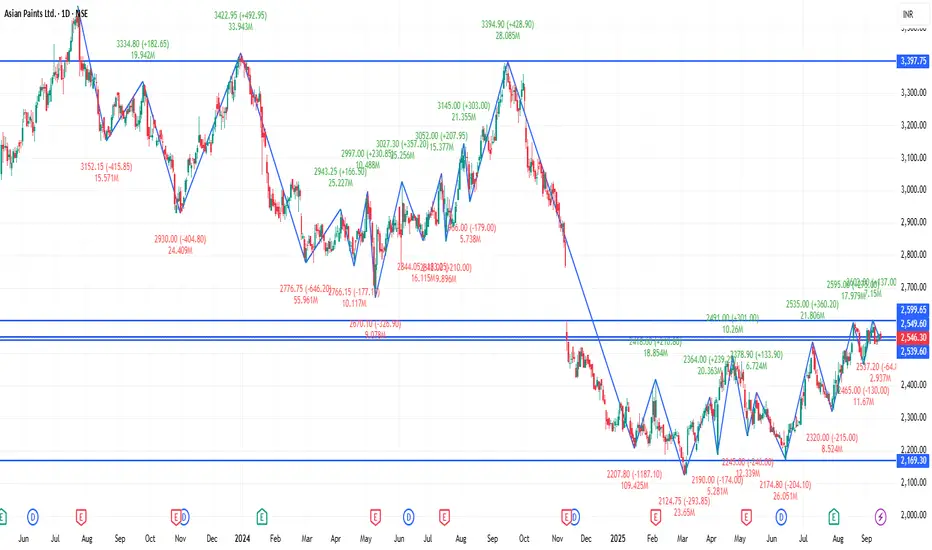
ASIANPAINT 1D Time frame🔢 Current Level
Trading around ₹2,546 – ₹2,560
🔑 Key Resistance & Support Levels
Resistance Zones:
₹2,559 – ₹2,560 (recent highs; breakout above this may lead to further upside)
₹2,580 – ₹2,600 (stronger resistance above)
Support Zones:
₹2,540 – ₹2,545 (immediate support; failure to hold above this may lead to a decline)
₹2,520 – ₹2,530 (short-term support; a break below this could indicate weakness)
₹2,500 – ₹2,510 (deeper support zone if price dips further)
📉 Outlook
Bullish Scenario: If Asian Paints holds above ₹2,545, upward momentum may continue. Break above ₹2,560 can open the way toward ₹2,580+.
Bearish Scenario: If it falls below ₹2,520, risk increases toward ₹2,500 – ₹2,510.
Neutral / Range: Between ₹2,545 – ₹2,560, Asian Paints may consolidate before a directional move.
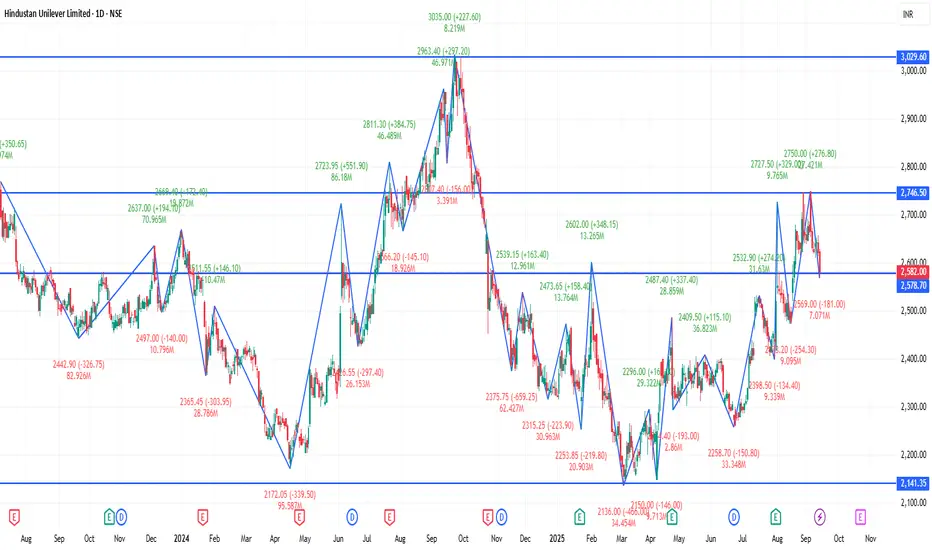
HINDUNILVR 1D Time frame:
🔢 Current Level
Trading around ₹2,578.90 - ₹2,582.00
🔑 Key Resistance & Support Levels
Resistance Zones:
₹2,634.90 – ₹2,636.40 (recent highs; breakout above this may lead to further upside)
₹2,650.00 – ₹2,660.00 (stronger resistance above)
Support Zones:
₹2,569.00 – ₹2,570.00 (immediate support; failure to hold above this may lead to a decline)
₹2,550.00 – ₹2,560.00 (short-term support; a break below this could indicate weakness)
₹2,520.00 – ₹2,530.00 (deeper support zone if price dips further)
📉 Outlook
Bullish Scenario: If HINDUNILVR holds above ₹2,570.00, upward momentum may continue. Break above ₹2,636.40 can open the way toward ₹2,650.00+.
Bearish Scenario: If it falls below ₹2,520.00, risk increases toward ₹2,510.00 – ₹2,530.00.
Neutral / Range: Between ₹2,570.00 – ₹2,636.40, the stock may consolidate before a directional move.
BANKNIFTY 1D Time frame🔢 Current Level
Trading around ₹54,823
🔑 Key Resistance & Support Levels
Resistance Zones:
₹54,900 – ₹55,100 (near-term resistance; breakout above this may lead to further upside)
₹55,200 – ₹55,500 (stronger resistance above)
Support Zones:
₹54,600 – ₹54,650 (immediate support; failure to hold above this may lead to a decline)
₹54,400 – ₹54,500 (short-term support; a break below this could indicate weakness)
₹53,900 – ₹54,000 (deeper support zone if price dips further)
📉 Outlook
Bullish Scenario: If BANKNIFTY holds above ₹54,650, upward momentum may continue. Break above ₹55,100 can open the way toward ₹55,500+.
Bearish Scenario: If it falls below ₹54,400, risk increases toward ₹53,900 – ₹54,000.
Neutral / Range: Between ₹54,650 – ₹55,100, BANKNIFTY may consolidate before a directional move.

NIFTY 1D Time frame📍 Current Price Action
Trading around 25,005 – 25,010
Day change: about +0.4%
⚙ Technical Indicators
Moving Averages (5, 10, 20, 50, 100, 200 day): All showing buy signals → bullish structure
RSI (14): In bullish territory, not overbought → healthy momentum
Stochastic Oscillator: Near overbought zone → indicates strength, but chance of a short pullback
MACD: Positive crossover → supports upward momentum
📊 Support & Resistance
Immediate Resistance: 25,000 – 25,100 zone
Immediate Support: 24,800 – 24,900 zone
If price sustains above 25,100 → next upside levels can open higher (towards 25,200+)
If it breaks below 24,900 → downside could test 24,700 levels
🧠 Summary
Nifty 50 is in a bullish daily trend, currently consolidating near psychological resistance at 25,000. As long as it holds above 24,900, the bullish momentum is intact. A breakout above 25,100 could extend the rally further.
Do you also want me to give the weekly time frame (1W) view for a bigger picture trend?

Part 8 Trading Masterclass With ExpertsReal-Life Example – Hedging a Portfolio
Suppose you hold ₹5,00,000 worth of Indian equities. You worry about a market correction. Instead of selling your holdings, you buy Nifty Put Options as insurance.
Nifty at 20,000
You buy Put Option at Strike 19,800, Premium = 200 × 50 lot = ₹10,000.
If Nifty falls to 19,000:
Put gains = (19,800 – 19,000) × 50 = ₹40,000
Your portfolio loss is partially offset by option profit.
This is how professionals use options for protection.
Psychological Aspects of Options Trading
Options trading is as much about mindset as knowledge:
Stay disciplined. Don’t chase every trade.
Accept losses—they’re part of the game.
Avoid greed—taking profits early is better than losing them later.
Learn patience—sometimes the best trade is no trade.
Options trading is a powerful tool in the world of financial markets. For beginners, it may look overwhelming, but once broken down into clear concepts, options are simply another way to express your view on the market. Whether you want to speculate, hedge, or generate income, options offer flexibility that stocks alone cannot match.
The key for beginners is education + risk management + practice. Start small, learn continuously, and slowly expand your strategies. Over time, you’ll realize that options aren’t scary—they’re opportunities waiting to be unlocked.
With the right approach, options trading can transform your trading journey, making you not just a participant in the markets, but a smart strategist who uses every tool available.

Part 6 Learn Institutional Trading Black-Scholes Model
A widely used formula to calculate option prices using:
Stock price
Strike price
Time to expiry
Volatility
Risk-free interest rate
Greeks
Delta: Measures sensitivity of option price to underlying price changes.
Gamma: Measures delta’s rate of change.
Theta: Measures time decay of option.
Vega: Measures sensitivity to volatility.
Rho: Measures sensitivity to interest rates.
Understanding Greeks is critical for managing risk and strategy adjustments.

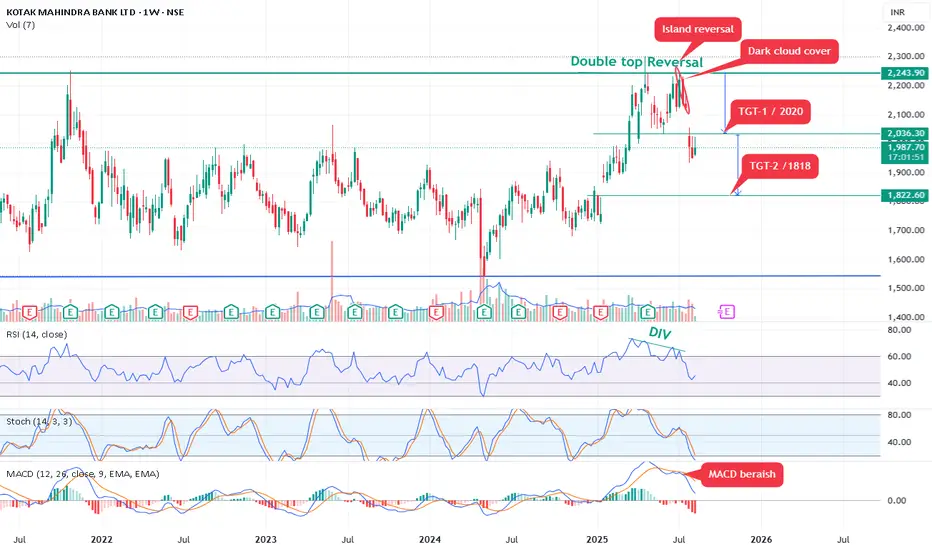
Kotak Mahindra bank form double top Reversal pattern.Kotak Mahindra bank form double top Reversal pattern.
Bearish View (Short Opportunity): The pattern suggests shorting on any rally back up to ₹2,020 (potential resistance or retest of the neckline/breakout level).
As per pattern is may test 1818 soon target -2.
Risk-reward ratio: Approximately 1:2-3, assuming disciplined stops.
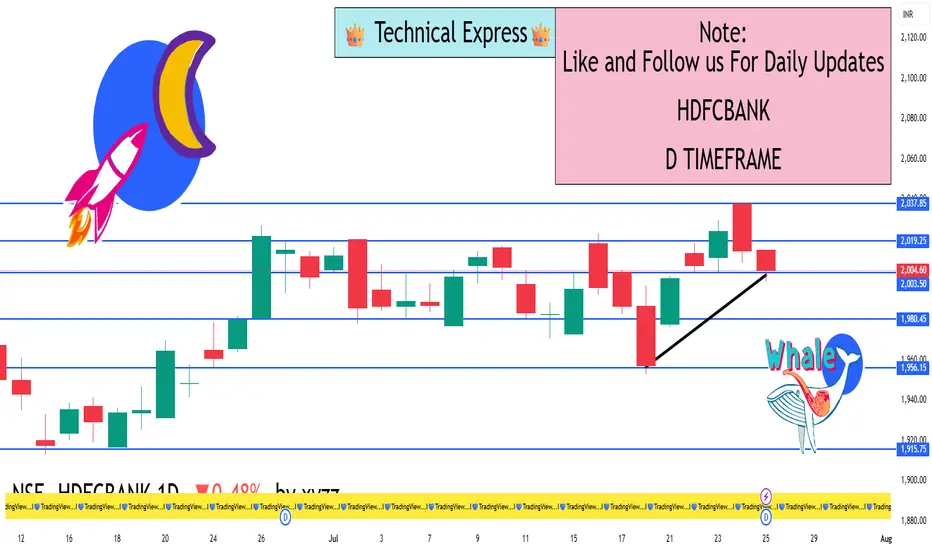
HDFCBANK 1D TimeframeClosing Price: ₹2,004.60
Opening Price: ₹2,018.80
Day’s High: ₹2,028.00
Day’s Low: ₹1,996.75
Net Change: –₹16.10 (–0.80%)
Trend: Mild Bearish
🔻 Support Levels
₹1,985 – Immediate support (20-day moving average)
₹1,950 – Short-term support (50-day moving average)
₹1,910 – Medium support (100-day moving average)
🔺 Resistance Levels
₹2,030 – Recent swing high and near-term resistance
₹2,050 – Breakout zone if momentum picks up
₹2,100 – Major resistance area
📈 Technical Indicators
RSI (Relative Strength Index): ~62
➤ In neutral to bullish territory, showing healthy momentum but close to overbought levels.
MACD (Moving Average Convergence Divergence):
➤ MACD line above Signal line – currently a bullish signal.
Volume:
➤ Normal trading volume; no heavy buying or panic selling.
➤ Indicates steady participation from both retail and institutional investors.
Candlestick Pattern:
➤ Small bearish candle after a strong bullish move earlier in the week.
➤ Indicates temporary profit booking or hesitation near resistance zone.
🧠 Market Sentiment
Overall sentiment remains positive for HDFC Bank due to:
Strong financials and balance sheet
Good loan growth reported in recent results
High investor confidence post bonus issue announcement
However, profit booking is likely near ₹2,030 as it is a psychological and technical resistance.
✅ Conclusion
Short-Term View: Mild pullback within an uptrend; no major weakness.
Medium-Term Trend: Still bullish as price remains above key moving averages.
Action to Watch:
A breakout above ₹2,030 may trigger a rally toward ₹2,050+.
A drop below ₹1,985 may invite short-term selling toward ₹1,950.
Institution Option Trading📌 1. Multi-leg Strategic Trades
Institutions rarely take single-leg naked options. They use advanced setups like:
✅ Vertical Spreads (Bull Call / Bear Put)
✅ Iron Condor / Iron Butterfly
✅ Calendar / Diagonal Spreads
✅ Ratio Spreads
✅ Box Spreads (riskless arbitrage)
These strategies offer:
Defined risk
Better reward-to-risk ratios
Controlled exposure to market direction and volatility
📌 2. Delta Hedging
Institutions holding large stock or futures positions hedge delta using options.
For example:
Holding ₹50 crore worth of Reliance shares
Buy Reliance PUT options to protect against fall
Or, dynamically sell call options as price rises to adjust exposure
This is called Delta Hedging, and it’s done in real-time using algorithms.
📌 3. Open Interest (OI) Tracking
Institutions use option chain OI to:
Spot support/resistance based on strike activity
Identify traps and short-covering zones
Detect institutional presence via unusual OI spikes
For example:
Sudden OI surge at 22,000 PE in Bank Nifty
Might indicate put writers protecting downside, expecting reversal
📌 4. Time Decay (Theta) Exploitation
Institutions are the real beneficiaries of theta decay.
They sell options (straddles, strangles, spreads) around key levels (like VWAP, CPR) and let time decay eat the premium.
Especially on:
Expiry day (Thursday in India)
After big moves
In range-bound markets
They deploy millions of rupees in premium-selling strategies to generate daily/weekly returns.
🔶 Institutional Option Strategies Explained
Let’s break down some common institutional strategies in real terms:
🔷 1. Short Straddle
Sell ATM Call and ATM Put at same strike
Works in sideways markets
Profits from time decay and low movement
✅ Used heavily by institutions on weekly expiry
✅ Risk: Sharp move in either direction
🔷 2. Bull Call Spread
Buy a lower strike Call
Sell a higher strike Call
Lower cost, limited risk & reward
✅ Used when institutions expect moderate bullish move
✅ Controlled exposure + reduced premium
🔷 3. Iron Condor
Sell OTM Call & Put
Buy further OTM Call & Put
Net credit strategy with limited risk
✅ Best in low volatility, non-trending markets
✅ Profitable if market stays between two levels
🔷 4. Calendar Spread
Sell near-term option
Buy far-month option (same strike)
Used when:
Near-term IV is high
Long-term view is neutral or unclear
✅ Profits from IV difference and time decay advantage
🔷 5. Protective Put
Holding equity or futures
Buy Put Option to insure position
Institutions use this to hedge large portfolios during high uncertainty (e.g., elections, war threats, Fed rate decisions)
🔶 Real Example – How an Institution Trades Nifty Options
Let’s say Nifty is at 22,000.
📊 Scenario:
IV is high
No major event ahead
OI buildup seen at 22000 PE and 22100 CE
📈 Institutional Strategy:
Sell 22000 PE and 22100 CE (Short Straddle)
Buy 21900 PE and 22200 CE (hedge legs)
Result:
If Nifty stays in range → theta decay = profit
If it breaks out → hedge legs protect loss
✅ Low-risk, smart premium capture strategy
🔶 Key Tools Institutions Use in Options Trading
Bloomberg Terminal (real-time global data)
Opstra / Sensibull / QuantsApp (for Greek/OI analysis)
Option Vega/IV scanners
Algo trading engines
Python/R-based custom backtesting engines
Retail traders can start by using TradingView + Sensibull/Opstra.
🔶 How to Learn Institutional Options Trading?
Here’s a step-by-step approach:
✅ Understand Options Basics – Calls, Puts, Moneyness
✅ Study Greeks Deeply – Delta, Theta, Vega, Gamma
✅ Learn Option Chain Analysis – OI, IV, Max Pain
✅ Explore Spreads & Multi-leg Setups
✅ Practice Risk Management & Position Sizing
✅ Track Institutional Behavior via OI shifts & volume
✅ Backtest Your Strategy before going live
🔶 Final Takeaways
Institutional Options Trading is not about guessing. It’s about data, structure, and risk.
Retail traders who try to copy institutions without understanding their objectives often get trapped.
But if you:
Study Smart Money behavior
Use strategic entries based on volume + volatility
Respect risk and capital preservation
…you can trade with the institutions, not against them.

Institutional Objectives in Options Trading🔷 What Are Institutions in the Market?
Before diving into their objectives, let’s first understand who institutions are:
Institutions are large, professional organizations that trade in the financial markets using massive amounts of capital. These include:
Mutual Funds
Hedge Funds
Pension Funds
Insurance Companies
Investment Banks
FIIs (Foreign Institutional Investors)
Proprietary Trading Firms
These players account for over 80-90% of daily turnover in options markets like NSE’s Bank Nifty and Nifty. Unlike retail traders, they don’t trade emotionally or randomly. Every move they make has a calculated reason behind it.
🎯 Why Do Institutions Use Options?
Options are powerful tools. Institutions don’t just trade them for direction; they use options to achieve multiple objectives:
✅ 1. Hedging Portfolios
🔍 Objective:
To protect their large equity/futures holdings from adverse market movements.
Institutions have huge long-term positions in stocks or indices. If the market falls sharply, these positions can suffer big losses. So, they use PUT options to hedge.
📈 Example:
A pension fund holds ₹500 crore worth of Nifty 50 stocks.
It buys Nifty 50 PUT Options at 22,000 strike.
If market crashes, the loss in stocks is offset by profit in PUTs.
📌 Result: Limited downside, peace of mind, capital protection.
✅ 2. Generating Additional Income (Option Writing)
🔍 Objective:
To generate consistent income from existing holdings through Covered Calls, Cash-secured Puts, or Iron Condors.
Institutions write options (sell) to earn premium—especially in sideways markets.
💡 Examples:
Covered Call: Own Reliance shares + Sell OTM Call option to earn income.
Short Strangles: Sell far OTM Put and Call if volatility is high.
Iron Condor: Sell call/put spreads to profit from time decay.
📌 Result: Generates passive income with controlled risk.
✅ 3. Arbitrage and Spread Trading
🔍 Objective:
To lock in risk-free or low-risk profits through price inefficiencies.
Institutions use Calendar Spreads, Box Spreads, or Volatility Arbitrage to exploit inefficiencies in option pricing.
🔧 Example:
Calendar Spread: Buy Nifty 22500 CE in August, sell Nifty 22500 CE in July.
Profit from IV differences or time decay.
📌 Result: Non-directional trading, but consistent profits with high capital.
✅ 4. Taking Directional Bets With Defined Risk
🔍 Objective:
To take high-conviction trades without exposing entire capital like futures.
Institutions use Debit Spreads, Straddles, or Long Options for directional views with limited risk.
💡 Example:
If expecting a bullish breakout, they might:
Buy 22000 CE
Sell 22200 CE
It caps both risk and profit. Perfect for risk-managed directional exposure.
📌 Result: Risk-defined entry into market trends without using futures.
✅ 5. Volatility Trading (Not Price Trading)
Institutions often trade volatility, not just price direction. They use Straddles, Strangles, Calendar Spreads to play IV.
💡 Example:
If implied volatility is low and an event is coming (like RBI policy):
Buy Straddle (ATM Call + Put)
Expect IV spike or a big move
📌 Result: Profit from volatility expansion or collapse, even if price stays in a range.
✅ 6. Managing Fund Exposure / Risk Neutralizing
Large funds have multiple exposures—options help them balance and adjust their overall risk (Delta-neutral, Vega-neutral, etc.).
They regularly:
Adjust positions using Gamma scalping
Balance portfolio Delta using options
Reduce Vega risk in high IV periods
📌 Result: A smooth, hedged, and controlled portfolio with minimal exposure to wild market moves.
✅ 7. Creating Synthetic Positions
Sometimes, instead of using equity or futures, institutions use options to replicate or create synthetic trades.
💡 Example:
Buy Call + Sell Put = Synthetic Long Future
Sell Call + Buy Put = Synthetic Short
This helps institutions:
Avoid STT, slippage
Better margin use
Higher flexibility with position sizing
📌 Result: Capital efficiency and strategic execution
📈 How to Spot Institutional Activity in Options?
You can decode institutional movement using these tools:
🔸 1. Open Interest (OI) Analysis
Spike in OI with price action = smart money at work
Build-up of OI near a strike = possible resistance/support zone
Use tools like Sensibull, Opstra
🔸 2. Volume + Price Movement
Sudden spike in volume in far OTM options = Institutional hedging or setup
Buy-Sell flow data shows positioning
🔸 3. Put-Call Ratio (PCR)
Used to detect market sentiment and institutional net positioning
🔸 4. IV Charts / Skew
Institutional volatility strategies are visible through steep IV skew or unusual IV changes
🔐 Final Thoughts
Institutional trading in options is not speculation. It is a scientific approach to manage:
Capital exposure
Risk control
Income generation
Volatility protection
Their objectives are not just to win trades, but to:
Protect capital
Optimize returns
Stay profitable in all market conditions

#KOTAKBANK #KOTAKBANKANALYSISBreakout from falling channel pattern.
Looks good for 2230 .
SL:- 1700.
R:R:- 1:1

KOTAKBANK Long Idea.....KOTAKBANK chart shows its near support zone. need to see what price does near supoort.
Will enter on confirmation of Breaking weekly resistance.
Fundamentals:
Pro's: SALES & PAT growth CAGR is positive these 3 years where price is in zone. Not an Overvalued stock.
Con's: PE derating might have happened due to drop in sales growth. this may continue till its growth kicks in coming quarters.

KOTAK BANK: Time for 4-year range break?⚡️Price Analysis:
1️⃣ Price structure shifting from sideways to bullish
2️⃣ Classic Textbook breakout with strong bullish candle.
3️⃣ Price needs to sustain above 2000 for major bull rally to initiate.
✨ Key Observations:
➡️ Expecting some good momentum buildup else there is a risk of a false BO as well.
➡️ All timeframes aligned for potential upside move
➡️ Perfect RRR setup forming at these levels
⌛MTF:
⚠️ Disclaimer: This is NOT a buy/sell recommendation. This post is meant for learning purposes only. Views are personal. Please, do your due diligence before investing.⚠️
💬 What are your thoughts on this share it in the comments below. ✌️
🔥 Happy Trading!✅🚀

Kotak Mahindra Bank exploding after the results.Kotak Mahindra Bank has given good results and reacted gaining 9.21% today.
A good support from 200 EMA on the weekly charts and now its trading around a minor resistance zone.
For a long time the stock is trading in a range, now the stock has reacted to the news. Either it will take a pause on continue to test the upper resistance around 2000 and 2160.
This is the third time the stock is testing the resistance zone. If the resistance is gone chances of test the ATH will be higher.
Daily supports are around 1800-1840 levels. Gap filling can be done but not so early.
It has also cleared the Moving averages gates of all the four EMAs. Bullishness is there in the stock.
Wait for the price action near the levels before entering the trade.
