KPIT Analysis! Ascending triangle!!KPIT Weekly Analysis
Ascending Triangle Pattern Formation in KPIT
KPIT has made Ascending Triangle Patern on Weekly Timeframe. KPIT has giver breakout at it's resistance level and trying to retest the level to establish the support over there. 805-829 is the support zone range. Price may take support at this zone and move further up towards our projected profit.
Trading Psychology - Aggresive investors can initiate buy at current price level and Conservative investers can initiate buy above 945 levels.
Entry - Current Level or Above 945
Taregt - 1992.35
Stop Loss- Below 737.25
If you like my analysis please do boost and share. I want support from you guys to help our trading community to achieve an edge in Technical Analysis
Disclaimer - All my analysis are for Educational Purpose only. Before entering into any trade - 1) Educate Yourself 2)Do your own research and analysis 3)Define your Risk to Reward ratio 3)Don't trade with full capital
Kpitlong

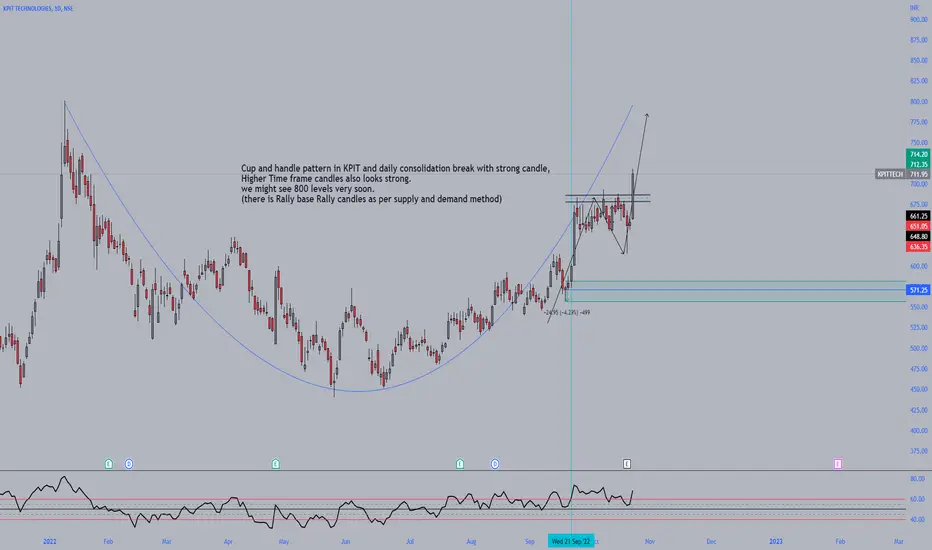
KPIT - Strong consolidation breakout and Cup-handle pattern.Cup and handle pattern in KPIT and daily consolidation break with strong candle,
Higher Time frame candles (M/W)also looks strong.
we might see 800 levels very soon.
(there is Rally base Rally candles as per supply and demand method)
-Educational purpose.
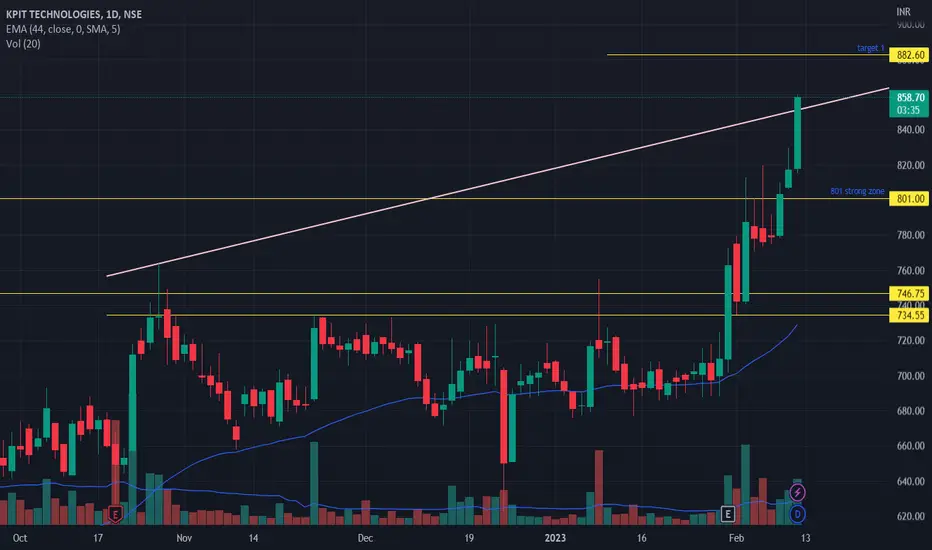
KPITTECH Analysis & PredictionThis is the analysis of KPITTECH in the Daily Time Frame. Watch carefully. The chart explains itself.
If it breaks and sustains above the upcoming resistance level, it is good for the stock.
There are some prediction levels. These Levels act as Support and Resistance according to position of price. You have to trade according to level breakout or breakdown.
Always maintain your risk management.
Book your profit according to your “STOMACH”.
Disclaimer:
This is not investment advice. I am not a SEBI Registered Analyst. Anything posted here is my own analysis and views. This is created for educational purposes only. Always consult your Financial Advisor before taking any decision or trade.
Happy trading.
About KPITTECH :
KPIT Technologies Ltd. engages in the provision of software for the automobile and mobility industry. It operates through the following geographical segments: Americas, UK and Europe, and Rest of the World. The company was founded by Shashishekhar Pandit, Kishore Parshuram Patil, and Sachin Dattatraya Tikekar on January 1, 2018 and is headquartered in Pune, India.

KPIT TECH ( Triangle Pattern ) 🚀KPIT TECH forming triangle bullish pattern on 1 day time frame.
It seems to be reach 1210-1220 in upcoming month.
Note : This is just for learning purpose and this is not a Signal.

Ride the Wave: KPITTECH- Breakout Signals Profitable OpportunityKPITTECH, has recently caught the attention of traders with its impressive momentum. stock experienced a breakout from the bullish trendline, marking a significant turning point. Currently, the stock is testing its breakout at trendline which was supply line before breakout, which has now transformed into a demand line.
📊 Key Analysis Points 📊
When examining the daily timeframe, it's clear that the stock is holding above its breakout level with minimal volume, confirming the bullish outlook at retest of breakout.
Zooming in to the 75-minute timeframe, we observe a bullish RSI divergence, providing additional confirmation for a buy entry at the retest of the trendline breakout.
Moreover, analysing the volume on the 75-minute timeframe, we notice that the majority of bullish candles exhibit higher volume, surpassing the 50-day moving average of volume. This indicates a significant buying interest and reinforces the bullish setup.
Based on this analysis, we can plan our buy trade if the price surpasses today's high at 1067. Once the breakout is confirmed, we can enter the trade at 1069. To manage risk, it is recommended to place the stop loss below the previous swing low, around 1044, it's prudent to keep a buffer and set the stop loss at 1041. it's crucial to trail stop losses to secure profits as the trade progresses.
🔍 Educational Insights 🔍
Before concluding this analysis, let's clarify some technical terms used:
1. Breakout : This refers to a price movement that surpasses a key resistance level or trendline, indicating a potential shift in market sentiment and often leading to further price appreciation.
2. Volume : It represents the number of shares or contracts traded during a given time period. Analysing volume can provide insights into the strength or weakness of price movements.
Curious about volume? Check out my educational article on volume analysis that made it to TradingView's prestigious Editor's Pick:
3. RSI (Relative Strength Index) Divergence : RSI is a popular momentum oscillator. Divergence occurs when the price and RSI indicator move in opposite directions, indicating a potential trend reversal.
curious about RSI Divergence? Learn more in my educational article on Divergence, chosen for TradingView's Editor's Pick:
Remember, this analysis is for educational purposes only and does not serve as financial advice. As a reminder, I am not a SEBI registered analyst.
If you found this analysis helpful, please like and share your observations in the comments section below. Your feedback keeps me motivated to consistently provide valuable content. Don't forget to follow me on TradingView for more articles and trade setups. Let's connect and grow together! 😊📈
Follow me on TradingView for more: in.tradingview.com
"The only way to do great work is to love what you do."

Break of trendline1.RSI and stock are moving in same trend
2.break of trendline
3.kpittech is in all time high
good stock for btst trade