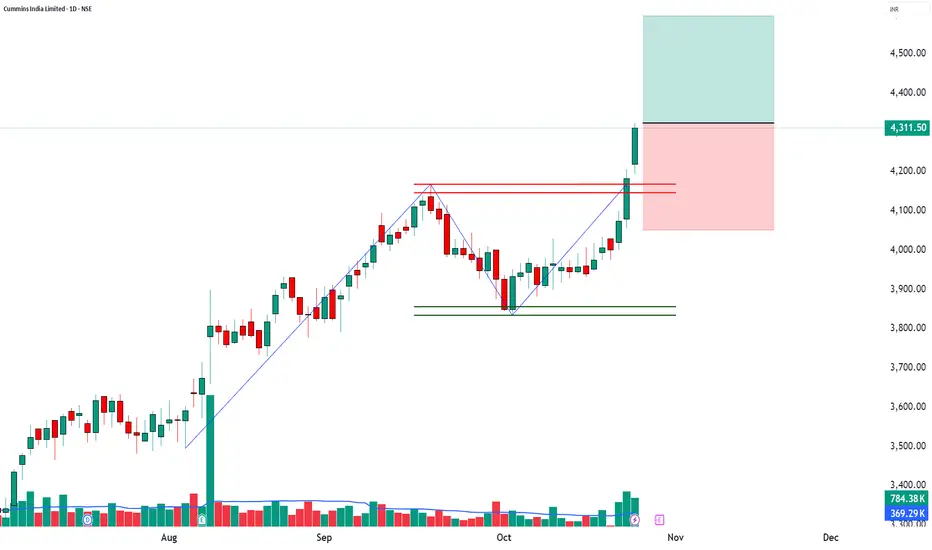
CUMMINSIND | 52-Week Breakout + Volume Expansion📈 CUMMINSIND | 52-Week Breakout + Volume Expansion + Institutional Momentum 🚀
🔹 Entry Zone: ₹4,311.50 – ₹4,324.00
🔹 Stop Loss: ₹4,051.05 (Risk ~273 pts)
🔹 Supports: 4,230 / 4,148.5 / 4,101.5
🔹 Resistances: 4,358.5 / 4,405.5 / 4,487
🔹 Swing Demand Zone: ₹4,096.70 – ₹4,060.10
🔹 Intraday Demand Zone: ₹4,086.20 – ₹4,065.00
🔑 Key Highlights
✅ 52-Week Breakout – strong bullish sentiment and trend expansion
✅ Exceptional Volume (2.12x avg) – clear institutional participation
✅ Bollinger Band Expansion – rising volatility supporting fresh rally
✅ Buy Today, Sell Tomorrow Setup – high momentum carryover expected
✅ VWAP Alignment – buyers maintaining upper hand
🎯 STWP Trade View
📊 Stock has shown powerful bullish momentum with record volume; however, post-breakout consolidation may occur near ₹4,358–₹4,405.
⚠️ The ₹4,086–₹4,065 intraday zone and ₹4,096–₹4,060 swing zone act as crucial support for momentum traders to plan re-entries.
💡 Learning Note
A 52-week breakout supported by heavy volume and VWAP strength signals potential institutional accumulation. Traders should trail profits gradually and watch for sustained volume to confirm continuation.
Final Outlook: Momentum: Moderate | Trend: Neutral | Risk: Low | Volume: High
________________________________________
________________________________________
⚠️ Disclosure & Disclaimer – Please Read Carefully
The information shared here is meant purely for learning and awareness. It is not a buy or sell recommendation and should not be taken as investment advice. I am not a SEBI-registered investment adviser, and all views expressed are based on personal study, chart patterns, and publicly available market data.
Trading—whether in stocks or options—carries risk. Markets can move unexpectedly, and losses can sometimes exceed the money you have invested. Past performance or past setups do not guarantee future results.
If you are a beginner, treat this as a guide to understand how the market works and practice on paper trades before risking real money. If you are experienced, always assess your own risk, position sizing, and strategy suitability before entering trades.
Consult a SEBI-registered financial adviser before making any real trading decision. By engaging with this content, you acknowledge full responsibility for your trades and investments.
Position Status: No active position in CUMMINSIND at the time of analysis.
Data Source: TradingView & NSE India (Past Chart Reference) (Historical levels)
💬 Found this useful?
🔼 Give this post a Boost to help more traders discover clean, structured learning.
✍️ Drop your thoughts, questions, or setups in the comments — let’s grow together!
🔁 Share with fellow traders and beginners to spread awareness.
👉 “If you liked this breakdown, follow for more clean, structured setups with discipline at the core.”
🚀 Stay Calm. Stay Clean. Trade With Patience.
Trade Smart | Learn Zones | Be Self-Reliant 📊
Learntotrade
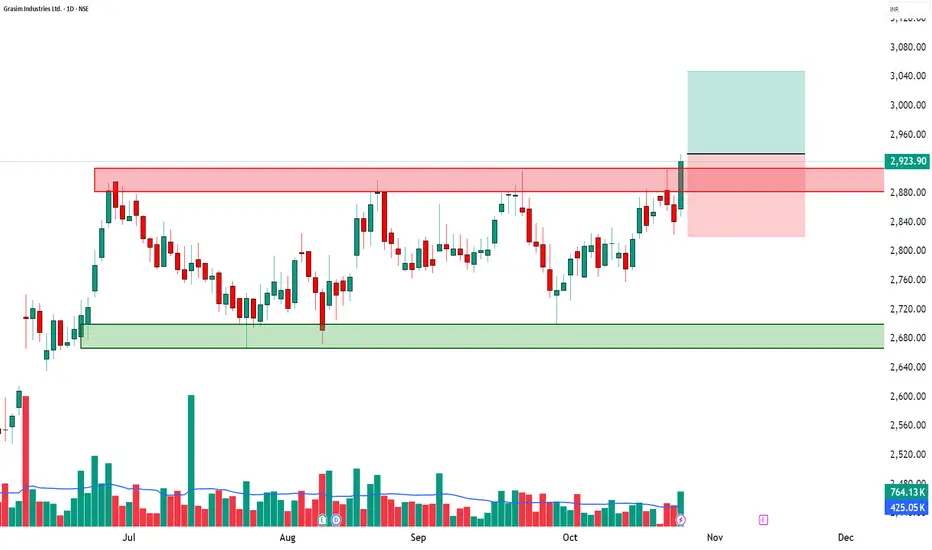
GRASIM | 52-Week Breakout + RSI Surge + High Volume📈 GRASIM | 52-Week Breakout + RSI Surge + High Volume Confirmation 🚀
🔹 Entry Zone: ₹2,923.90 – ₹2,934.00
🔹 Stop Loss: ₹2,820.45 (Risk ~113 pts)
🔹 Supports: 2,869.67 / 2,815.43 / 2,783.27
🔹 Resistances: 2,956.07 / 2,988.23 / 3,042.47
🔹 Swing Demand Zone: ₹2,787 – ₹2,764.50
🔑 Key Highlights
✅ 52-Week Breakout – strong confirmation of bullish momentum continuation
✅ RSI Breakout – trend acceleration backed by strength
✅ Bollinger Band Expansion – volatility breakout indicates fresh momentum
✅ VWAP Alignment – buyers maintaining control across sessions
✅ Volume Spike (1.8x avg) – institutional buying and strong follow-up interest
🎯 STWP Trade View
📊 Momentum favors continued bullish strength. Sustaining above ₹2,956 could extend the move toward ₹2,988–₹3,042 levels.
⚠️ The ₹2,787–₹2,764 zone acts as a key swing base where accumulation is likely to continue if prices retest.
💡 Learning Note
This setup demonstrates how a 52-week breakout with RSI and VWAP confirmation can mark a major trend continuation point. Volume expansion adds conviction, making such setups ideal for momentum-based swing trades.
Final Outlook: Momentum: Strong | Trend: Bullish | Risk: Low | Volume: High
________________________________________
________________________________________
⚠️ Disclosure & Disclaimer – Please Read Carefully
The information shared here is meant purely for learning and awareness. It is not a buy or sell recommendation and should not be taken as investment advice. I am not a SEBI-registered investment adviser, and all views expressed are based on personal study, chart patterns, and publicly available market data.
Trading—whether in stocks or options—carries risk. Markets can move unexpectedly, and losses can sometimes exceed the money you have invested. Past performance or past setups do not guarantee future results.
If you are a beginner, treat this as a guide to understand how the market works and practice on paper trades before risking real money. If you are experienced, always assess your own risk, position sizing, and strategy suitability before entering trades.
Consult a SEBI-registered financial adviser before making any real trading decision. By engaging with this content, you acknowledge full responsibility for your trades and investments.
Position Status: No active position in GRASIM at the time of analysis.
Data Source: TradingView & NSE India (Past Chart Reference) (Historical levels)
💬 Found this useful?
🔼 Give this post a Boost to help more traders discover clean, structured learning.
✍️ Drop your thoughts, questions, or setups in the comments — let’s grow together!
🔁 Share with fellow traders and beginners to spread awareness.
👉 “If you liked this breakdown, follow for more clean, structured setups with discipline at the core.”
🚀 Stay Calm. Stay Clean. Trade With Patience.
Trade Smart | Learn Zones | Be Self-Reliant 📊
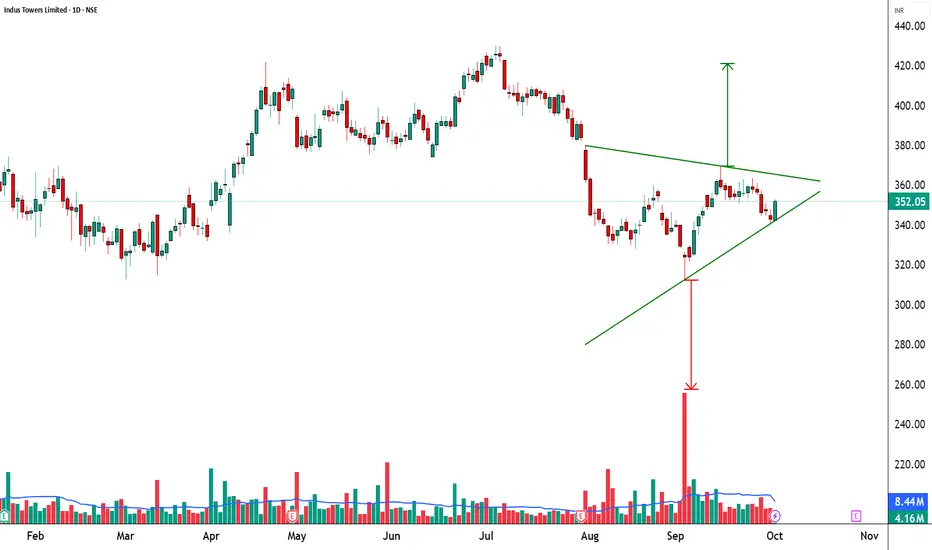
INDUSTOWER - Symmetrical Triangle Breakout Watch🚀 Indus Towers Ltd (NSE: INDUSTOWER) | Symmetrical Triangle Breakout Watch
________________________________________
🏢 Company Overview
Indus Towers Ltd is one of India’s largest telecom tower companies, providing critical passive infrastructure for the country’s telecom operators. The stock recently stabilized after a sharp fall and is now moving into a consolidation pattern that could signal the next big move.
________________________________________
📊 Current Market Snapshot
CMP: ₹352.05
Sector: Telecom Infrastructure
Pattern Observed: 🔺 Symmetrical Triangle
Candlestick Signal: Strong Bullish Candle on support
Strength Rating: ⭐⭐⭐ (Neutral → Bullish Watch)
________________________________________
📈 Price Action & Chart Pattern
The stock is trading inside a symmetrical triangle, formed by higher lows and lower highs. Today’s session shows a strong bounce from the support trendline, hinting at potential momentum buildup.
Support Trendline: ₹340 – ₹342
Resistance Trendline: ₹360 – ₹365
Breakout Zone: Above ₹360 with strong volume
Breakdown Zone: Below ₹340 may trigger fresh weakness
🔍 Why Important? Symmetrical triangles usually lead to explosive breakouts once price exits the structure with volume confirmation.
________________________________________
🔎 Technical Indicators
RSI (14): 50.35 → Neutral, ready for directional expansion.
EMA Support: Price reclaiming short-term EMAs, showing recovery signs.
Volume: Current rally backed by above-average volumes; a 1.5x spike would confirm strength.
The stock shows multiple bullish signals – Bullish Marubozu + Engulfing candle, strong buyer dominance with open = low, and alignment above VWAP suggesting institutional support. A BB squeeze indicates breakout potential, but traders should stay alert for a fake breakdown/liquidity sweep before the real move.
________________________________________
📍 Key Levels to Watch
Immediate Support: ₹340 – ₹342
Immediate Resistance: ₹360 – ₹365
Upside Target (if breakout): ₹390 – ₹400
Downside Target (if breakdown): ₹320 – ₹310
________________________________________
🔮 Bullish & Bearish Scenarios
✅ Bullish Case: A decisive close above ₹360 with heavy volume could trigger a sharp rally towards ₹390+.
⚠️ Bearish Case: Failure to cross ₹360 and a slip below ₹340 could drag the stock back to ₹320 or lower.
________________________________________
📝 STWP Trade Analysis
Entry: ₹352.05
Stop-loss: ₹340.45 (just below trendline)
Risk: 11.60 points
Strength: ⚡ Average but improving with momentum
Demand Zone: ₹350.85 – ₹340.90 | SL: 340.45
📌 Note: Risk-Reward is attractive if played with discipline & volume confirmation.
________________________________________
🎯 Final Outlook
Indus Towers is at a make-or-break stage. Traders should watch the ₹360 breakout level closely. A confirmed breakout can trigger a quick upward move, while failure may resume the prior downtrend. Patience and volume confirmation are key before committing to bigger trades.
________________________________________
💡 Learning Note: Symmetrical triangles often serve as launchpads for trend continuation. Combining price action + volume + risk management helps traders filter false signals and ride genuine breakouts effectively.
________________________________________
⚠️ Disclosure & Disclaimer – Please Read Carefully
The information shared here is meant purely for learning and awareness. It is not a buy or sell recommendation and should not be taken as investment advice. I am not a SEBI-registered investment adviser, and all views expressed are based on personal study, chart patterns, and publicly available market data.
Trading—whether in stocks or options—carries risk. Markets can move unexpectedly, and losses can sometimes exceed the money you have invested. Past performance or past setups do not guarantee future results.
If you are a beginner, treat this as a guide to understand how the market works and practice on paper trades before risking real money. If you are experienced, always assess your own risk, position sizing, and strategy suitability before entering trades.
Consult a SEBI-registered financial adviser before making any real trading decision. By engaging with this content, you acknowledge full responsibility for your trades and investments.
💬 Found this useful?
🔼 Give this post a Boost to help more traders discover clean, structured learning.
✍️ Drop your thoughts, questions, or setups in the comments — let’s grow together!
🔁 Share with fellow traders and beginners to spread awareness.
👉 “If you liked this breakdown, follow for more clean, structured setups with discipline at the core.”
🚀 Stay Calm. Stay Clean. Trade With Patience.
Trade Smart | Learn Zones | Be Self-Reliant 📊
KOTAKBANK - Rectangle Consolidation Breakout Watch🚀 Kotak Mahindra Bank Ltd (NSE: KOTAKBANK) | Rectangle Consolidation Breakout Watch
📊 Current Market Snapshot
CMP: ₹2,063.30
Sector: Banking & Financial Services
Pattern Observed: 📦 Rectangle Consolidation (Range-Bound)
Candlestick Signal: Strong Bullish Candle + Bullish Engulfing
Strength Rating: ⭐⭐⭐⭐ (Bullish Breakout Watch)
________________________________________
📈 Price Action & Chart Pattern
The stock has been trading between support near ₹1,970 and resistance near ₹2,020, forming a sideways rectangle box. Today’s move shows a decisive bullish candle with high volume, suggesting a breakout attempt from this consolidation.
Support Range: ₹1,968 – ₹1,970
Resistance Range: ₹2,018 – ₹2,020
Breakout Zone: Above ₹2,020 with volume confirmation
Breakdown Zone: Below ₹1,970 may trigger renewed weakness
🔍 Why Important? Rectangle consolidations represent accumulation or distribution phases. A breakout above resistance often leads to strong directional moves.
________________________________________
🔎 Technical Indicators
RSI (14): 61.37 → Breaking out of consolidation zone.
EMA Support: Price reclaiming above EMA50, signaling trend strength.
Volume: Breakout attempt supported by 1.5x+ average volumes.
Kotak Bank — a strong bullish candle with Bullish Engulfing, RSI breakout, and Open = Low showing aggressive buying from the start. Price holding above VWAP signals institutional support, while the BB squeeze off suggests volatility expansion ahead. Together, these factors strengthen the case for a rectangle breakout continuation.
________________________________________
📍 Key Levels to Watch
Immediate Support: ₹1,968 – ₹1,970
Immediate Resistance: ₹2,018 – ₹2,020
Upside Possible (if breakout): ₹2,120 – ₹2,150
Downside Possible (if breakdown): ₹1,920 – ₹1,900
________________________________________
🔮 Bullish & Bearish Scenarios
✅ Bullish Case: Sustained close above ₹2,020 with strong volume may trigger a rally towards ₹2,120+.
⚠️ Bearish Case: Rejection near ₹2,020 and breakdown below ₹1,970 may drag the stock back to ₹1,920 or lower.
________________________________________
📝 STWP Trade Analysis
Entry: ₹2,063.30
Stop-loss: ₹1,968.60 (below rectangle support)
Risk: ~₹94.70 points
Strength: ⚡ Strong Bullish Momentum + High Volume + EMA Breakout
Demand Zone: ₹2,009 – ₹1,970 | SL: 1,968.60
📌 Note: Rectangle breakouts backed with volume tend to give quick moves. Traders should stay disciplined with SL.
________________________________________
🎯 Final Outlook
Kotak Mahindra Bank is attempting a bullish breakout from a rectangle consolidation zone. If the stock sustains above ₹2,020 with volumes, it could rally towards ₹2,120–₹2,150. However, failure to hold may drag it back inside the range.
________________________________________
💡 Learning Note: Rectangle patterns represent market indecision zones where buyers and sellers balance out. Breakouts with strong volume often indicate institutional participation, providing reliable trade setups.
________________________________________
⚠️ Disclosure & Disclaimer – Please Read Carefully
The information shared here is meant purely for learning and awareness. It is not a buy or sell recommendation and should not be taken as investment advice. I am not a SEBI-registered investment adviser, and all views expressed are based on personal study, chart patterns, and publicly available market data.
Trading—whether in stocks or options—carries risk. Markets can move unexpectedly, and losses can sometimes exceed the money you have invested. Past performance or past setups do not guarantee future results.
If you are a beginner, treat this as a guide to understand how the market works and practice on paper trades before risking real money. If you are experienced, always assess your own risk, position sizing, and strategy suitability before entering trades.
Consult a SEBI-registered financial adviser before making any real trading decision. By engaging with this content, you acknowledge full responsibility for your trades and investments.
💬 Found this useful?
🔼 Give this post a Boost to help more traders discover clean, structured learning.
✍️ Drop your thoughts, questions, or setups in the comments — let’s grow together!
🔁 Share with fellow traders and beginners to spread awareness.
👉 “If you liked this breakdown, follow for more clean, structured setups with discipline at the core.”
🚀 Stay Calm. Stay Clean. Trade With Patience.
Trade Smart | Learn Zones | Be Self-Reliant 📊
________________________________________

AUBANK - Bullish Engulfing + EMA50 Breakout = Power Rally Setup________________________________________
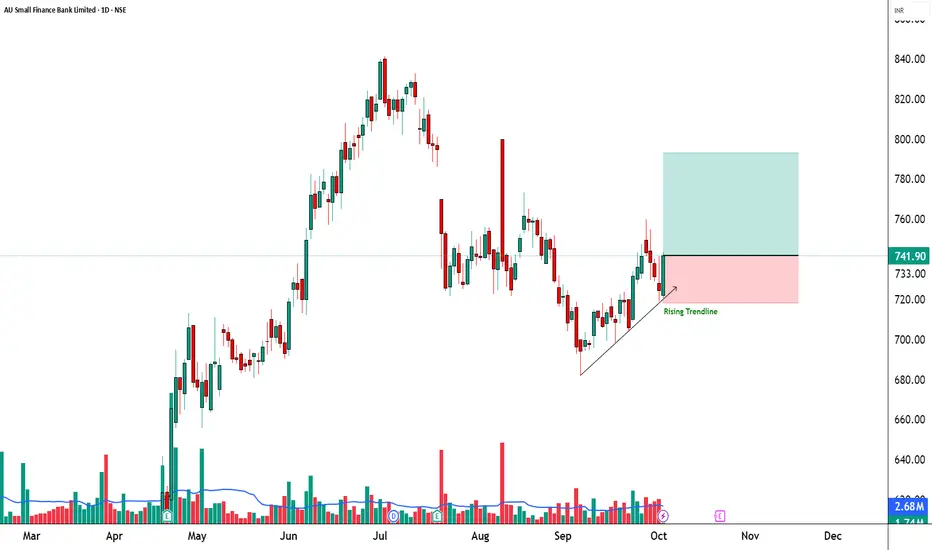
📈 AU Small Finance Bank | Bullish Engulfing + EMA50 Breakout 🚀
🔹 Entry Zone: ₹741.90 – ₹743.70
🔹 Stop Loss: ₹718.20 (Risk ~23 pts)
🔹 Supports: 727.17 / 712.43 / 704.17
🔹 Resistances: 750.17 / 758.43 / 773.17
________________________________________
🔑 Key Highlights
✅ Strong Bullish Candle – Engulfing pattern confirming reversal power
✅ EMA50 Breakout – trend shift signal
✅ Bullish VWAP Alignment – institutional buying confirmation
✅ Bollinger Squeeze-Off → breakout & volatility expansion expected
________________________________________
🎯 STWP Trade View
📊 Momentum indicates short-term bullish rally. A close above ₹750 may trigger an extended upside towards ₹758–773.
⚠️ Supports at ₹727 & ₹712 are important for trade protection.
________________________________________
💡 Learning Note
This setup demonstrates how a Bullish Engulfing pattern combined with EMA breakout + VWAP alignment can act as a multi-signal confirmation for a trend reversal.
________________________________________
⚠️ Disclosure & Disclaimer – Please Read Carefully
The information shared here is meant purely for learning and awareness. It is not a buy or sell recommendation and should not be taken as investment advice. I am not a SEBI-registered investment adviser, and all views expressed are based on personal study, chart patterns, and publicly available market data.
Trading—whether in stocks or options—carries risk. Markets can move unexpectedly, and losses can sometimes exceed the money you have invested. Past performance or past setups do not guarantee future results.
If you are a beginner, treat this as a guide to understand how the market works and practice on paper trades before risking real money. If you are experienced, always assess your own risk, position sizing, and strategy suitability before entering trades.
Consult a SEBI-registered financial adviser before making any real trading decision. By engaging with this content, you acknowledge full responsibility for your trades and investments.
💬 Found this useful?
🔼 Give this post a Boost to help more traders discover clean, structured learning.
✍️ Drop your thoughts, questions, or setups in the comments — let’s grow together!
🔁 Share with fellow traders and beginners to spread awareness.
👉 “If you liked this breakdown, follow for more clean, structured setups with discipline at the core.”
🚀 Stay Calm. Stay Clean. Trade With Patience.
Trade Smart | Learn Zones | Be Self-Reliant 📊
MCX - Bullish W-Pattern (Double Bottom Breakout)________________________________________
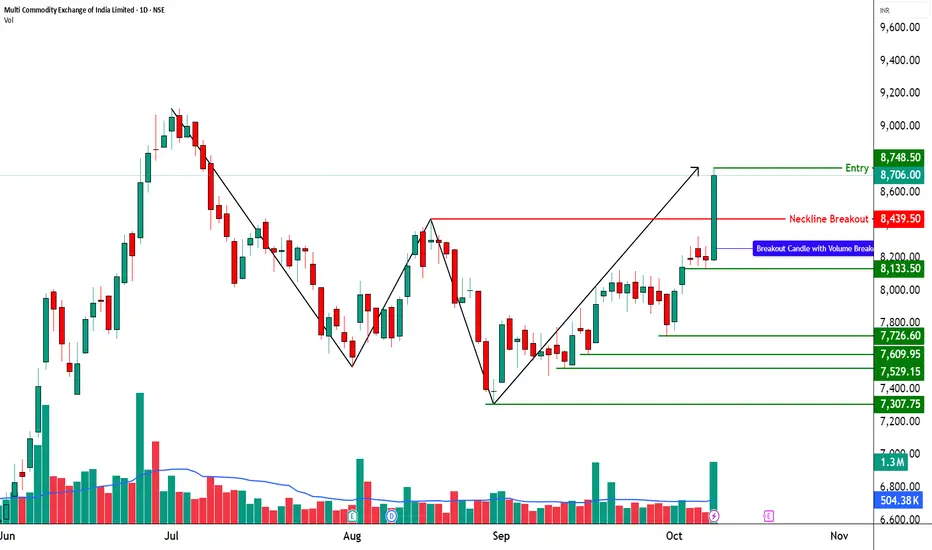
🚀 Multi Commodity Exchange of India Ltd (NSE: MCX) | Bullish W-Pattern (Double Bottom Breakout)
📊 Current Market Snapshot
CMP: ₹8,706.00
Sector: Financial Services / Commodity Exchange
Pattern Observed: 🟢 W-Pattern (Double Bottom Breakout)
Candlestick Signal: Strong Bullish Marubozu + Volume Breakout
Strength Rating: ⭐⭐⭐⭐☆ (High-Conviction Bullish Reversal)
________________________________________
🧭 Technical Indicators
The technical indicators on this chart are flashing strong bullish signals. Momentum is clearly positive, supported by a Bullish Marubozu candle, which reflects strong buying pressure and conviction. The chart also indicates a possible breakout formation, confirmed by a strong bullish candle backed by extremely high volume — a classic sign of institutional participation.
Multiple bullish confirmations like swing trade alignment, intraday signal, RSI breakout, and bullish engulfing pattern further add weight to the uptrend. The Bollinger Band breakout and Bullish VWAP suggest sustained price expansion, while the BB Squeeze-Off hints at volatility returning in favor of the bulls. Altogether, these indicators reinforce a buy-on-dip structure with potential for continuation toward higher resistance zones.
MCX is currently trading in the Progressive Zone, indicating a phase of steady upward momentum where buyers are actively accumulating positions. This zone reflects controlled bullish strength and sustained participation, suggesting that the stock is gearing up for a potential breakout continuation.
The KST (Know Sure Thing) indicator for MCX is in bullish territory, confirming the upward momentum seen in price action. With a strong positive crossover and supportive strength reading, the KST reinforces the ongoing uptrend — indicating that momentum remains firmly in favor of the bulls and the stock could continue its northward journey.
MCX is trading between its Swing High at ₹8,439.5 and Swing Low at ₹7,304. The Top Range near ₹9,115 acts as a major resistance zone, while the Bottom Range around ₹7,304 provides strong support, defining a clear bullish structure with room for further upside if momentum sustains.
________________________________________
📊 Trade Setup (Strong Momentum Entry)
Entry: ₹8,748.50
________________________________________
💡 Learning Note
This setup is a textbook example of a W-pattern (Double Bottom) breakout, where price reverses from a downtrend after forming two clear lows at similar levels. The neckline breakout with heavy volume confirms a shift in market sentiment from bearish to bullish. Such patterns highlight how volume expansion and strong breakout candles validate reversal strength and help traders identify early entry points in new uptrends.
________________________________________
⚠️ Disclosure & Disclaimer – Please Read Carefully
The information shared here is meant purely for learning and awareness. It is not a buy or sell recommendation and should not be taken as investment advice. I am not a SEBI-registered investment adviser, and all views expressed are based on personal study, chart patterns, and publicly available market data.
Position Status: No active position in MCX at the time of analysis.
Data Source: Past Chart reference(Historical levels)
Trading—whether in stocks or options—carries risk. Markets can move unexpectedly, and losses can sometimes exceed the money you have invested. Past performance or setups do not guarantee future results.
If you are a beginner, treat this as a learning guide and practice with paper trades before risking real money. If you are experienced, always assess your own risk, position sizing, and strategy suitability before entering trades.
Consult a SEBI-registered financial adviser before making any real trading decision. By engaging with this content, you acknowledge full responsibility for your trades and investments.
________________________________________
💬 Found this useful?
🔼 Give this post a Boost to help more traders discover clean, structured learning.
✍️ Drop your thoughts, questions, or setups in the comments — let’s grow together!
🔁 Share with fellow traders and beginners to spread awareness.
👉 “If you liked this breakdown, follow for more clean, structured setups with discipline at the core.”
🚀 Stay Calm. Stay Clean. Trade With Patience.
Trade Smart | Learn Zones | Be Self-Reliant 📊
________________________________________
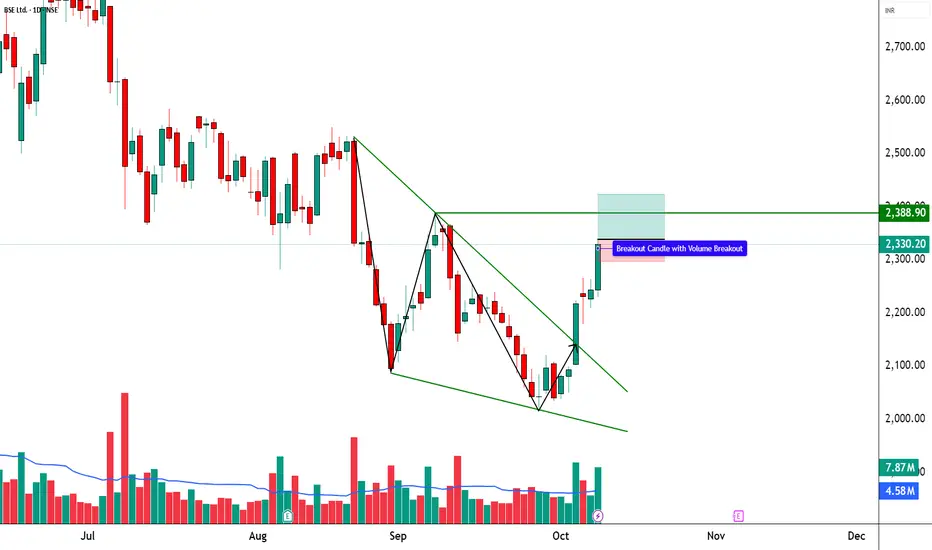
BSE | Intraday Bullish Setup📈 **BSE LTD | Bullish Breakout + SuperTrend Flip 🚀**
STWP Trade Analysis
🔹 **Entry Zone:** ₹2,328 – ₹2,334
🔹 **Stop Loss:** ₹2,296 (Risk ~₹32)
🔹 **Supports:** 2,305 / 2,265 / 2,232
🔹 **Resistances:** 2,388 / 2,423 / 2,450
🔑 **Key Highlights**
✅ Strong Bullish Candle — Breakout above consolidation with volume surge
✅ RSI & BB Expansion — Momentum revival confirmation
✅ SuperTrend Flip — Short-term trend turns bullish
✅ BB Squeeze-Off → Fresh volatility expansion underway
💡 **Learning Note**
This setup highlights how **volume-backed breakouts** aligned with **SuperTrend and RSI confirmation** provide high-probability entries. When volatility expands after a squeeze and price clears resistance with momentum, it often signals **institutional breakout strength** and **early trend continuation**.
⚠️ Disclosure & Disclaimer – Please Read Carefully
The information shared here is meant purely for learning and awareness.
It is not a buy or sell recommendation and should not be taken as investment advice.
I am not a SEBI-registered investment adviser, and all views expressed are based on personal study, chart patterns, and publicly available market data.
Position Status: No active position in BSE at the time of analysis.
Data Source: TradingView & NSE India (Past Chart Reference) (Historical levels)
Trading — whether in stocks or options — carries risk. Markets can move unexpectedly, and losses can sometimes exceed the capital you have invested.
Past performance or setups do not guarantee future results.
If you are a beginner, treat this as a learning example and practice with paper trades before risking real money.
If you are experienced, always assess your own risk, position sizing, and strategy suitability before entering trades.
Consult a SEBI-registered financial adviser before making any real trading decision.
By engaging with this content, you acknowledge full responsibility for your trades and investments.
________________________________________
💬 Found this useful?
🔼 Give this post a Boost to help more traders discover structured learning.
✍️ Drop your thoughts, questions, or setups in the comments — let’s grow together!
🔁 Share with fellow traders and beginners to spread awareness.
👉 “If you liked this breakdown, follow for more clean, structured setups with discipline at the core.”
🚀 Stay Calm. Stay Clean. Trade With Patience.
Trade Smart | Learn Zones | Be Self-Reliant 📊
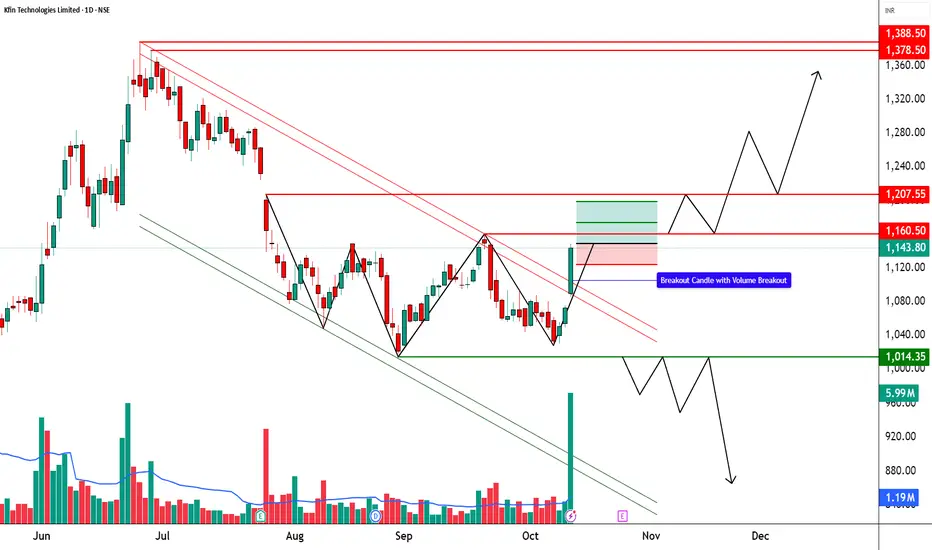
KFINTECH - Bullish Breakout from Consolidation | STWP AnalysisTicker: NSE: KFINTECH | Sector: Financial Services & Technology
CMP: 1149.00
Rating: ⭐⭐⭐⭐ (Bullish Breakout Setup – Educational Purposes Only)
Pattern Observed: 📈 Chart Pattern – Range Breakout from Base Support
Candlestick Pattern: Bullish Marubozu | Breakout Candle
📈 KFin Technologies – Bullish Breakout from Consolidation | STWP Analysis
________________________________________
🏦 Stock Introduction
KFin Technologies Ltd. has recently shown a remarkable shift in momentum, breaking out from its prolonged consolidation phase. The stock has moved decisively from its base near ₹1,018, signaling renewed buying interest and accumulation by institutional players. The breakout candle, accompanied by a strong surge in volume, positions KFin Technologies as one of the most promising short-term bullish setups in the current market structure.
________________________________________
💹 Price Action Overview
The stock displayed a powerful bullish candle, breaking above key resistance levels with conviction. The stock has now flipped its master level of ₹1,084.59 from resistance into strong support, confirming that bulls are taking control.
________________________________________
🟨 Technical Indicators Summary The chart reflects a strong bullish candle supported by multiple indicator confirmations. There’s a clear RSI breakout, signaling renewed buying strength, while a MACD crossover adds momentum confirmation to the uptrend. The Bullish SuperTrend indicator aligns with the price movement, reinforcing the positive sentiment. Additionally, a Bollinger Band Squeeze-Off breakout is expected, suggesting that volatility expansion may drive the price higher in the coming sessions. Altogether, these technical signals point toward a powerful short-term bullish momentum with potential for continuation.
________________________________________
🟩 Trade Analysis A clear bullish breakout setup is visible with a strong entry at ₹1,149, supported by impressive momentum and extremely high volume. The candle structure confirms aggressive buying interest, indicating renewed confidence in the stock. The stop loss is placed at ₹1,028.35, offering a defined risk of ₹120.65 per share, which keeps the trade well-balanced. This move also coincides with a master level of ₹1,084.59, now acting as a solid support zone. The surge in price, combined with high volume participation, validates the breakout strength and suggests potential for follow-through in the next trading session. On the upside, the price could face immediate resistance at ₹1,166.73, followed by ₹1,189.67 and ₹1,230.33, which will serve as profit-booking zones if the momentum sustains. Meanwhile, possible support levels are positioned at ₹1,103.13, ₹1,062.47, and ₹1,039.53, giving the setup a strong base for any short-term pullback. The surge in price and volume validates this breakout’s strength, suggesting potential continuation towards higher resistances in the near term. The volume spike of nearly 6 million indicates institutional participation, validating the strength of the breakout. Key support levels are placed at ₹1,105 (23.6% retracement) and ₹1,018 (base support), offering a solid foundation for the ongoing uptrend. On the upside, immediate resistance lies around ₹1,160 (38.2% level), followed by ₹1,203 (50%), ₹1,247 (61.8%), and ₹1,309 (78.6%) — these Fibonacci levels will act as potential profit-booking zones if momentum sustains. With the RSI and CCI both showing bullish crossovers, and momentum indicators confirming strength, the price action suggests a continuation pattern towards ₹1,200+ levels in the near term.
________________________________________
KFin Technologies has delivered a strong bullish breakout right from its bottom range support near ₹1,018.7, confirming renewed buying interest after a prolonged consolidation phase. The stock has respected its lower demand zone multiple times, and this recent breakout comes with a powerful surge in volume (~6M) — a strong sign of accumulation and institutional participation. On a broader structure, the stock continues to trade within a wide range between ₹1,018 (bottom) and ₹1,378 (top) — and a sustained move above the mid-range resistance can open the path toward the upper band. This price behavior, combined with strong momentum indicators and high volume, signals the potential beginning of a range-to-range rally in the coming sessions.
________________________________________
Final Outlook:
Momentum: Strong | Trend: Bullish | Risk: Moderate | Volume: High
________________________________________
💡 Learning Note
This setup demonstrates the power of combining price action, Fibonacci levels, and volume confirmation. A bullish breakout supported by heavy volume, indicator alignment, and a clean structure often offers one of the most reliable swing trade frameworks. Pullbacks into fib-based demand zones followed by renewed buying are high-probability continuation setups.
________________________________________
⚠️ Disclosure & Disclaimer – Please Read Carefully
The information shared here is meant purely for learning and awareness. It is not a buy or sell recommendation and should not be taken as investment advice. I am not a SEBI-registered investment adviser, and all views expressed are based on personal study, chart patterns, and publicly available market data.
Trading—whether in stocks or options—carries risk. Markets can move unexpectedly, and losses can sometimes exceed the money you have invested. Past performance or past setups do not guarantee future results.
If you are a beginner, treat this as a guide to understand how the market works and practice on paper trades before risking real money. If you are experienced, always assess your own risk, position sizing, and strategy suitability before entering trades.
Consult a SEBI-registered financial adviser before making any real trading decision. By engaging with this content, you acknowledge full responsibility for your trades and investments.
Position Status: No active position in KFINTECH at the time of analysis.
Data Source: TradingView & NSE India (Past Chart Reference) (Historical levels)
💬 Found this useful?
🔼 Give this post a Boost to help more traders discover clean, structured learning.
✍️ Drop your thoughts, questions, or setups in the comments — let’s grow together!
🔁 Share with fellow traders and beginners to spread awareness.
👉 “If you liked this breakdown, follow for more clean, structured setups with discipline at the core.”
🚀 Stay Calm. Stay Clean. Trade With Patience.
Trade Smart | Learn Zones | Be Self-Reliant 📊
STWP Analysis | ICICI Bank Showing Classic Breakout Behavior________________________________________
💼 ICICI BANK (NSE: ICICIBANK) | CMP ₹1436.60 (+1.36%)
Sector: Banking & Financial Services | Date: 19 Oct 2025
________________________________________
📊 Chart Summary
ICICI Bank closed strong at ₹1436.60, gaining +1.36% from its previous close of ₹1417.30.
Price made a high of ₹1439.60 — exactly around the Fibonacci resistance zone of ₹1439.85.
Volumes surged to 1.76x the average, with 1.70 crore shares traded against an average of 1.35 crore — indicating strong participation and renewed interest.
________________________________________
🟡 Technical Indicators Summary (Yellow Label Insight)
The chart highlights Bullish Momentum supported by a Strong Bullish Candle, indicating renewed buying interest.
A clear RSI breakout (68.36) confirms strengthening momentum, while the Bollinger Band breakout signals expanding volatility — often a precursor to a sharp directional move.
MACD at 8.33, CCI at 203.06, and Stochastic at 96.91 collectively point to short-term strength, while VWAP at 1427.77 serves as immediate support.
This confluence of volume + structure + volatility aligns perfectly for a potential breakout continuation.
________________________________________
📈 Price Action & Key Levels
The stock has been moving within a base range of ₹1342.6 – ₹1500, and has now approached the upper resistance band.
Immediate Resistance: 1447 / 1458 / 1476
Immediate Support: 1418 / 1400 / 1390
VWAP: 1427.77
A sustained close above 1439.60–1440 can confirm a bullish breakout, with upside potential toward 1466.30 → 1500 zone.
________________________________________
🧭 STWP Trade Analysis
Bias: Bullish
Breakout Level: Above 1439.60
Intraday Support: 1428
Swing Support: 1384
Intermediate Support: 1342
Momentum: Moderate
Trend: Bullish
Risk: Low
Volume: High
📌 Observation: The candle structure suggests a “volume-backed breakout” that may see short-term profit-booking near 1447 but remains structurally bullish if above VWAP.
________________________________________
🧾 Quick View: Q2 FY26 Results Snapshot
ICICI Bank reported a 5% YoY rise in PAT to ₹12,359 crore, supported by a 7.4% rise in Net Interest Income (₹21,529 crore) and improved asset quality.
Lower provisions and healthy loan growth kept the bottom line stable, while core operating profit rose 6.5% YoY.
With a clean balance sheet and improving credit metrics, the results complement the ongoing bullish technical setup — reinforcing confidence in trend continuation.
________________________________________
🧩 Final Outlook
ICICI Bank exhibits bullish momentum with low-risk positioning.
The current move represents a technical + fundamental confluence breakout, supported by strong volumes and improving financial health.
Traders may watch for price action near 1439–1447 zone for confirmation and potential swing continuation toward ₹1500 in the coming sessions.
________________________________________
🧠 Learning Note (Educational Purpose)
This setup perfectly demonstrates how volume expansion + momentum oscillator alignment + earnings strength often precedes meaningful breakouts in large-cap banking stocks.
Always track VWAP & RSI stability post-breakout — they often determine whether the move sustains or fades.
________________________________________
⚠️ Disclosure & Disclaimer (SEBI-Compliant)
This content is created solely for educational and informational purposes to help readers understand technical analysis and market structure.
It does not constitute investment advice, research recommendation, or a solicitation to buy or sell any security.
The author is not a SEBI-registered investment adviser or research analyst.
All charts, patterns, and levels are based on personal study and historical data available from public sources such as TradingView and NSE India.
Position Status: No active position in ICICIBANK at the time of publication.
Trading and investing involve risk. Market movements can be unpredictable, and losses may exceed invested capital.
Readers are strongly advised to consult a SEBI-registered investment adviser before making any trading or investment decisions.
By engaging with this post, you acknowledge that you take full responsibility for your own trades, decisions, and outcomes.
________________________________________
💬 Found this useful?
🔼 Boost this post to support structured learning content.
✍️ Share your thoughts, questions, or observations — let’s grow together!
🔁 Share with learners and traders to promote responsible market education.
👉 “If you liked this breakdown, follow for more disciplined, educational trade setups.”
🚀 Stay Calm. Stay Clean. Trade With Patience.
Trade Smart | Learn Zones | Be Self-Reliant 📊

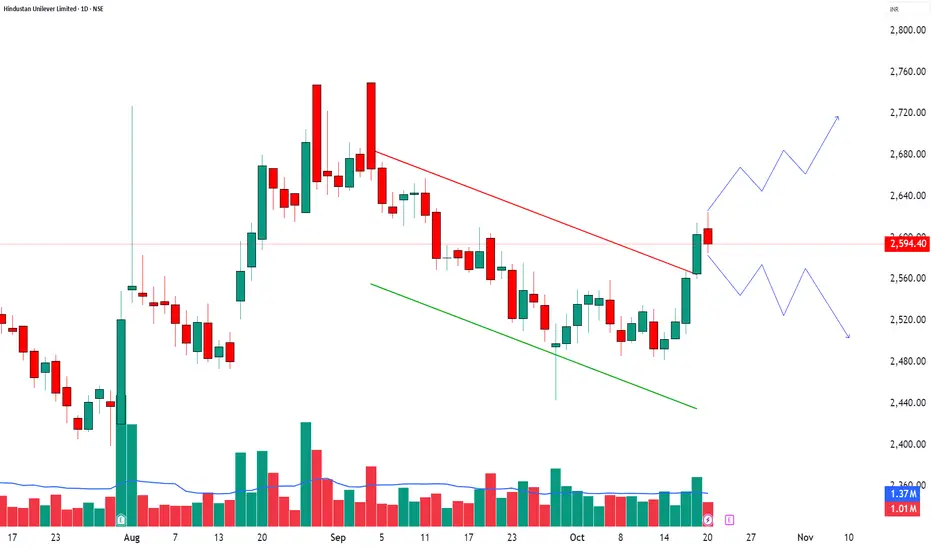
HINDUNILVR – Bulls Resting, Bears Watching💹 Hindustan Unilever Ltd (NSE: HINDUNILVR)
Sector: FMCG | CMP: ₹2,610.80 | View: Neutral-to-Bullish Zone Reaction Setup
Key Levels:
Resistance: 2618/2641/2657
Support: 2578/2562/2539
STWP Trade Analysis:
A Retested Demand zone: 2509.20 – 2482.30
Stock has moved up almost 4% in the last 4 days.
The bulls seem to have taken a rest at these levels.
Two possible scenarios:
🟢 Scenario 1 – Bulls Take Charge: I will buy @ 2624.70 with a stop at around 2583.45
View: Bullish continuation setup if price sustains above 2620 zone.
🔴 Scenario 2 – Bears Take Charge: I will sell at 2585.60 with a stop at around 2626.85
View: Reversal setup if price fails to hold above 2618 and selling pressure builds.
───────────────────────────────────────────────
⚠️ **DISCLOSURE & DISCLAIMER (SEBI-Compliant)**
───────────────────────────────────────────────
📘 **Purpose:**
This content is created **solely for educational and informational purposes** to help readers understand market structure, price action, and technical analysis.
It does **not constitute investment advice**, research recommendation, or a solicitation to buy or sell any security.
👤 **Author Disclosure:**
The author is **not a SEBI-registered investment adviser or research analyst.**
All chart studies, price levels, and observations are based on publicly available data (e.g., **NSE India**, **TradingView**) and are presented purely for **learning illustration**.
📊 **Position Status:**
No active position in * * at the time of publication.
“The author may sometimes trade in the securities discussed, but such trades are independent and shared here only for educational understanding.”
⚠️ **Risk Disclosure:**
Trading and investing involve financial risk. Market movements can be unpredictable, and losses may exceed invested capital.
Readers are strongly advised to consult a **SEBI-registered investment adviser** before making any trading or investment decisions.
🧠 **Responsibility Clause:**
By engaging with this post, you acknowledge that you are **solely responsible for your own trading or investment decisions**, and that this content is intended only for **market education and awareness**.
───────────────────────────────────────────────
💬 **Did You Find This Useful?**
If this analysis helped you understand price structure or market psychology better:
🔼 **Boost** to support transparent & structured financial education.
✍️ **Comment** your insights, observations, or questions — let’s learn together.
🔁 **Share** this post with learners and aspiring traders who value discipline.
📚 **Follow stwp** for more structured, educational breakdowns on stocks & setups.
🚀 *Stay Calm. Stay Clean. Trade With Patience.*
💡 *Trade Smart | Learn Zones | Be Self-Reliant.*
───────────────────────────────────────────────
ASIANPAINT – Bullish Rest Zone Setup | Watch 2537–2500 🎨 ASIAN PAINTS LTD (NSE: ASIANPAINT)
Sector: Paints & Coatings | CMP: 2,516.00 | View: Bullish Rest Zone Setup
Key Levels
Resistance: 2575 / 2615 / 2640
Support: 2500 / 2478 / 2442
STWP Trade Analysis:
Stock has moved up almost 9% in the last 4 days.
Currently, the stock is resting within a tight consolidation range after a wide bullish bar, forming a Bullish Rest Zone between 2,537.10 and 2,500.70.
Two possible scenarios:
🟢 Scenario 1 – Bulls Take Charge: I would buy @ 2537.10 with a stop at around 2498.40
View: Fresh momentum supported by volume breakout, clear structural strength, and a smooth candle recovery pattern.
🔴 Scenario 2 – Bears Take Charge: I would sell at 2500.70 with a stop at around 2539.4
View: Short-term pullback setup toward 2478–2450 if price loses 2500 zone.
───────────────────────────────────────────────
⚠️ **DISCLOSURE & DISCLAIMER (SEBI-Compliant)**
───────────────────────────────────────────────
📘 **Purpose:**
This content is created **solely for educational and informational purposes** to help readers understand market structure, price action, and technical analysis.
It does **not constitute investment advice**, research recommendation, or a solicitation to buy or sell any security.
👤 **Author Disclosure:**
The author is **not a SEBI-registered investment adviser or research analyst.**
All chart studies, price levels, and observations are based on publicly available data (e.g., **NSE India**, **TradingView**) and are presented purely for **learning illustration**.
📊 **Position Status:**
No active position in * * at the time of publication.
“The author may sometimes trade in the securities discussed, but such trades are independent and shared here only for educational understanding.”
⚠️ **Risk Disclosure:**
Trading and investing involve financial risk. Market movements can be unpredictable, and losses may exceed invested capital.
Readers are strongly advised to consult a **SEBI-registered investment adviser** before making any trading or investment decisions.
🧠 **Responsibility Clause:**
By engaging with this post, you acknowledge that you are **solely responsible for your own trading or investment decisions**, and that this content is intended only for **market education and awareness**.
───────────────────────────────────────────────
💬 **Did You Find This Useful?**
If this analysis helped you understand price structure or market psychology better:
🔼 **Boost** to support transparent & structured financial education.
✍️ **Comment** your insights, observations, or questions — let’s learn together.
🔁 **Share** this post with learners and aspiring traders who value discipline.
📚 **Follow stwp** for more structured, educational breakdowns on stocks & setups.
🚀 *Stay Calm. Stay Clean. Trade With Patience.*
💡 *Trade Smart | Learn Zones | Be Self-Reliant.*
───────────────────────────────────────────────

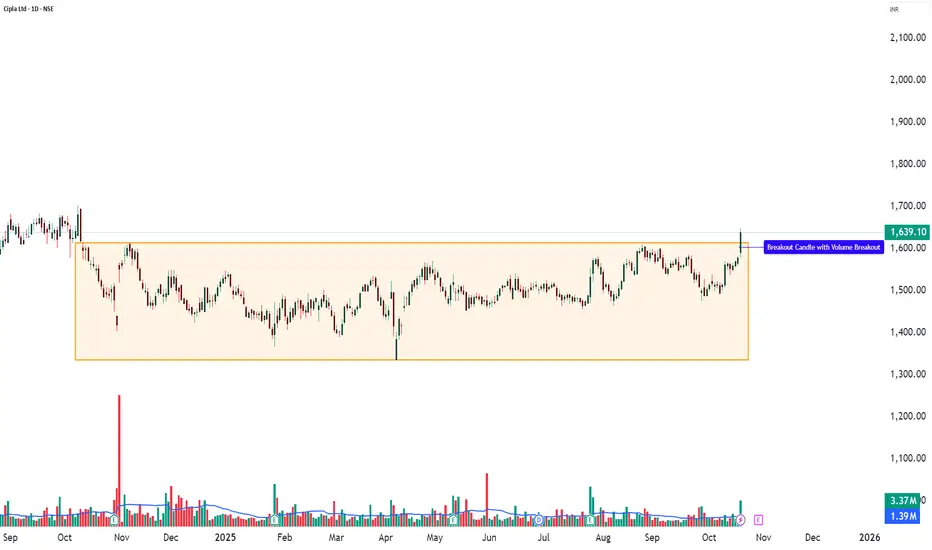
CIPLA – 10-Day Volume Breakout | Bullish Continuation Setup💹 Cipla Ltd (NSE: CIPLA)
Sector: Pharmaceuticals | CMP: ₹1,639.10 | View: Bullish Continuation Setup
🔹 Technical Analysis / Chart Pattern / Price Action / Volume Analysis:
Cipla Ltd shows strong bullish momentum with a clear breakout candle supported by a significant volume surge of 3,372,906 shares, compared to its 20-day average of 1,386,709 shares — a rise of over 2.4 times. This confirms fresh institutional buying and genuine participation behind the move. The open-equals-low formation reflects strong buyer control from the start, while a Bollinger Band breakout with a BB squeeze-off signals that volatility compression has ended, hinting at a sharp upward continuation. The RSI breakout further supports growing momentum, and consistent volume expansion validates trend strength. Overall, the setup represents a bullish continuation structure, where price, volume, and momentum align perfectly — a textbook example of a powerful breakout phase supported by conviction buying.
🔹 Key Levels:
Resistance: 1665 / 1690 / 1733
Support: 1566 / 1537 / 1498
🔹 STWP Trade Analysis:
Bias: Bullish
Breakout Level: 1647
Intraday Support: 1620
Swing Support: 1553
Intermediate Support: 1535
🔹 HNI Trade Analysis:
Possible Accumulation Level: 1639 - 1647
Possible Low Levels: 1629
Support Levels: 1624 - 1606
🔹 Final Outlook:
Momentum: Moderate | Trend: Neutral | Risk: Low | Volume: High
🔹 Learning Note (Educational Purpose):
This setup is a great example of how a breakout with strong volume and RSI confirmation can signal a shift from consolidation to momentum. It helps learners understand that when price, volume, and indicators align together, it often leads to a trend continuation phase. Always observe how volume expands during breakouts — it’s one of the strongest clues of institutional activity.
🔹 STWP Mentor Note:
A clean breakout backed by strong volume is not just a signal — it’s a lesson in patience and timing. Smart traders wait for clarity, not noise. As a learner, focus on identifying structure, strength, and sustainability in every move. Remember, every breakout teaches discipline — stay consistent, study reactions, and always trade with patience and purpose.
───────────────────────────────────────────────
⚠️ **DISCLOSURE & DISCLAIMER (SEBI-Compliant)**
───────────────────────────────────────────────
📘 **Purpose:**
This content is created **solely for educational and informational purposes** to help readers understand market structure, price action, and technical analysis.
It does **not constitute investment advice**, research recommendation, or a solicitation to buy or sell any security.
👤 **Author Disclosure:**
The author is **not a SEBI-registered investment adviser or research analyst.**
All chart studies, price levels, and observations are based on publicly available data (e.g., **NSE India**, **TradingView**) and are presented purely for **learning illustration**.
📊 **Position Status:**
No active position in * * at the time of publication.
“The author may sometimes trade in the securities discussed, but such trades are independent and shared here only for educational understanding.”
⚠️ **Risk Disclosure:**
Trading and investing involve financial risk. Market movements can be unpredictable, and losses may exceed invested capital.
Readers are strongly advised to consult a **SEBI-registered investment adviser** before making any trading or investment decisions.
🧠 **Responsibility Clause:**
By engaging with this post, you acknowledge that you are **solely responsible for your own trading or investment decisions**, and that this content is intended only for **market education and awareness**.
───────────────────────────────────────────────
💬 **Did You Find This Useful?**
If this analysis helped you understand price structure or market psychology better:
🔼 **Boost** to support transparent & structured financial education.
✍️ **Comment** your insights, observations, or questions — let’s learn together.
🔁 **Share** this post with learners and aspiring traders who value discipline.
📚 **Follow stwp** for more structured, educational breakdowns on stocks & setups.
🚀 *Stay Calm. Stay Clean. Trade With Patience.*
💡 *Trade Smart | Learn Zones | Be Self-Reliant.*
───────────────────────────────────────────────
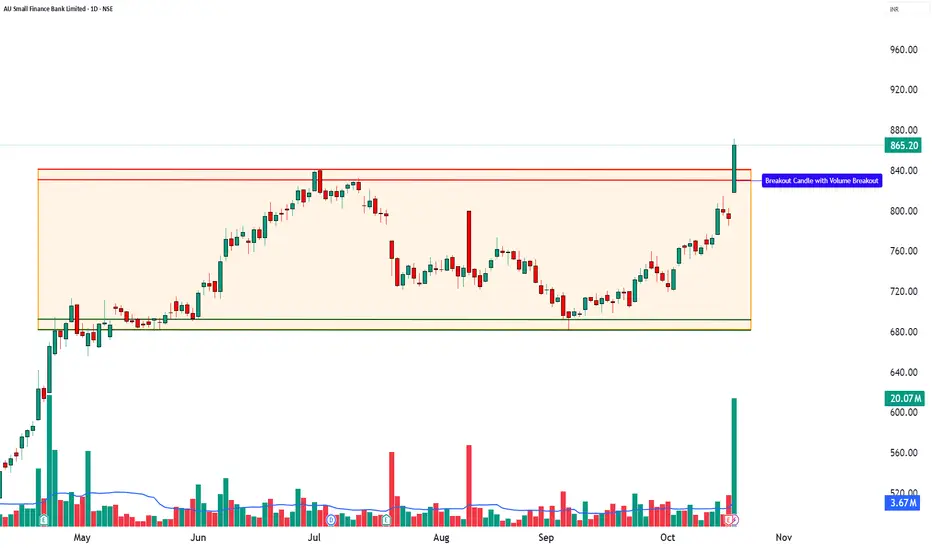
AUBANK – 52-Week Breakout with Strong Volume💹 A.U. Small Finance Bank Ltd (NSE: AUBANK)
Sector: Banking & Finance | CMP: ₹865.20 | View: Bullish Momentum Setup
🔹Price Action:
A.U. Small Finance Bank showed strong upward movement with a big green candle and very high trading volume. The stock opened at its lowest point and kept rising all day, which means buyers were in full control. It also made a new 52-week high, showing that momentum and confidence are strong. In simple words, the stock is breaking out with power, and buyers are clearly leading the trend.
🔹 Technical Analysis:
AUBANK is showing strong bullish momentum with a clear 52-week breakout, signaling fresh buying interest and strong confidence among traders. The big green candle with open-equals-low formation shows that buyers were active right from the start of the session. The RSI at 81 reflects strong momentum, while MACD at 9.35 confirms a positive crossover, adding to the bullish view. Similarly, CCI at 258 and Stochastic at 96 indicate powerful buying pressure, suggesting that the uptrend is well-supported. The VWAP at ₹855.39 is acting as an important support level, helping the price stay stable even during intraday pullbacks. Meanwhile, a Bollinger Band breakout and a BB squeeze-off pattern hint that the stock may continue its sharp upward move. Altogether, the indicators show a well-supported bullish setup, ideal for short to medium-term swing trades.
🔹 Volume Analysis:
The stock saw a huge rise in trading volume — almost 5 times higher than normal! This is a strong sign that big investors or institutions are showing interest. Such a jump in both price and volume means the breakout is real and reliable, not just a short-term move. This kind of volume confirms fresh buying and positive sentiment, suggesting the stock could stay strong for some time.
🔹 Chart Analysis:
For months, AUBANK was moving sideways between ₹680 and ₹840. Now, it has broken above ₹840 with heavy volume, showing that the stock has ended its consolidation phase and started a new bullish trend. This breakout shows that buyers are taking charge, and if the volume remains high, the stock may continue to move upward in the coming sessions.
🔹 Demand Zone: ₹814 – ₹785
This area acts as a strong demand zone, where earlier buying interest was visible. If the price revisits this zone, it may attract fresh accumulation or renewed buying activity. Traders and learners can observe this region for potential re-entry setups once the price shows signs of stability or reversal — purely for educational understanding of demand zone behavior in momentum setups.
🔹 Key Levels:
Resistance: 885/905/939
Support: 832/798/778
🔹 STWP Trade Analysis:
Bias: Bullish
Breakout Level: 872
Intraday Support: 851
Swing Support: 783
Intermediate Support: 680
Observation:
🔹 Final Outlook:
Momentum: Moderate | Trend: Neutral | Risk: High | Volume: High
The setup shows strong bullish signs but comes after a sharp rally, so short-term volatility can be expected. Sustained volume above ₹850 will keep the trend positive.
🔹 Learning Note (Educational Purpose):
This setup is a good example of how volume + breakout candles signal a shift in momentum. It teaches traders that when price breaks resistance with strong volume, it often marks the beginning of a new trend rather than the end of one. Always confirm with RSI/MACD alignment for reliability.
🔹 STWP Mentor Note:
Momentum trading works best when price, structure, and volume align together. Always look for clean breakouts backed by heavy volume — they tell you where smart money is moving. As a trader, focus more on learning price behavior than just chasing the move. Every breakout teaches patience, confidence, and timing — three pillars of successful trading.
───────────────────────────────────────────────
⚠️ **DISCLOSURE & DISCLAIMER (SEBI-Compliant)**
───────────────────────────────────────────────
📘 **Purpose:**
This content is created **solely for educational and informational purposes** to help readers understand market structure, price action, and technical analysis.
It does **not constitute investment advice**, research recommendation, or a solicitation to buy or sell any security.
👤 **Author Disclosure:**
The author is **not a SEBI-registered investment adviser or research analyst.**
All chart studies, price levels, and observations are based on publicly available data (e.g., **NSE India**, **TradingView**) and are presented purely for **learning illustration**.
📊 **Position Status:**
No active position in * * at the time of publication.
“The author may sometimes trade in the securities discussed, but such trades are independent and shared here only for educational understanding.”
⚠️ **Risk Disclosure:**
Trading and investing involve financial risk. Market movements can be unpredictable, and losses may exceed invested capital.
Readers are strongly advised to consult a **SEBI-registered investment adviser** before making any trading or investment decisions.
🧠 **Responsibility Clause:**
By engaging with this post, you acknowledge that you are **solely responsible for your own trading or investment decisions**, and that this content is intended only for **market education and awareness**.
───────────────────────────────────────────────
💬 **Did You Find This Useful?**
If this analysis helped you understand price structure or market psychology better:
🔼 **Boost** to support transparent & structured financial education.
✍️ **Comment** your insights, observations, or questions — let’s learn together.
🔁 **Share** this post with learners and aspiring traders who value discipline.
📚 **Follow STWP** for more structured, educational breakdowns on stocks & setups.
🚀 *Stay Calm. Stay Clean. Trade With Patience.*
💡 *Trade Smart | Learn Zones | Be Self-Reliant.*
───────────────────────────────────────────────
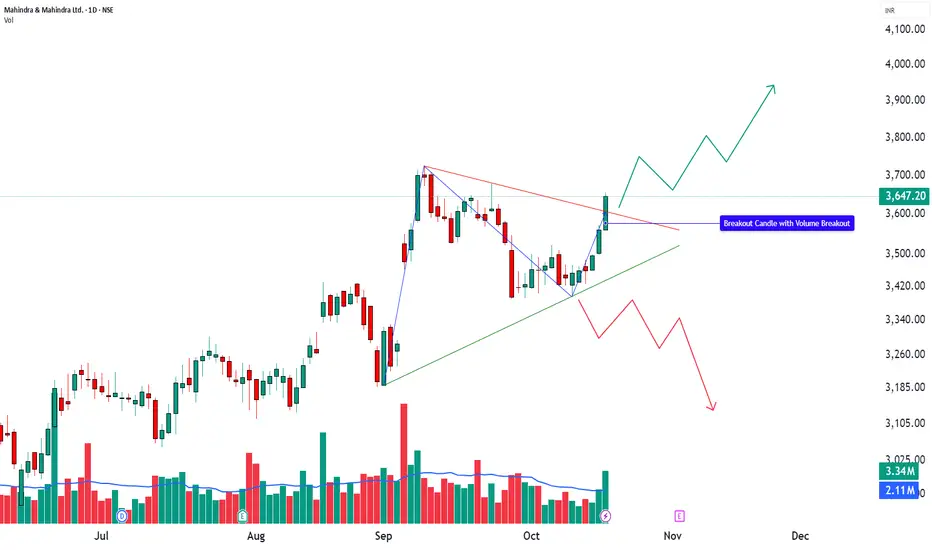
M&M Breaks Out with Volume Support | Structure Meets Momentum________________________________________
🚙 MAHINDRA & MAHINDRA LTD (NSE: M&M) | CMP ₹3,647.20 (+2.43%)
Sector: Auto | Date: 19 Oct 2025
________________________________________
🔹 Price Action:
M&M posted a strong bullish candle, closing near day’s high at ₹3,647.20 with gains of +2.43%.
Volume surged to 3.34M shares, nearly 2.2× the 20-day average volume (2.10M) — a clear sign of institutional and HNI participation.
The stock confirmed a bullish breakout above ₹3,656, marking a shift from a phase of consolidation to one of expansion.
________________________________________
🔹 Technical Analysis:
Momentum indicators are clearly aligned in favour of the bulls, confirming strength across multiple parameters. RSI (65.55) has broken above its midline, signalling momentum expansion, while MACD (9) shows a positive crossover that reinforces directional conviction. CCI (129.03) reflects sustained trend acceleration, and though Stochastic (96.65) remains in overbought territory, it supports ongoing breakout momentum. The VWAP at ₹3,629.84 acts as an immediate dynamic support, maintaining short-term control with buyers. Additionally, a Bollinger Band breakout accompanied by a BBSqueeze-Off indicates expanding volatility — often a precursor to a strong continuation phase when combined with rising volume and structural breakout confirmation.
________________________________________
🔹 Chart Analysis:
M&M broke out from a symmetrical triangle structure, ending a multi-week consolidation phase.
The breakout candle formed with a wide body and heavy volume, closing near the high — a typical sign of breakout conviction.
Price structure shows higher lows and rising volume, confirming trend continuation rather than exhaustion.
________________________________________
🔹 Key Levels:
Resistance: 3,682 / 3,717 / 3,778
Support: 3,586 / 3,525 / 3,490
VWAP: 3,629.84
A short-term pullback toward VWAP or ₹3,586 could act as a healthy retest before continuation.
Holding above ₹3,525 will keep the structure intact, maintaining bullish control.
________________________________________
🔹 STWP Trade Analysis:
Bias: Bullish
Breakout Level: ₹3,656
Intraday Support: ₹3,619
Swing Support: ₹3,456
Intermediate Support: ₹3,421
Momentum: Strong
Trend: Bullish
Risk: Low
Volume: High
📌 Observation: The breakout candle supported by rising volume and MACD confirmation signals a trend continuation setup with clearly defined risk zones.
________________________________________
🔹 HNI Trade Setup:
Fresh HNI accumulation seen around ₹3,647–₹3,656, supported at ₹3,501, and additional buying interest visible near ₹3,639 with support at ₹3,475.
This structure indicates layered accumulation, suggesting that larger players are positioning within the consolidation rather than chasing price above resistance.
________________________________________
🔹 Final Outlook:
Momentum: Strong | Trend: Bullish | Risk: Low | Volume: High
M&M’s structure indicates a breakout-driven continuation phase backed by volume and indicator alignment.
As long as price holds above ₹3,525, the trend bias remains bullish, with scope for upside toward ₹3,717–₹3,778 in the near term.
A dip toward VWAP or EMA supports would represent healthy price normalization, not weakness.
________________________________________
🔹 Learning Note (Educational Purpose):
This setup showcases how volume + structure + indicator confluence confirms a genuine breakout.
It also demonstrates how smart money accumulates during compression, not after expansion — a crucial lesson for breakout traders.
M&M provides a textbook example of how post-consolidation breakouts evolve into expansion phases.
________________________________________
🔹 STWP Mentor Note:
“Momentum isn’t about chasing; it’s about recognizing conviction early.
M&M’s breakout is a fine example of structure, participation, and patience working in perfect rhythm — where price doesn’t just move, it evolves with purpose.”
________________________________________
───────────────────────────────────────────────
⚠️ **DISCLOSURE & DISCLAIMER (SEBI-Compliant)**
───────────────────────────────────────────────
📘 **Purpose:**
This content is created **solely for educational and informational purposes** to help readers understand market structure, price action, and technical analysis.
It does **not constitute investment advice**, research recommendation, or a solicitation to buy or sell any security.
👤 **Author Disclosure:**
The author is **not a SEBI-registered investment adviser or research analyst.**
All chart studies, price levels, and observations are based on publicly available data (e.g., **NSE India**, **TradingView**) and are presented purely for **learning illustration**.
📊 **Position Status:**
No active position in * * at the time of publication.
“The author may sometimes trade in the securities discussed, but such trades are independent and shared here only for educational understanding.”
⚠️ **Risk Disclosure:**
Trading and investing involve financial risk. Market movements can be unpredictable, and losses may exceed invested capital.
Readers are strongly advised to consult a **SEBI-registered investment adviser** before making any trading or investment decisions.
🧠 **Responsibility Clause:**
By engaging with this post, you acknowledge that you are **solely responsible for your own trading or investment decisions**, and that this content is intended only for **market education and awareness**.
───────────────────────────────────────────────
💬 **Did You Find This Useful?**
If this analysis helped you understand price structure or market psychology better:
🔼 **Boost** to support transparent & structured financial education.
✍️ **Comment** your insights, observations, or questions — let’s learn together.
🔁 **Share** this post with learners and aspiring traders who value discipline.
📚 **Follow @STWP** for more structured, educational breakdowns on stocks & setups.
🚀 *Stay Calm. Stay Clean. Trade With Patience.*
💡 *Trade Smart | Learn Zones | Be Self-Reliant.*
───────────────────────────────────────────────
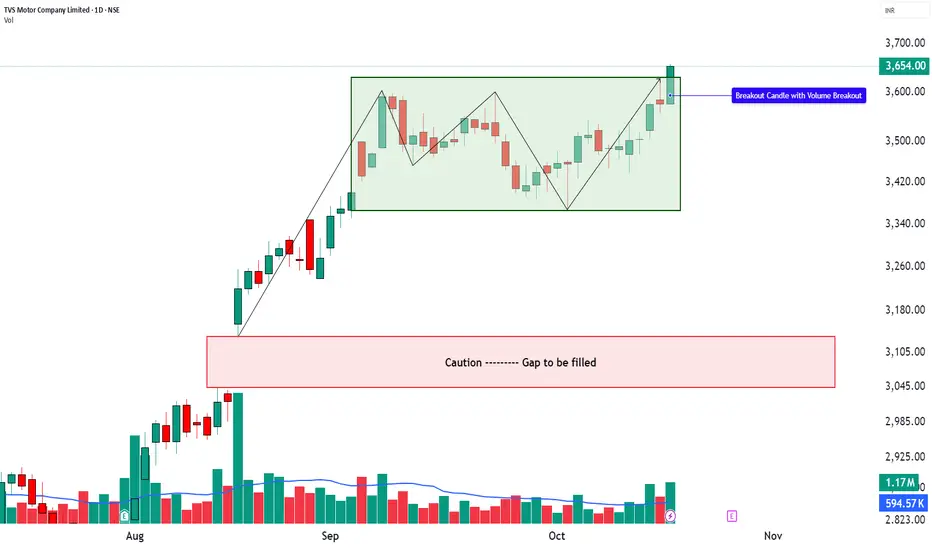
TVS Motor | 52-Week Breakout Case Study________________________________________
🏍️ TVS MOTOR (NSE: TVSMOTOR) | CMP 3,658.00
Sector: Auto & 2-Wheeler | Date: 19 Oct 2025
________________________________________
📊 Chart Summary
TVS Motor has delivered a 52-week breakout with a strong bullish Marubozu candle, signalling aggressive buying momentum.
The stock closed firmly near day’s high, reinforcing confidence among participants.
This move comes after a sustained consolidation phase, with volumes spiking well above the short-term average — confirming institutional and HNI participation around the 3,650 zone.
Structurally, the stock is transitioning from a Consolidation Phase into an Expansion Phase, marking the possible beginning of a fresh markup leg.
________________________________________
🟡 Technical Indicators Summary
The chart highlights Bullish Momentum supported by a Strong Bullish Marubozu, indicating conviction among buyers.
A clear RSI breakout (76) confirms strengthening momentum, while the Bollinger Band breakout and BBSqueeze-Off suggest volatility expansion — often preceding strong directional moves.
MACD at 5.54 shows a positive crossover, CCI 205.96 signals extended strength, and Stochastic 98.62 confirms short-term over-extension yet strong momentum.
VWAP support at 3,639.46 keeps intraday trend structure intact.
This confluence reflects multi-indicator alignment — the kind of structure often seen in sustained breakout phases.
________________________________________
📈 Price Action & Key Levels
Resistance: 3683 / 3712 / 3765
Support: 3600 / 3547 / 3518
VWAP: 3639.46
The breakout occurred above 3,658, which now acts as a pivot zone.
Sustaining above this level could keep momentum active, whereas any dip toward VWAP or ₹3,600 may offer short-term retest potential.
________________________________________
🧭 STWP Trade Analysis
Bias: Bullish
Breakout Level: Above 3658
Intraday Support: 3626
Swing Support: 3501
Intermediate Support: 3274
Momentum: Moderate
Trend: Neutral (Turning Bullish)
Risk: Low
Volume: High
📌 Observation: The strong candle structure backed by volume and RSI expansion suggests continued bullish sentiment.
A possible HNI setup was visible near 3654–3658 with support at 3518, while a lower build-up setup is also seen near 3647 with support at 3493 — confirming tiered accumulation.
________________________________________
🧭 STWP Note – Gap-Up Retest Zone
If TVS Motor opens gap-up above ₹3,658, key pullback levels to watch are ₹3,639 (VWAP), ₹3,547 (EMA support), and ₹3,443 (0.786 Fibonacci level). A mild, low-volume pullback toward these zones would represent a healthy retest within the ongoing expansion phase. The breakout remains valid and momentum bullish as long as price holds above ₹3,443.
________________________________________
📘 Learning Perspective (Educational Insight)
TVS Motor’s setup illustrates how multiple bullish confirmations (RSI breakout, MACD crossover, BB expansion, and VWAP strength) can align during a 52-week breakout phase.
The pattern teaches traders to spot volume-backed momentum near higher-timeframe resistance zones — a sign that larger players may be entering.
________________________________________
🧩 Final Outlook
TVS Motor currently displays:
Momentum: Moderate
Trend: Neutral turning Bullish
Risk: Low
Volume: High
While KST remains mildly bearish (34.45), the overall setup hints at a momentum continuation phase, provided the stock sustains above 3626–3600 levels.
Traders should watch price action around 3,683–3,712 for confirmation of follow-through strength.
________________________________________
💬 STWP Mentor Note
When multiple indicators speak in one direction — price, volume, and structure often follow. Watch how VWAP and RSI behave in the next few sessions; that’s where breakout traders can learn the art of patience and precision.
________________________________________
⚠️ Disclosure & Disclaimer (SEBI-Compliant)
This content is created solely for educational and informational purposes to help readers understand technical analysis and market structure.
It does not constitute investment advice, research recommendation, or a solicitation to buy or sell any security.
The author is not a SEBI-registered investment adviser or research analyst.
All charts, patterns, and levels are based on personal study and historical data available from public sources such as TradingView and NSE India.
Position Status: No active position in TVSMOTOR at the time of publication.
Trading and investing involve risk. Market movements can be unpredictable, and losses may exceed invested capital.
Readers are strongly advised to consult a SEBI-registered investment adviser before making any trading or investment decisions.
By engaging with this post, you acknowledge that you take full responsibility for your own trades, decisions, and outcomes.
________________________________________
💬 Found this useful?
🔼 Boost this post to support structured learning content.
✍️ Share your thoughts, questions, or observations — let’s grow together!
🔁 Share with learners and traders to promote responsible market education.
👉 “If you liked this breakdown, follow for more disciplined, educational trade setups.”
🚀 Stay Calm. Stay Clean. Trade With Patience.
Trade Smart | Learn Zones | Be Self-Reliant 📊
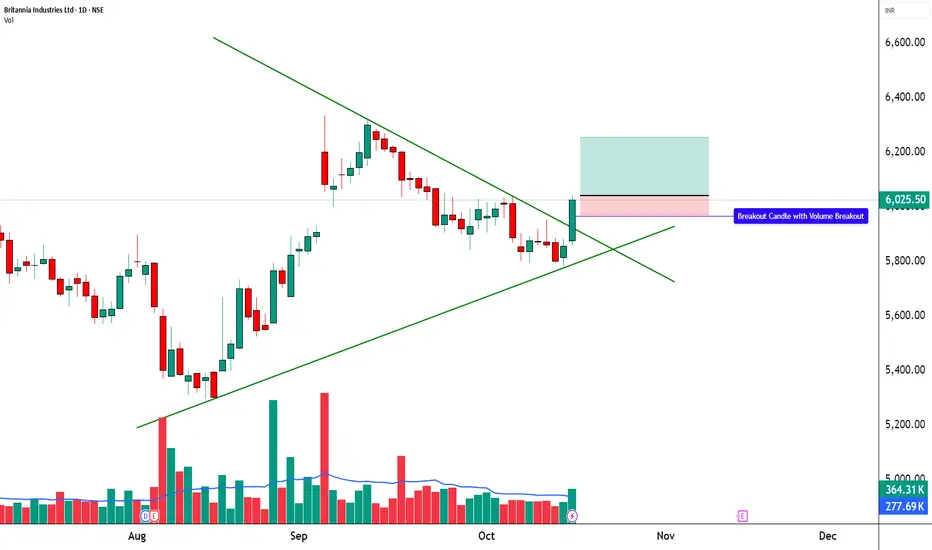
Britannia - Smart Money Accumulation | Falling Channel Breakout________________________________________
🍪 BRITANNIA INDUSTRIES LTD
Ticker: NSE: BRITANNIA | Sector: FMCG | CMP: 6,025.50 | Rating: ⚡️ Bullish Bias Emerging
________________________________________
🧭 Chart Summary
This chart of Britannia Industries Ltd (NSE) highlights a bullish breakout from a falling channel pattern after a prolonged period of controlled decline and consolidation.
The stock closed near 6,025.50, up +2.87%, forming a strong green candle backed by solid volume, signalling renewed buying strength.
The breakout above the channel’s upper trendline suggests a potential reversal of the short-term downtrend and the beginning of a new upward leg.
________________________________________
🟡 Technical Indicators Summary
The chart highlights bullish momentum supported by a strong bullish candle, indicating renewed buying interest.
A clear RSI breakout confirms strengthening momentum, while the Bollinger Band Squeeze-On Compression suggests volatility had tightened — often a precursor to a sharp directional move.
The recent liquidity sweep below key support appears to have trapped weak hands, fuelling this sharp rebound. Altogether, this setup reflects a bullish breakout zone where multiple indicators align in favour of buyers.
________________________________________
📊 Multi-Timeframe Trend View
The trend matrix shows 5m, 15m, 1H, 1W, and 1M all turning green (uptrend).
The daily is the only timeframe yet to flip, suggesting momentum is building and a daily trend alignment could soon confirm a broader upmove.
________________________________________
📈 Indicator Overview
RSI (56.9): Indicates moderate bullish strength — momentum is picking up.
MACD (-11.07): Still slightly negative but flattening, hinting at an upcoming bullish crossover.
CCI (27.3): Recovering from oversold territory, confirming a trend shift attempt.
Stochastic (94.2): Overbought zone — reflects strong short-term momentum, though minor pauses may occur.
________________________________________
🧩 Market Context
This pattern represents accumulation under resistance, commonly seen before strong breakouts in large-cap defensive stocks.
Given Britannia’s FMCG positioning, the move may also tie into a sector rotation play, as investors gravitate toward defensive sectors amid volatility in the broader markets.
________________________________________
💹 STWP Trade Analysis
Bullish Breakout Level: 6,041
Support Structure:
Intraday Support: 5,970 → Minor retest zone
Swing Support: 5,852 → Major trend-defining level
Intermediate Support: 5,776 → Key positional base
Key Levels (Subject to Daily Change):
Support: 5,909 / 5,792 / 5,726
Resistance: 6,091 / 6,157 / 6,274
________________________________________
🎓 STWP Learning
A falling channel breakout often signals that selling pressure has gradually weakened and smart money has started accumulating at lower levels.
When this pattern combines with rising volume and momentum indicators turning positive, it reflects a shift from distribution to accumulation.
Traders should note that confirmation above the breakout zone — ideally supported by volume — adds conviction to the move and reduces the risk of a false breakout.
________________________________________
⚠️ Disclosure & Disclaimer (SEBI-Compliant)
This content is created solely for educational and informational purposes to help readers understand technical analysis and market structure.
It does not constitute investment advice, research recommendation, or a solicitation to buy or sell any security.
The author is not a SEBI-registered investment adviser or research analyst.
All charts, patterns, and levels are based on personal study and historical data available from public sources such as TradingView and NSE India.
Position Status: No active position in BRITANNIA at the time of publication.
Trading and investing involve risk. Market movements can be unpredictable, and losses may exceed invested capital.
Readers are strongly advised to consult a SEBI-registered investment adviser before making any trading or investment decisions.
By engaging with this post, you acknowledge that you take full responsibility for your own trades, decisions, and outcomes.
________________________________________
💬 Found this useful?
🔼 Boost this post to support structured learning content.
✍️ Share your thoughts, questions, or observations — let’s grow together!
🔁 Share with learners and traders to promote responsible market education.
👉 “If you liked this breakdown, follow for more disciplined, educational trade setups.”
🚀 Stay Calm. Stay Clean. Trade With Patience.
Trade Smart | Learn Zones | Be Self-Reliant 📊
AUROPHARMA | Bullish Cup & Handle Breakout Setup________________________________________
🚀 Aurobindo Pharma Ltd (NSE: AUROPHARMA) | Bullish Cup & Handle Breakout Setup
📊 Current Market Snapshot
CMP: ₹1,119.90
Sector: Pharmaceuticals / Healthcare
Pattern Observed: ☕ Cup & Handle Breakout Formation
Candlestick Signal: Strong Bullish Candle + Volume Expansion
Strength Rating: ⭐⭐⭐⭐☆ (Bullish Breakout Confirmation)
________________________________________
🧭 Technical Overview
Aurobindo Pharma has formed a classic Cup and Handle pattern, signaling trend reversal and continuation strength.
After a steady base formation over the past few months, the stock has broken out above its neckline near ₹1,120 with a powerful bullish candle and rising volume — a strong indicator of institutional buying.
The cup represents accumulation, while the handle reflects a healthy consolidation before breakout.
The volume spike (~4.9M) and RSI breakout confirm momentum strength, supported further by:
✅ Bullish VWAP
✅ BB Squeeze-On Compression (volatility expansion)
✅ Fake Breakdown Recovery (liquidity sweep)
These signals collectively validate a bullish structure with potential upside continuation as long as the price sustains above ₹1,120.
________________________________________
📊 Trade Setup (Cup & Handle Breakout)
Entry: ₹1,126.30
Stop Loss: ₹1,066.80
Resistance: 1132/1145/1164
Support: 1101/1082/1070
Risk/Reward Ratio: 1 : 1 | 1:2
Volume: 4.94M (Above Average)
________________________________________
💡 Learning Note
This pattern is a textbook Cup and Handle breakout, one of the most reliable continuation patterns in technical analysis.
The rounded base (cup) indicates accumulation, while the short handle shows minor profit booking before renewed buying strength.
A decisive breakout above the neckline with volume surge confirms trend continuation — a great example of how volume + pattern confluence can guide traders toward high-probability setups.
________________________________________
⚠️ Disclosure & Disclaimer – Please Read Carefully
The information shared here is meant purely for learning and awareness.
It is not a buy or sell recommendation and should not be taken as investment advice.
I am not a SEBI-registered investment adviser, and all views expressed are based on personal study, chart patterns, and publicly available market data.
Position Status: No active position in Aurobindo Pharma at the time of analysis.
Data Source: TradingView & NSE India (Past Chart Reference) (Historical levels)
Trading — whether in stocks or options — carries risk. Markets can move unexpectedly, and losses can sometimes exceed the capital you have invested.
Past performance or setups do not guarantee future results.
If you are a beginner, treat this as a learning example and practice with paper trades before risking real money.
If you are experienced, always assess your own risk, position sizing, and strategy suitability before entering trades.
Consult a SEBI-registered financial adviser before making any real trading decision.
By engaging with this content, you acknowledge full responsibility for your trades and investments.
________________________________________
💬 Found this useful?
🔼 Give this post a Boost to help more traders discover structured learning.
✍️ Drop your thoughts, questions, or setups in the comments — let’s grow together!
🔁 Share with fellow traders and beginners to spread awareness.
👉 “If you liked this breakdown, follow for more clean, structured setups with discipline at the core.”
🚀 Stay Calm. Stay Clean. Trade With Patience.
Trade Smart | Learn Zones | Be Self-Reliant 📊
________________________________________

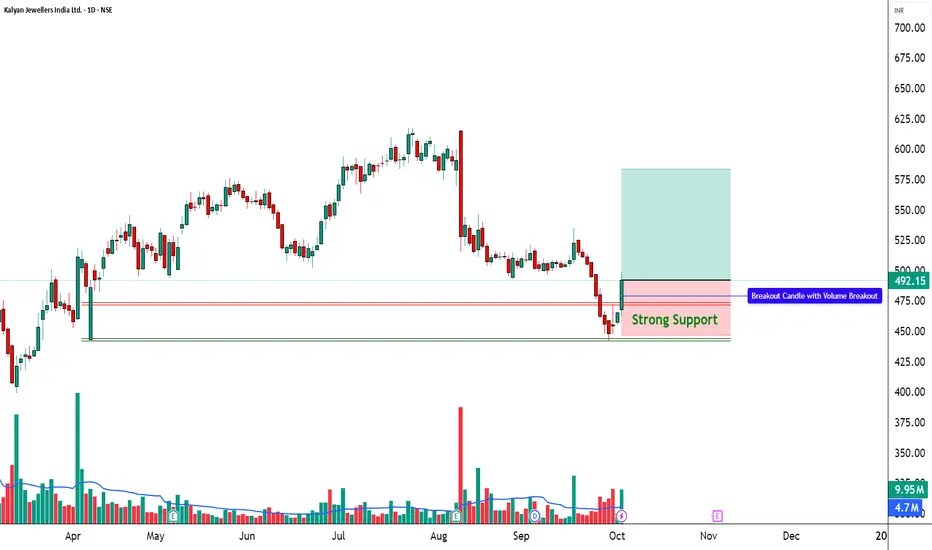
Kalyan Jewellers | RSI Breakout + High Volume Alert________________________________________
📈 Kalyan Jewellers | RSI Breakout + High Volume Alert 🚨
🔹 Entry Zone: ₹492.15
🔹 Stop Loss: ₹446.55 (Risk ~45.60 pts)
🔹 Supports: 470.48 / 448.82 / 434.93
🔹 Resistances: 506.03 / 519.92 / 541.58
________________________________________
🔑 Key Highlights
✅ Strong Bullish candle after a sharp downtrend
✅ Volume spike (9.95M vs avg 4.7M) – smart money activity detected
✅ RSI breakout – momentum shifting towards bulls
✅ Bollinger Band squeeze-off breakout expected – volatility expansion on cards
________________________________________
🎯 STWP Trade View
📊 Structure suggests short-term rebound rally possible towards ₹506–520 if momentum sustains.
⚠️ Strong supports at ₹470–448 should be watched for risk control.
________________________________________
💡 Learning Note
This setup shows how RSI breakouts with volume confirmation often lead to trend reversals. Adding multi-level support–resistance zones gives a clear trade map for both traders & investors.
________________________________________
⚠️ Disclosure & Disclaimer – Please Read Carefully
The information shared here is meant purely for learning and awareness. It is not a buy or sell recommendation and should not be taken as investment advice. I am not a SEBI-registered investment adviser, and all views expressed are based on personal study, chart patterns, and publicly available market data.
Trading—whether in stocks or options—carries risk. Markets can move unexpectedly, and losses can sometimes exceed the money you have invested. Past performance or past setups do not guarantee future results.
If you are a beginner, treat this as a guide to understand how the market works and practice on paper trades before risking real money. If you are experienced, always assess your own risk, position sizing, and strategy suitability before entering trades.
Consult a SEBI-registered financial adviser before making any real trading decision. By engaging with this content, you acknowledge full responsibility for your trades and investments.
💬 Found this useful?
🔼 Give this post a Boost to help more traders discover clean, structured learning.
✍️ Drop your thoughts, questions, or setups in the comments — let’s grow together!
🔁 Share with fellow traders and beginners to spread awareness.
👉 “If you liked this breakdown, follow for more clean, structured setups with discipline at the core.”
🚀 Stay Calm. Stay Clean. Trade With Patience.
Trade Smart | Learn Zones | Be Self-Reliant 📊
________________________________________
TATAMOTORS - Symmetrical Triangle Breakout Watch________________________________________
🚀 Tata Motors Ltd (NSE: TATAMOTORS) | Symmetrical Triangle Breakout Watch
________________________________________
🏢 Company Overview
Tata Motors Ltd is one of India’s leading automobile manufacturers, producing cars, SUVs, electric vehicles, and commercial vehicles. After an extended consolidation phase, the stock is trading inside a symmetrical triangle formation, indicating a possible strong directional move ahead.
________________________________________
📊 Current Market Snapshot
CMP: ₹718.35
Sector: Automobiles & Commercial Vehicles
Pattern Observed: 🔺 Symmetrical Triangle
Candlestick Signal: Bullish Marubozu + Strong Momentum Candle
Strength Rating: ⭐⭐⭐⭐ (Bullish Breakout Watch)
________________________________________
📈 Price Action & Chart Pattern
The stock has been consolidating within a symmetrical triangle, where buyers are defending higher lows while sellers cap gains at the resistance zone. The latest session witnessed a powerful bullish candle with extremely high volume, suggesting institutional participation.
Support Trendline: ₹665 – ₹670
Resistance Trendline: ₹720 – ₹725
Breakout Zone: Above ₹725 with strong volume
Breakdown Zone: Below ₹665 may invite fresh selling pressure
🔍 Why Important? Symmetrical triangles act as springboards for big moves once a breakout/breakdown occurs with confirmation.
________________________________________
🔎 Technical Indicators
RSI (14): 59.75 → Turning bullish with upside room.
EMA Support: Price reclaimed EMA levels, signaling renewed strength.
Volume: Recent upmove supported by 3x average volumes, a strong confirmation factor.
________________________________________
📍 Key Levels to Watch
Immediate Support: ₹665 – ₹670
Immediate Resistance: ₹720 – ₹725
Upside possible (if breakout): ₹770 – ₹800
Downside possible (if breakdown): ₹620 – ₹600
________________________________________
🔮 Bullish & Bearish Scenarios
✅ Bullish Case: A strong close above ₹725 with volume can trigger a rally towards ₹770–₹800.
⚠️ Bearish Case: Rejection at resistance and breakdown below ₹665 may drag the stock back to ₹620.
________________________________________
📝 STWP Trade Analysis
Entry: ₹718.35
Stop-loss: ₹665.75 (just below triangle support)
Risk: 52.60 points
Strength: ⚡ Strong Bullish Momentum + Extremely High Volume
Demand Zone: ₹666.65 – ₹683 | SL: 665.75
📌 Note: Strong momentum setup with excellent volume confirmation. Traders must stay disciplined with SL.
________________________________________
🎯 Final Outlook
Tata Motors is at a decisive breakout point. If the stock sustains above ₹725 with strong volumes, it could fuel a sharp rally towards ₹800. Failure to hold this zone may lead to renewed consolidation or a pullback towards ₹665. Patience and strict discipline are essential here.
________________________________________
💡 Learning Note: Symmetrical triangles with heavy-volume breakouts often lead to trend continuation setups. Combining price action, candlestick strength, and volume surge improves the accuracy of trade setups.
________________________________________
⚠️ Disclosure & Disclaimer – Please Read Carefully
The information shared here is meant purely for learning and awareness. It is not a buy or sell recommendation and should not be taken as investment advice. I am not a SEBI-registered investment adviser, and all views expressed are based on personal study, chart patterns, and publicly available market data.
Trading—whether in stocks or options—carries risk. Markets can move unexpectedly, and losses can sometimes exceed the money you have invested. Past performance or past setups do not guarantee future results.
If you are a beginner, treat this as a guide to understand how the market works and practice on paper trades before risking real money. If you are experienced, always assess your own risk, position sizing, and strategy suitability before entering trades.
Consult a SEBI-registered financial adviser before making any real trading decision. By engaging with this content, you acknowledge full responsibility for your trades and investments.
💬 Found this useful?
🔼 Give this post a Boost to help more traders discover clean, structured learning.
✍️ Drop your thoughts, questions, or setups in the comments — let’s grow together!
🔁 Share with fellow traders and beginners to spread awareness.
👉 “If you liked this breakdown, follow for more clean, structured setups with discipline at the core.”
🚀 Stay Calm. Stay Clean. Trade With Patience.
Trade Smart | Learn Zones | Be Self-Reliant 📊
________________________________________
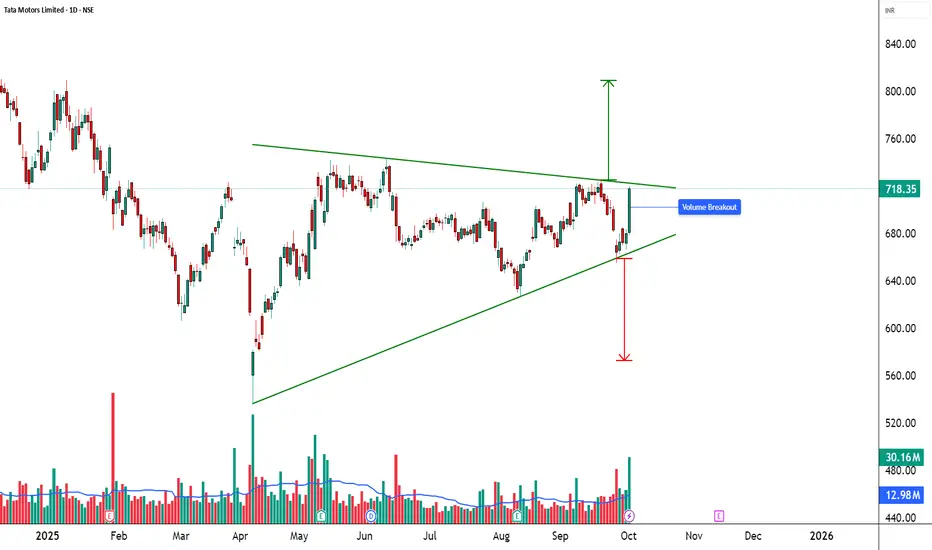
TIINDIA Technical Analysis|Ascending Triangle Breakout Explained📊 TIINDIA Trade Analysis
🔎 Price Action
TIINDIA closed at ₹3354.1 with a strong +3.8% gain, backed by a volume of 6.98 lakh, which is well above its 20-day average volume of 4.43 lakh (VolX = 1.26x).
This surge confirms strong buyer participation, supporting bullish momentum and indicating sustained strength in the uptrend.
________________________________________
📉 Chart Signals: Ascending Triangle Pattern
Strong bullish breakout candle with heavy volumes.
RSI breakout confirming underlying strength.
Bollinger Band breakout after squeeze → fresh volatility expansion and potential sustained upside.
________________________________________
📍 Key Levels
Resistance: 3405 – 3457 – 3540
Support: 3271 – 3188 – 3136
________________________________________
📈 Investment Outlook
📈 Bullish Case – Why the stock could go up
Strong bullish candle signals momentum revival.
Breakout backed by 698k vs 443k avg volume (VolX 1.26x) → strong participation.
RSI (69.1) + CCI (195) + Stochastic (95) confirm momentum.
Upside potential toward ₹3514 – ₹3653 if momentum sustains.
📉 Bearish Case – Potential downside risks
Failure to hold above ₹3374 could trigger profit booking.
Broader market or sector weakness may drag stock back to supports.
A break below ₹3270 could shift bias to downside and test ₹3188 – ₹3136.
⚡ Momentum Case – Short-term Trading Edge
Volume breakout highlights trader interest.
RSI breakout + Bollinger squeeze signal momentum strength.
Sustaining above ₹3405–₹3457 zone may extend upside to ₹3514–₹3540.
📅 Short-term vs Long-term Perspective
Short-term (1–2 weeks): Momentum-driven moves likely; watch resistances at 3405–3540 and supports at 3271–3188.
Long-term (1–3 months): Stock remains in a structural uptrend; if volumes stay above average and fundamentals support, dips toward ₹3180–₹3130 may act as re-entry zones for study.
________________________________________
📝 STWP Trade Analysis
Outlook: Momentum: Strong, Trend: Bullish
Entry: 3374.4 – 3354.10 | Stop-loss: 3234.92
Target-1: 3513.88 | Target-2: 3653.36
Risk/Reward: 1:3.55 | Risk: Low | Volume: High
Demand Zone: 3260-3190 | SL: 3185.05
Learning Note: TIINDIA is in a strong momentum phase, with supports well-positioned for short-term trend analysis.
________________________________________
⚠️ Disclaimer – Please Read Carefully
The information shared here is meant purely for learning and awareness. It is not a buy or sell recommendation and should not be taken as investment advice. I am not a SEBI-registered investment advisor, and all views expressed are based on personal study, chart patterns, and publicly available market data.
Trading — whether in stocks or options — carries risk. Markets can move unexpectedly, and losses can sometimes exceed the money you have invested. Past performance or past setups do not guarantee future results.
If you are a beginner, treat this as a guide to understand how the market works — practice on paper trades before risking real money. If you are experienced, always assess your own risk, position sizing, and strategy suitability before entering trades.
Consult a SEBI-registered financial advisor before making any real trading decision. By engaging with this content, you acknowledge full responsibility for your trades and investments.
💬 Found this useful?
🔼 Give this post a Boost to help more traders discover clean, structured learning.
✍️ Drop your thoughts, questions, or setups in the comments — let’s grow together!
🔁 Share with fellow traders and beginners to spread awareness.
👉 “If you liked this breakdown, follow for more clean, structured setups with discipline at the core.”
🚀 Stay Calm. Stay Clean. Trade With Patience.
Trade Smart | Learn Zones | Be Self-Reliant 📊
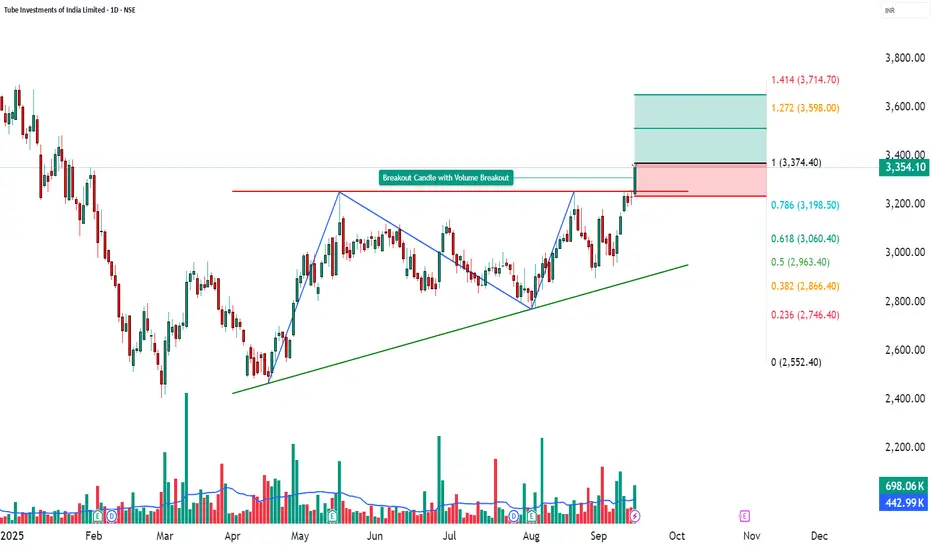
Explosive Volume Breakout StocksHello Traders!
Today’s session we have an explosive breakout on record volumes. The setup is not only backed by price action but also confirmed by multiple technical indicators such as RSI, Bollinger Bands, SuperTrend, VWAP, and BB Squeeze. Let’s decode this in detail 👇
________________________________________________________________________________
________________________________________________________________________________
JBM Auto Ltd (NSE: JBMA)
CMP: 712.95 (+13.92%)
Breakout: Strong 52-week volume breakout with momentum
Key Supports: 660 / 608 / 571
Key Resistances: 749 / 785 / 838
Setup Explanation
JBM Auto delivered a powerful bullish breakout candle backed by 20x volume against its average, confirming strong accumulation. The stock has broken a long-term downtrend with a surge in momentum. This looks like a technically strong breakout setup as per chart patterns, but risks remain. The chart highlights multiple bullish signals: RSI breakout ⚡ shows renewed strength. Bollinger Band breakout 📊 signals volatility expansion. Bullish SuperTrend & VWAP align with upward momentum. BB Squeeze Off 🔥 confirms the end of consolidation and beginning of a trending move. As long as the stock holds above 697–712, momentum is likely to extend towards higher resistances, with 843 as a near-term swing target. A sustained close below 607 would negate the bullish structure.
Latest Update – JBM Auto (JBMA)
JBM Auto is buzzing after its subsidiary JBM Ecolife Mobility secured a $100 million investment from IFC, marking IFC’s largest e-mobility funding in India. The capital will accelerate deployment of over 1,400 electric buses across multiple states, boosting JBMA’s already strong ₹12,900 crore order book. The stock surged ~9–11% on record volumes as the news reinforced confidence in India’s EV and green mobility push.
While momentum is strong, analysts also flag elevated valuations, thin margins, and execution risks, making it important for traders to watch key levels closely.
Investment Outlook & Conclusion
Bullish Case – The stock has given a 52-week breakout with 20x average volumes. If momentum sustains, it may attempt levels of ₹749 → ₹785 → ₹815 → ₹838 → ₹843.
Bearish Case – A sustained slip below ₹622 could weaken the structure and open downside risk.
Momentum Case – Current price action with heavy volumes indicates a short-term momentum phase. However, this is a high-risk, high-reward scenario suitable only for aggressive swing setups.
Perspective – Short-term structure is positive, while long-term outcomes will depend on execution of EV bus orders, government policy support, and maintaining profitability margins.
📊 STWP Trade Analysis – JBM Auto (JBMA)
👉 In my chart study, I have marked ₹732.80 as an entry level with ₹621.95 as an invalidation level.
👉 If the stock dips towards ₹627–607 (Pullback Zone), I will treat it as a conservative re-entry with tighter risk.
Invalidation Level: A sustained move below ₹607 will negate my bullish view.
⚠️ This is my swing trading approach as long as supports hold, shared only for learning how I structure trades. It is not a buy/sell recommendation.
________________________________________________________________________________
________________________________________________________________________________
⚠️ Disclaimer – Please Read Carefully
The information shared here is meant purely for learning and awareness. It is not a buy or sell recommendation and should not be taken as investment advice. I am not a SEBI-registered investment advisor, and all views expressed are based on personal study, chart patterns, and publicly available market data.
Trading — whether in stocks or options — carries risk. Markets can move unexpectedly, and losses can sometimes exceed the money you have invested. Past performance or past setups do not guarantee future results.
If you are a beginner, treat this as a guide to understand how the market works — practice on paper trades before risking real money. If you are experienced, always assess your own risk, position sizing, and strategy suitability before entering trades.
Consult a SEBI-registered financial advisor before making any real trading decision. By engaging with this content, you acknowledge full responsibility for your trades and investments.
💬 Found this useful?
🔼 Give this post a Boost to help more traders discover clean, structured learning.
✍️ Drop your thoughts, questions, or setups in the comments — let’s grow together!
🔁 Share with fellow traders and beginners to spread awareness.
👉 “If you liked this breakdown, follow for more clean, structured setups with discipline at the core.”
🚀 Stay Calm. Stay Clean. Trade With Patience.
Trade Smart | Learn Zones | Be Self-Reliant 📊
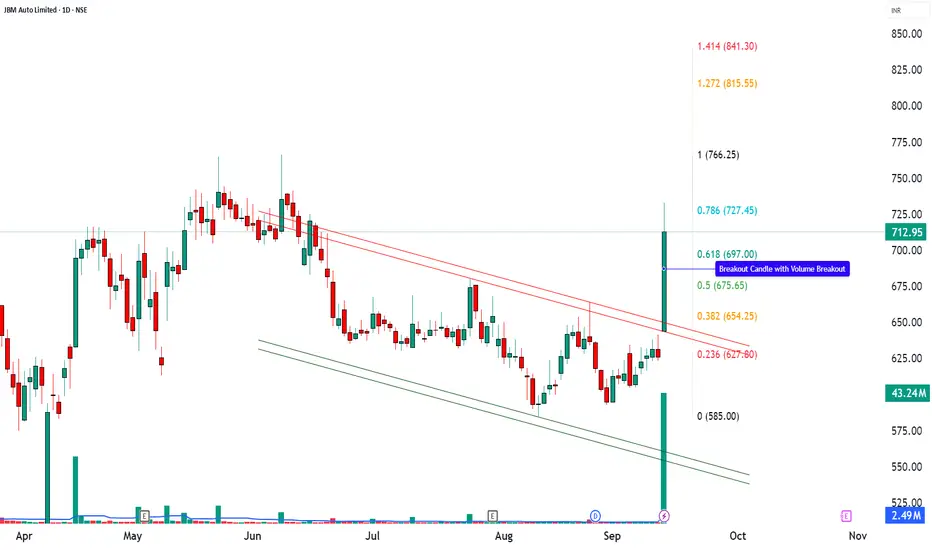
STWP Breakout Watchlist – [14.09] | Key Stocks for Swing TradersSTWP Breakout Watchlist – | Key Stocks for Swing Traders 📊🚀
Markets are buzzing with momentum as multiple stocks show strong breakout signals backed by volumes and clean chart structures 🚀. Today’s watchlist highlights finance heavyweights and defence leaders that are attracting trader attention with fresh swing setups. Let’s decode the key levels, supports, and resistances to track for the coming sessions 🔑.
________________________________________________________________________________
________________________________________________________________________________
BAJFINANCE – 1003.25 (3.41%)
📊 Technical Indicators Explained
Bajaj Finance has given a powerful breakout 🚀 as it clears a long consolidation zone with a strong bullish Marubozu candle backed by heavy volume. The stock posted volumes almost 2 times its 20-day average, reflecting active trading and stronger-than-usual participation. Elevated volumes like this often support the sustainability of the underlying trend.
The chart highlights multiple bullish signals — strong momentum, a 52-week breakout, RSI breakout ⚡ confirming strength, and a Bollinger Band squeeze-off 📊 hinting at fresh volatility expansion. With VWAP support and intraday swing confirmation, the setup looks robust.
As long as key supports at 981 / 959 / 947 are protected, the stock can eye resistances at 1015 / 1026 / 1048 and possibly move towards higher upside levels of 1062 and 1120 in the coming sessions, with a possible demand zone at 975.90 – 965.60.
Bajaj Finance recently touched a 52-week high, driven by strong trading volumes (as per MarketWatch).
The company has set an ambitious goal to grow its loan book to ₹10 lakh crore by FY29, while also working on internal succession planning for senior leadership roles (as per Economic Times).
________________________________________
📈 Investment Outlook & Conclusion
📈 Bullish Case – Momentum with volume support may extend gains towards resistances.
📉 Bearish Case – Breach below 970 can attract selling pressure.
⚡ Momentum Case – Well-aligned for short swing trades.
📅 Perspective – Short-term momentum positive; long-term depends on loan book growth and asset quality.
________________________________________
📊 STWP Trade Analysis – BAJFINANCE
Bajaj Finance has given a strong breakout with momentum and volume confirmation 🚀
👉 For me, my entry zone is around 1004.60, aligned with the breakout structure considering 946.70 as my stop loss.
👉 If the stock dips towards 975.90 – 965.60 (Pullback zone), I will see that as a conservative re-entry with tighter risk.
🔑 Key Levels I’m Watching
Invalidation Level: A sustained move below 945 will negate my bullish view.
My Levels (if momentum continues): 1048 → 1062 → 1120
This is my swing trading approach as long as supports hold and is not a buy/sell recommendation.
________________________________________________________________________________
________________________________________________________________________________
BDL – 1566.50 (▲ +5.73%)
📊 Technical Indicators Explained
Bharat Dynamics (BDL) has delivered a strong breakout candle 🔥 after a prolonged downtrend, backed by extremely high volume 🚀. BDL stood out with an impressive 3.7x surge in volumes over its 20-day average, showcasing aggressive market involvement. Such strong accumulation signals heightened attention from traders and investors, often aligned with significant moves.
The chart highlights multiple bullish signals — RSI breakout, Bullish Engulfing candle, Buy Today Sell Tomorrow (BTST) setup, VWAP support, and SuperTrend reversal confirmation. The BB squeeze-off 📊 indicates a fresh trending move is likely to unfold.
As long as supports at 1506 / 1446 / 1410 are protected, and with a demand zone between 1513 – 1470, the stock looks well positioned to sustain momentum. On the upside, resistances are placed at 1602 / 1637 / 1697, with Fibonacci-based higher levels stretching to 1734 → 1886 → 2041 and beyond.
________________________________________
📰 Recent Updates
Institutional interest in BDL is rising, with the HDFC Defence Fund increasing its stake in the company along with other defence stocks (Economic Times).
BDL has also been highlighted among defence counters that recently surged up to 19%, supported by a strong order book and export prospects (Mint).
________________________________________
📈 Investment Outlook & Conclusion
📈 Bullish Case – Strong breakout with heavy volumes may extend towards higher resistances.
📉 Bearish Case – Slip below 1479 can open downside risk.
⚡ Momentum Case – High-risk, high-reward setup for aggressive short-term swings.
📅 Perspective – Short-term breakout play; long-term outlook tied to defence orders and exports.
________________________________________
📊 STWP Trade Analysis – BDL
Bharat Dynamics has delivered a breakout with volume confirmation and multiple bullish signals 🚀
👉 For me, my entry zone is around 1577, aligned with the breakout structure with my stop being at 1422.60
👉 If the stock dips towards the 1513 – 1470 demand zone, I will treat it as a conservative re-entry with tighter risk.
🔑 Key Levels I’m Watching
Invalidation Level: Invalidation level of below 1422 will negate my bullish view.
My Levels (if momentum continues): 1602 → 1637 → 1697 → 1734 → 1886 → 2041
This is my swing trading approach as long as supports hold and is not a buy/sell recommendation.
________________________________________________________________________________
________________________________________________________________________________
BAJAJFINSV – 2081.50 (▲ +2.14%)
📊 Technical Indicators Explained
Bajaj Finserv (BAJAJFINSV) has given a breakout candle with volume confirmation 🔥 after a long consolidation phase.
The stock displays strong signals — possible breakout setup, bullish engulfing candle, RSI breakout ⚡, swing trade confirmation, and Bollinger Band breakout 📊. The stock is also supported by VWAP demand and a BB squeeze-off, indicating potential for fresh momentum expansion. BAJAJFINSV recorded volumes about 1.8 times its recent 20-day average, suggesting above-normal market activity. This indicates healthy interest and participation, though the intensity is moderate compared to high-volume breakouts.
With strong supports at 2047 / 2013 / 1992, the stock looks well-positioned to sustain its move. On the upside, resistances are placed at 2102 / 2122 / 2156, with higher Fibonacci levels seen at 2135 → 2217 → 2236 if momentum holds.
________________________________________
📰 Recent Updates
Bajaj Finserv has set a target to achieve carbon neutrality for Scope 1 & 2 emissions by 2032, following a decarbonisation study in FY25 (Times of India).
In Q1 FY26, the company reported a 30.4% YoY rise in consolidated net profit to ₹2,789 crore, with revenues growing by ~12–13% (Economic Times).
________________________________________
📈 Investment Outlook & Conclusion
📈 Bullish Case – Gradual momentum with volume support could lift towards resistances.
📉 Bearish Case – A fall below 2032 can trigger near-term weakness.
⚡ Momentum Case – Suitable for cautious swing setups.
📅 Perspective – Short-term bias positive; long-term backed by financial services expansion.
________________________________________
📊 STWP Trade Analysis – BAJAJFINSV
Bajaj Finserv has delivered a breakout candle with momentum and above-average volume 🚀
👉 For me, my entry zone is around 2089, aligned with the breakout structure and a stop loss level of 2024.95.
👉 If the stock dips towards the level of 2041, I will treat it as a conservative re-entry with tighter risk.
🔑 Key Levels I’m Watching
Invalidation Level: A sustained move below 2012 will negate my bullish view.
My Levels (if momentum continues): 2102 → 2122 → 2156 → 2135 → 2217 → 2236
This is my swing trading approach as long as supports hold and is not a buy/sell recommendation.
________________________________________________________________________________
________________________________________________________________________________
HAL – 4745.60 (▼ –3.59%)
📊 Technical Indicators Explained
Hindustan Aeronautics (HAL) has given a breakout candle with strong volume confirmation 🚀 after a corrective downtrend. HAL witnessed trading volumes nearly 2.6x higher than its 20-day average, reflecting strong participation in the stock. Such elevated volumes often highlight rising institutional or retail activity, adding credibility to the ongoing price momentum.
The stock shows powerful bullish signals — Bullish Marubozu candle, RSI breakout ⚡, Bullish Engulfing setup, VWAP support, backed by a SuperTrend reversal and Bollinger Band breakout 📊. The BB squeeze-off suggests a potential trending move is just beginning.
With supports at 4634 / 4523 / 4465, the stock looks cushioned for momentum continuation. On the upside, immediate resistances lie at 4803 / 4861 / 4972, with higher Fibonacci-based levels stretching towards 5074 → 5399 → 5723 if momentum sustains. There is a possible demand zone around 4634 – 4544.30
________________________________________
📰 Recent Updates
HAL has received its third GE-404 engine from the US for the LCA Tejas Mark-1A programme, with a fourth expected later this month (Economic Times).
The company also signed a technology transfer agreement with IN-SPACe, ISRO, and NSIL for the Small Satellite Launch Vehicle (Economic Times).
HAL’s HJT-36 trainer jet is being evaluated for conversion into a light-attack fighter aircraft, with basic weapon trials already completed (Navbharat Times).
________________________________________
📈 Investment Outlook & Conclusion
📈 Bullish Case – Strong momentum with volume support may push towards higher resistances.
📉 Bearish Case – A drop below 4576 can attract downside pressure.
⚡ Momentum Case – Aligned with momentum; good for short-term swings.
📅 Perspective – Short-term breakout play; long-term supported by defence growth.
________________________________________
📊 STWP Trade Analysis – HAL
Hindustan Aeronautics has delivered a breakout candle with strong volume and momentum 🚀
👉 For me, my entry zone is around 4750, aligned with the breakout setup and my stop loss level at 4425.35.
👉 If the stock dips towards the 4634 – 4544.30, I will consider it as a conservative re-entry with tighter risk.
🔑 Key Levels I’m Watching
Invalidation Level: A sustained move below 4425 will negate my bullish view.
My Levels (if momentum continues): 4803 → 4861 → 4972 → 5074 → 5399 → 5723
This is my swing trading approach as long as supports hold and is not a buy/sell recommendation.
________________________________________________________________________________
________________________________________________________________________________
⚠️ Disclaimer – Please Read Carefully
The information shared here is meant purely for learning and awareness. It is not a buy or sell recommendation and should not be taken as investment advice. I am not a SEBI-registered investment advisor, and all views expressed are based on personal study, chart patterns, and publicly available market data.
Trading — whether in stocks or options — carries risk. Markets can move unexpectedly, and losses can sometimes exceed the money you have invested. Past performance or past setups do not guarantee future results.
If you are a beginner, treat this as a guide to understand how the market works — practice on paper trades before risking real money. If you are experienced, always assess your own risk, position sizing, and strategy suitability before entering trades.
Consult a SEBI-registered financial advisor before making any real trading decision. By engaging with this content, you acknowledge full responsibility for your trades and investments.
💬 Found this useful?
🔼 Give this post a Boost to help more traders discover clean, structured learning.
✍️ Drop your thoughts, questions, or setups in the comments — let’s grow together!
🔁 Share with fellow traders and beginners to spread awareness.
👉 “If you liked this breakdown, follow for more clean, structured setups with discipline at the core.”
🚀 Stay Calm. Stay Clean. Trade With Patience.
Trade Smart | Learn Zones | Be Self-Reliant 📊
Explosive Volume Breakout StocksHello Traders! Today’s session was packed with action as several midcap names showed explosive breakouts on record volumes. These setups are not only backed by price action but also confirmed by multiple technical indicators such as RSI, Bollinger Bands, SuperTrend, VWAP, and BB Squeeze. Let’s decode them in detail 👇
1️ Greenpanel Industries Ltd (NSE: GREENPANEL)
CMP: ₹322.15 (+18.09%)
Breakout with Heavy Volumes
Key Supports: ₹288 / ₹254
Resistances: ₹341 / ₹361 / ₹395
🔑 Strong 52-week breakout with bullish follow-through. Sustaining above ₹288 could keep the momentum alive.
The stock witnessed a 52-week volume breakout, supported by a strong bullish candle that confirms aggressive buying interest. The RSI has broken out, highlighting fresh momentum, while the Bollinger Band breakout shows volatility expansion after a period of consolidation. Alongside this, the Bullish SuperTrend and VWAP indicators confirm trend alignment with volume, suggesting institutional participation. Interestingly, the BB Squeeze turning off signals that the low-volatility phase has ended, and the stock may now enter a trending move.
________________________________________
2️ Indoco Remedies Ltd (NSE: INDOCO)
CMP: ₹308.60 (+11.47%)
RSI Breakout + Volume Expansion
Key Supports: ₹280 / ₹252
Resistances: ₹334 / ₹360 / ₹388
🔑 Open = Low + strong bullish candle. Short-term traders may keep an eye on ₹280 as support.
Indoco Remedies also recorded a powerful 52-week volume breakout, signaling accumulation at higher levels. The RSI breakout validates the momentum shift, while the “open = low” pattern reflects intraday buying from the very start of the session. The Bollinger Band breakout points to volatility expansion, and the Bullish SuperTrend along with VWAP confirms that both trend and volume are favoring the bulls. Additionally, the BB Squeeze compression breakout shows that the stock has just moved out of a tight consolidation, opening the doors for a strong upside continuation.
________________________________________
3️ Piccadilly Agro Industries Ltd (NSE: PICCADIL)
CMP: ₹723.80 (-13.58%)
Strong Bullish Candle on Massive Volumes
Key Supports: ₹660 / ₹598
Resistances: ₹765 / ₹806 / ₹869
🔑 Despite closing off highs, volumes indicate institutional interest. Watch ₹660 as a key level.
Piccadilly Agro displayed a strong bullish candle backed by exceptional volumes, which suggests fresh interest from market participants. The RSI breakout supports the strength of the momentum, while the Bollinger Band breakout indicates that the stock has entered a new volatility phase. Both Bullish SuperTrend and VWAP confirm that the price move is well-supported by trend-following and volume-based systems. With the BB Squeeze off, the compression phase has ended, further confirming the possibility of an extended rally if key supports hold.
________________________________________
4️ SMS Pharmaceuticals Ltd (NSE: SMSPHARMA)
CMP: ₹300.55 (+12.14%)
52-Week Volume Breakout
Key Supports: ₹273 / ₹247
Resistances: ₹319 / ₹339 / ₹365
🔑 Stock showing bullish momentum with multiple indicator confirmations. A close above ₹319 may trigger the next leg.
SMS Pharma registered a 52-week volume breakout combined with short-term bullish momentum, indicating a strong change in trend. The RSI breakout highlights renewed momentum, and the Bollinger Band expansion reflects volatility returning after consolidation. The Bullish SuperTrend and VWAP are both in sync with the buyers, suggesting sustainable strength. The BB Squeeze turning off is another confirmation that the quiet phase is over, and the stock could witness directional movement. Overall, multiple indicators align to suggest that this breakout has solid backing from both price and volume action.
________________________________________
💡 Technical Takeaway:
When volume expansion aligns with RSI, Bollinger Bands, and SuperTrend confirmations, breakouts have higher chances of sustaining. Always track key support levels for validation.
⚠️ Disclaimer – Please Read Carefully
The information shared here is meant purely for learning and awareness. It is not a buy or sell recommendation and should not be taken as investment advice. I am not a SEBI-registered investment advisor, and all views expressed are based on personal study, chart patterns, and publicly available market data.
Trading — whether in stocks or options — carries risk. Markets can move unexpectedly, and losses can sometimes exceed the money you have invested. Past performance or past setups do not guarantee future results.
If you are a beginner, treat this as a guide to understand how the market works — practice on paper trades before risking real money. If you are experienced, always assess your own risk, position sizing, and strategy suitability before entering trades.
Consult a SEBI-registered financial advisor before making any real trading decision. By engaging with this content, you acknowledge full responsibility for your trades and investments.
💬 Found this useful?
🔼 Give this post a Boost to help more traders discover clean, structured learning.
✍️ Drop your thoughts, questions, or setups in the comments — let’s grow together!
🔁 Share with fellow traders and beginners to spread awareness.
👉 “If you liked this breakdown, follow for more clean, structured setups with discipline at the core.”
🚀 Stay Calm. Stay Clean. Trade With Patience.
Trade Smart | Learn Zones | Be Self-Reliant 📊