Options Strategy Breakdown – For Educational Purpose Only________________________________________
📈 Options Strategy Breakdown – For Educational Purpose Only
🧠 Learn to Structure a Bull Call Spread Strategically
________________________________________
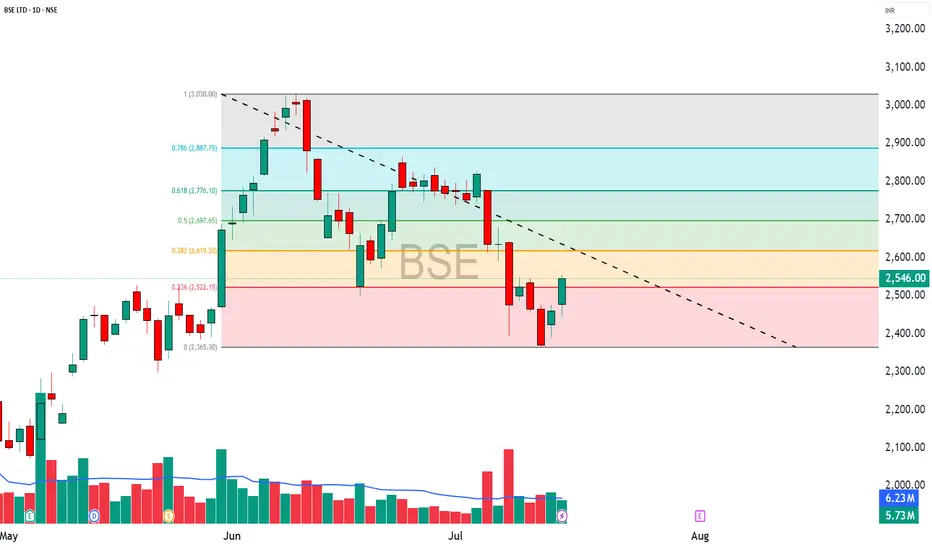
🔹 Stock Name: BSE
🔹 Spot Price: ₹2546
🔹 Lot Size: 375
🔹 Number of Lots: 1
🔹 Expiry Date: 31-July-2025
🕒 DTE (Days to Expiry): 16 Days
💡 Strategy Type: Bull Call Spread – Limited Risk | Limited Reward Option Structure
________________________________________
📘 Strategy Construction (Illustrative Example):
1️⃣ Buy Call Option – Strike: ₹2500 | Premium Paid: ₹125
2️⃣ Sell Call Option – Strike: ₹2600 | Premium Received: ₹76
🧮 Net Premium Outflow: ₹49
(₹125 - ₹76 = ₹49 * 375 = ₹18,375)
________________________________________
📊 Payoff Metrics (Illustrative & Hypothetical):
• 🔹 Breakeven Point: ₹2549.00
• 📈 Maximum Profit: ₹19,125 (When Spot ≥ ₹2600)
• ⚠️ Maximum Loss (Capital Deployed): ₹18,375 (if Spot ≤ ₹2500)
• 🔄 Real-Time PnL: Subject to market movement
• 🎯 Suggested Profit Booking Threshold: ₹18,375 (illustrative target)
• 🛑 Reversal Exit Point (Invalidation): Spot < ₹2487.75 (Support Violation)
________________________________________
📌 Why Learn This Strategy?
The Bull Call Spread is a risk-defined options strategy designed for moderately bullish views. It reduces premium cost compared to naked options and has a clearly capped loss and reward, making it suitable for learning proper risk management in derivatives trading.
________________________________________
🔍 Key Educational Takeaways:
• Helps manage premium exposure in trending markets
• Builds awareness of breakeven levels and invalidation points
• Encourages use of defined-risk structures over naked positions
• Promotes discipline and technical level-based exits
________________________________________
⚠️ Educational Disclaimer:
📢 This post is intended purely for educational and informational purposes only and does not constitute investment advice, recommendation, or solicitation to trade.
I am not a SEBI-registered investment advisor. All data shared above is illustrative and should not be considered as buy/sell advice.
Trading in derivatives involves risk. Please consult a SEBI-registered advisor before taking any financial decisions.
📘 Past performance or setup structure does not guarantee future results.
Always do your own research and use strict risk management.
________________________________________
💬 Want more educational breakdowns like this?
Drop a comment or message!
🔁 Share this with fellow learners to help them build structured option strategies.
✅ Follow @simpletradewithpatience for charts, clean setups, and educational content based on price action, zones, and risk-managed trades.
________________________________________
Learntotrade
HEROMOTOCO – Option Chain + Price Action Intraday Setup________________________________________
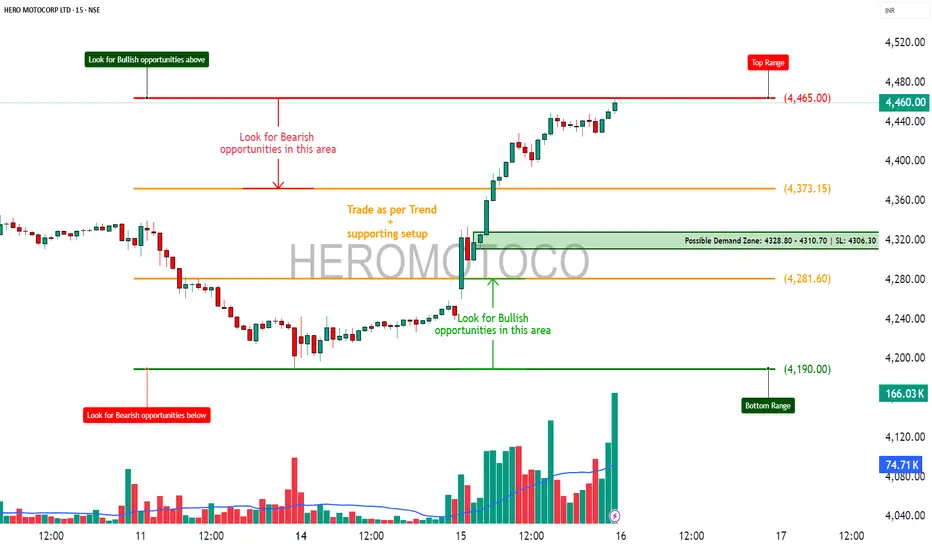
📊 HEROMOTOCO – Option Chain + Price Action Intraday Setup
🕒 Chart Type: 15-Min Timeframe
📅 Date: July 15, 2025
🎯 For Educational Purpose Only
________________________________________
🔍 Chart Observations:
• Clean rally supported by increasing volume.
• Price nearing the Top Range / Resistance at ₹4465.
• A visible Demand Zone formed between ₹4328.80–₹4310.70 with a strong bounce.
• Volume spike confirms strong buying interest near demand levels.
________________________________________
🔢 Option Chain Insights:
🔼 Call Side Activity:
• 4500 CE: Massive Long Build Up — OI +111.76%, premium ₹52.3 → Suggests strength.
• 4450 CE: Also saw strong Long Build Up with rising premium.
• 4400 CE: Witnessed aggressive Short Covering, adding fuel to bullish momentum.
📈 Interpretation: Option writers are unwinding shorts on 4400, and 4500 is seeing heavy buildup — bullish sentiment.
🔽 Put Side Activity:
• 4400 PE: Sharp Short Build Up, IV at 34.5 → Puts being sold aggressively = Bullish bias.
• 4300 PE: Also saw strong Short Build Up, with OI rising despite falling premiums.
📉 Interpretation: Put writers are confident on downside support holding.
________________________________________
✅ Trade Plan Breakdown:
🔼 1. Best Buy – "Buy on Dip to Demand"
• Entry: ₹4328 – ₹4310 (Demand Zone)
• SL: ₹4306
• Risk Reward: 1:1 | 1:2 +
• Logic: Re-entry near demand zone + strong put writing + bullish volume = trend continuation
________________________________________
🔽 2. Best Sell – "Fade the Supply"
• Entry: ₹4460 – ₹4465 (Supply Zone)
• SL: ₹4475
• Risk Reward: 1:1 | 1:2 +
• Logic: Price near resistance with possible exhaustion. CE premiums elevated → good short-risk area
________________________________________
🟢 3. Best CE – "Momentum Play Above ₹4465"
• Strike: 4500 CE
• Trigger: If price breaks above ₹4465 with volume
• Logic: LTP ₹52.3 with Long Build Up, high delta (0.47) → Ready for breakout rally
________________________________________
🔴 4. Best PE – "Rejection Trade Below ₹4430"
• Strike: 4400 PE
• Trigger: If spot breaks below ₹4430
• Logic: LTP ₹95.75, Short Build Up suggests hedge-unwinding or trap possibility on failure
________________________________________
📦 5. Applicable Demand and Supply Zones
• Demand Zone: ₹4328.80 – ₹4310.70 (SL: ₹4306.30)
• Supply Zone: ₹4460 – ₹4465
• Mid-level Zones:
o Watch for support at ₹4373.15
o Breakdown area at ₹4281.60
• Bottom Range Support: ₹4190.00
________________________________________
💬 STWP Summary View:
The sentiment is strongly bullish, backed by long buildup in calls and short buildup in puts. If price breaks above ₹4465, momentum CE trades can fly. But supply pressure could give quick fade setups for scalpers too.
________________________________________
⚠️ Disclaimer (Read Before Trading):
• This setup is shared for educational purposes only.
• No investment advice or trade recommendation is being made.
• Always use proper risk management.
• STWP is not a SEBI-registered advisor.
• Markets involve risk. Trade with a plan, not with emotions.
________________________________________
💬 Found this helpful?
Drop your thoughts or questions below ⬇️
🔁 Share with your trading circle to help them navigate zone-based trades.
✅ Follow @simpletradewithpatience for smart charts, clean setups & demand-supply backed analysis.
📊 Let the price guide you — trade with patience, charts, and clarity!
________________________________________
HERO MOTOCORP LTD – TECHNICAL ANALYSIS________________________________________
📈 HERO MOTOCORP LTD – TECHNICAL ANALYSIS
📆 Date: July 15, 2025 | ⏱ Timeframe: Daily Chart
🔍 Educational Breakdown – For Learning & Study Use Only
________________________________________
🔹 Price Action Zones
• 🔴 Top Range (Supply Zone / Resistance): ₹4,486.70
• 🟢 Bottom Range (Demand Zone / Support): ₹4,158.10
Price has recently broken out from a symmetrical triangle pattern, heading toward the marked supply zone. The demand zone at ₹4,158 has been tested multiple times and held firm, acting as the base for this breakout.
________________________________________
🔹 Chart Pattern: ✅
The stock formed a tight triangle consolidation, compressing between a rising support and horizontal resistance. Today’s breakout candle, backed by volume, confirms a bullish resolution of the pattern.
________________________________________
🔹 Reversal Candlestick Patterns
A large bullish engulfing candle has cleared recent highs with strength. Closing near the high, it signals conviction and opens the path for a continued up-move.
________________________________________
🔹 Technical Indicators
• RSI: Crossed above 60 — strength building
• MACD: Positive crossover confirming trend reversal
• VWAP: Price comfortably trading above — supports trend
• Bollinger Bands: Post-squeeze breakout with wide expansion
• Volume: Breakout supported by 20-day volume high — adds strong confirmation
________________________________________
📌 What’s Catching Our Eye:
The volume spike is significant — over 1.76M with breakout from both triangle resistance and VWAP. Add to that a BB Squeeze release, and the setup gets stronger technically.
________________________________________
👀 What We’re Watching For:
If price sustains above ₹4,454, it may move into the next resistance cluster: ₹4,525.97 → ₹4,599.93 → ₹4,730.87. On dips, ₹4,188 and ₹4,158 become important demand zones to monitor for re-entries.
________________________________________
⚠️ Risks to Watch:
A failed follow-up tomorrow or close below ₹4,405 could invalidate the momentum. Also, overbought conditions without volume expansion may lead to a false breakout near ₹4,486.
________________________________________
🔮 What to Expect Next:
If bullish momentum sustains, the stock may first target ₹4,599 and then ₹4,695. Resistance is expected near ₹4,525–₹4,599 range. A clean breakout above ₹4,486 could invite strong follow-up buying.
________________________________________
📊 Trade Plan (Based on Reason and Charts)
🔼 Bullish Trade Setup:
Entry Zone: ₹4,454 – ₹4,465
Stop-loss: ₹4,405.63
Risk–Reward: ~1:1 to 1:2
Reason: Triangle breakout + BB Squeeze + RSI/MACD confirmation + VWAP support
🔽 Bearish Trade Setup:
Only if the price rejects ₹4,486.7 and breaks below ₹4,405:
Entry: Below ₹4,405
SL: ₹4,465
Risk–Reward: ~1:1 to 1:2
Reason: Failed breakout + supply pressure at top range
________________________________________
⚠️ Disclaimer (Please Read):
• This chart is shared for educational purposes only and is not investment advice.
• I am not a SEBI-registered advisor.
• The information provided here is based on personal market observation.
• No buy/sell recommendations are being made.
• Please do your own research or consult a registered financial advisor before making any trading decisions.
• Trading involves risk. Always use proper risk management.
STWP is not responsible for trading decisions based on this post.
________________________________________
💬 Found this helpful?
Drop your thoughts or questions in the comments below ⬇️
🔁 Share this post with your trading community – let them benefit from clean charts, structured setups, and zone-based learning.
✅ Follow @simpletradewithpatience for chart-backed technical analysis that respects price action, demand & supply.
🚀 Trade with patience, trust your charts, and stay clear-headed!
Be Self-Reliant | Trade with Patience | Learn with Charts & Zones 📊
________________________________________

Maruti - Strong Option Chain Signals for Potential Trade Setups________________________________________________________________________________
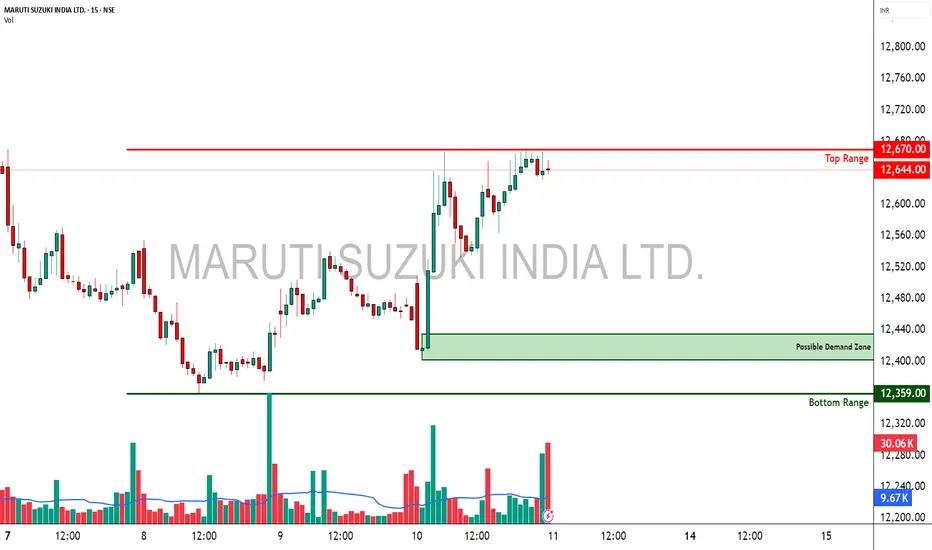
MARUTI
Bias: Bullish Bias
Strong Long Build-Up across Call strikes (12700–13500)
Simultaneous Short Build-Up on Puts — classic bullish confirmation
________________________________________________________________________________
Best CE:
Strike: 12800
LTP: ₹138.3
OI: 5,14,100 (+78,350 | +17.98%)
Volume: 17,570
Build-Up: Long Build-Up
Interpretation: High OI addition + price rise = active bullish bets at 12800
________________________________________________________________________________
Best PE:
Strike: 12600
LTP: ₹159
OI: 1,05,700 (+76,600 | +263.23%)
Volume: 10,114
Build-Up: Short Build-Up
Interpretation: Strong put writing at 12600 suggests immediate support here
________________________________________________________________________________
Best Strategy:
Bull Call Spread or Naked Call Buy
(Buy 12800 CE, Sell 13200 or 13500 CE for risk-defined play)
- Directional bullish play
- Room to run till 13200–13500 zone based on fresh CE buildup
- Ideal if Spot sustains above 12600
________________________________________________________________________________
Why:
- Long Build-Up seen from 12700 CE to 13500 CE
- Spot = ₹12650, and 12600 PE has heavy Put writing → firm base
- Call Short Covering seen at 12500, 12600 → unwinding resistance
- IVs are rising on PEs, falling on CEs → supports bullish sentiment
- 12800 CE has highest Long Build-Up + Volume → key upside breakout strike
- Above 12800, next resistance zones visible around 13200–13500 based on CE action
________________________________________________________________________________
⚠️ Disclaimer (Please Read):
• This chart is shared for educational purposes only and is not investment advice.
• I am not a SEBI-registered advisor.
• The information provided here is based on personal market observation.
• No buy/sell recommendations are being made.
• Please do your own research or consult a registered financial advisor before making any trading decisions.
• Trading involves risk. Always use proper risk management.
________________________________________________________________________________
💬 Found this helpful?
Drop your thoughts or questions in the comments below ⬇️
🔁 Share this post with your trading community.
✅ Follow simpletradewithpatience for price-action backed technical setups.
🚀 Let’s trade with patience, logic, and clarity!
Be Self-Reliant | Trade with Patience | Learn with Logic
CAMS – Rising Wedge in Focus ________________________________________________________________________________
📈 CAMS – Rising Wedge in Focus
🕒 Chart Type: Daily
________________________________________________________________________________
What’s Catching Our Eye:
CAMS is forming a Rising Wedge, a technical structure that often leads to strong directional moves. The price is nearing the upper boundary of the wedge, indicating possible breakout or reversal. This contraction in range is typically followed by expansion — and smart traders are watching closely.
________________________________________________________________________________
What We’re Watching For:
Price holding above ₹4201.40 could trigger interest from early participants. On the flip side, a breakdown below ₹4090.50 may signal failure of the wedge structure. For more confirmation-driven entries, one may wait for a proper breakout or breakdown candle with volume.
________________________________________________________________________________
Volume Footprint Analysis:
As expected in wedge formations, volume has compressed. A breakout supported by volume expansion could validate the move and offer confidence in continuation. Volume is the key trigger to watch once the wedge resolves.
________________________________________________________________________________ Option Structure Insight:
For educational purposes, one could observe a neutral hedge approach using options:
– Buy 4200 CE
– Buy 4100 PE
This can potentially help capture a sharp move in either direction. Once the move confirms, the opposite leg can be exited to ride the trend with managed risk.
Price Action Logic:
Rising wedge formations typically form after a directional up-move and narrow into a tightening range. This is often followed by an impulsive expansion phase. CAMS is showing that exact setup. The price is sandwiched between key resistance at ₹4200+ and demand near ₹3880.
________________________________________________________________________________
💼 Sector Tailwinds:
CAMS, operating within the mutual fund RTA space, benefits from India's rising retail participation and SIP growth. The digitalisation of mutual fund flows, compliance demand, and data-based services lend long-term support to this sector. These factors offer fundamental strength to this technical setup.
________________________________________________________________________________
⚠️ Risks to Watch:
– A close below ₹4085 could invalidate the bullish wedge setup
– Current price behavior reflects compression, but indicators like Stochastic may suggest near-term overbought conditions
– Avoid chasing — wait for confirmation via breakout + volume or a proper retest candle
– Do not over-leverage in a low-volume wedge structure — focus on proper R:R and sizing
________________________________________________________________________________
🔮 What to Expect Next:
If the wedge breaks upward and sustains above ₹4201.40 with volume, price expansion may be observed toward ₹4330–₹4450 zone. On the downside, a breakdown below ₹4090.50 may trigger a move toward the ₹3950–₹3880 support cluster. Watch for confirmation in the next 2–3 sessions before taking directional exposure.
________________________________________________________________________________
🧠 How to Trade CAMS (For Educational Use Only):
🔹 Breakout Trade Plan
• Entry: Above ₹4201.40
• Stop Loss: Below ₹4090.50 (closing basis preferred)
• Pullback Entry: If price returns to ₹4095–₹4105 zone and shows bounce confirmation
• Risk-Reward: Start with 1:1, trail for 1:2+
• Position Sizing: Based on risk, never overexpose in a wedge
🔹 Options Strategy (Educational View)
• Buy CAMS 4200 CE
• Buy CAMS 4100 PE
• Exit the losing leg once direction confirms with price + volume breakout
________________________________________________________________________________
📍 Levels to Keep an Eye On:
The first key level to observe is ₹4201.40 — a break above this may attract early interest from aggressive participants as it represents the upper boundary of the rising wedge. On the downside, ₹4090.50 acts as the breakdown level; if breached, it could suggest structural weakness and a potential shift in trend.
In case of an upward breakout, we are closely monitoring the ₹4330–₹4450 zone as a possible price expansion area. If the breakdown plays out instead, the ₹3950–₹3880 zone becomes important as a potential reaction area or demand test.
Historically, the ₹3880–₹3950 range has shown signs of buyer interest and may act as a demand zone if retested. On the upside, ₹4320–₹4400 has acted as supply in the past and could present resistance if the price extends higher.
A close below ₹4085 would invalidate the bullish wedge structure and may require a reassessment of directional bias.
________________________________________________________________________________
⚠️ Disclaimer (Please Read):
• This chart is shared for educational purposes only and is not investment advice.
• I am not a SEBI-registered advisor.
• The information provided here is based on personal market observation.
• No buy/sell recommendations are being made.
• Please do your own research or consult a registered financial advisor before making any trading decisions.
• Trading involves risk. Always use proper risk management.
________________________________________________________________________________
💬 Found this helpful?
How would you prefer to approach this — breakout entry or pullback into zone?
Drop your thoughts or questions in the comments below ⬇️
🔁 Share this post with your trading community.
✅ Follow @SimpleTradeWithPatience for price-action backed technical setups.
🚀 Let’s trade with patience, logic, and clarity!
Be Self-Reliant | Trade with Patience | Learn with Logic
________________________________________________________________________________

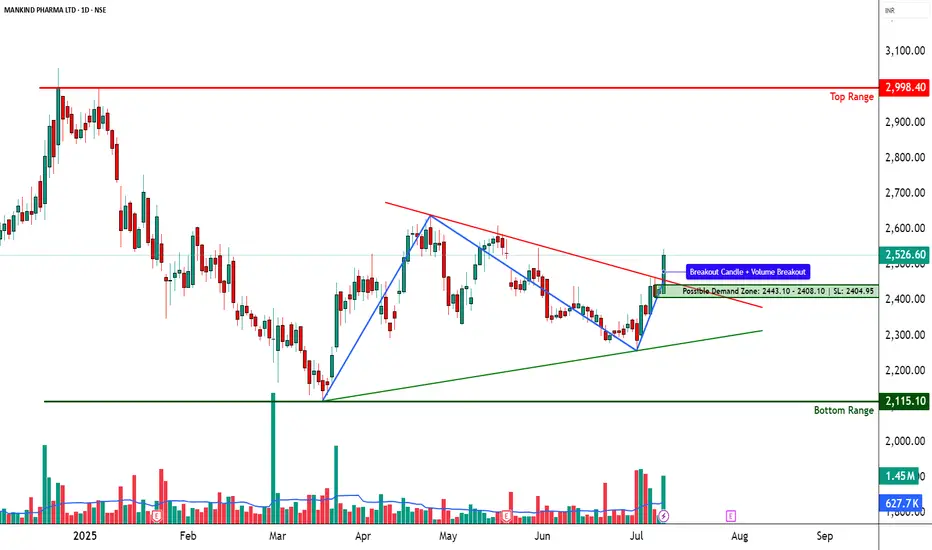
MANKIND PHARMA – Descending Triangle Breakout________________________________________________________________________________📈 MANKIND PHARMA – Falling Trendline Breakout | Strong Reversal Candle | Volume Spike
🕒 Chart Type: Daily Chart
📆 Date: July 9, 2025
________________________________________________________________________________
📌 Price Action:
MANKIND PHARMA has executed a decisive breakout above a falling trendline on the daily chart, breaking out of a multi-week descending structure. The price action had been consolidating within a triangular pattern, and on July 9, it registered a powerful wide-range bullish candle, closing at 2526.60 — well above the recent consolidation highs. This move came from a structured base with two strong pivot lows and now places the stock back into a strong bullish trajectory. The breakout is not random; it’s backed by structure, momentum, and confirmation — suggesting potential for a trend continuation if sustained.
________________________________________________________________________________
📊 Chart Pattern:
The chart shows a descending triangle breakout with compression near the apex. This setup builds pressure and usually resolves in the direction of volume. The move out of this pattern has occurred with authority, marked by a clean range expansion and bullish follow-through above resistance. This is a momentum-confirming breakout, which opens up room toward testing higher resistance zones.
________________________________________________________________________________
🕯️ Candlestick Pattern:
Strong Bullish Candle
Open = Low (Intraday strength)
Buy Today, Sell Tomorrow-type price action
Aligned with Volume Spike and Trendline Breakout
________________________________________________________________________________
🔊 Volume Analysis:
The breakout is accompanied by more than 2x the 20-day average volume, signaling real participation — not just speculative noise. Delivery volumes are notably strong, and volume came after a phase of tight consolidation, which indicates a possible transition from quiet accumulation to active participation by stronger hands.
________________________________________________________________________________
📈 Technical Indicators:
RSI (Daily): 66 – strong, trending up
MACD: Bullish crossover, both on Daily and Weekly
CCI: 220 – highly bullish momentum territory
Stochastic: 94 – overbought but confirming momentum
SuperTrend & VWAP: Clearly bullish
Bollinger Band: Price is expanding beyond upper band — volatility expansion in motion
________________________________________________________________________________
🧱 Support & Resistance:
🔻 Supports:
2448.27 – Immediate support (previous breakout zone)
2369.93 – Structure base support
2322.27 – Last defense before breakout invalidation
Bottom Range / Demand Zone: 2115.1 – Long-term accumulation zone
🔺 Resistance Zones:
2574.27 – First supply zone; watch for price reaction
2621.93 – Medium-term resistance; previously rejected here
2700.27 – Higher timeframe swing resistance
Top Range: 2998.4 – Long-term resistance; breakout confirmation if crossed
________________________________________________________________________________
👀 What’s Catching Our Eye:
What stands out is the confluence breakout — trendline, structure, volume, and indicators are all pointing in the same direction. The BB squeeze, RSI breakout, and strong candle together make this a multi-signal setup — rarely do we get such alignment across tools.
________________________________________________________________________________
🔍 What We’re Watching For:
Will the price hold above 2448–2526 for the next couple of sessions? If yes, this breakout can see momentum continuation toward 2574+. Any low-volume pullback toward the trendline or support zone could be a low-risk re-entry. If it fails to hold above the breakout candle, momentum could fade.
________________________________________________________________________________
✅ Best Buy Level for Equity (Low Risk Idea):
Entry: Above 2543.60 (post-breakout confirmation or clean retest of 2448–2455 zone)
Stop Loss: 2404.95 (on a closing basis)
Risk Reward Strategy: 1:1 initially, trail for 1:2+ if volume expands
Avoid chasing: Let the price validate with sustained volume above breakout
________________________________________________________________________________
💼 Sector Tailwinds:
The pharmaceutical sector is seeing renewed investor interest post-COVID, with growing focus on specialty products, chronic therapy lines, and export-led growth. MANKIND is among the strongest consumer-pharma brands with consistent results and brand recall — adding fundamental strength to this technical breakout.
________________________________________________________________________________
⚠️ Risk to Watch:
A close below 2448 could invalidate this setup
The overbought Stochastic means minor pullbacks or shakeouts are possible
Don’t chase — always confirm the breakout with a retest or follow-through candle
Over-positioning during volatility can lead to poor R:R trades
________________________________________________________________________________
🔮 What to Expect Next:
If this breakout holds, we may see follow-through toward 2574.27 in the short term. Strong volume above 2540+ can unlock upside toward 2621+. However, if the price closes below 2448, we may be dealing with a failed breakout — a scenario to strictly avoid. Watch next 2–3 sessions for clarity.
________________________________________________________________________________
🧠 How to Trade MANKIND PHARMA (For Educational Use Only):
🔹 Breakout Trade Plan
Entry: Above 2543.60
Stop Loss: 2404.95 (Closing basis)
Pullback Entry: Into 2448 zone with bounce candle
Risk-Reward: Start with 1:1, then trail to 1:2+
Position Sizing: Risk-calibrated, never go all-in
________________________________________________________________________________
⚠️ Disclaimer (Please Read):
• This chart is shared for educational purposes only and is not investment advice.
• I am not a SEBI-registered advisor.
• The information provided here is based on personal market observation.
• No buy/sell recommendations are being made.
• Please do your own research or consult a registered financial advisor before making any trading decisions.
• Trading involves risk. Always use proper risk management.
________________________________________________________________________________
💬 Found this helpful?
What’s your ideal approach to this setup — breakout entry or pullback into zone?
Drop your thoughts or questions in the comments below ⬇️
🔁 Share this post with your trading community
✅ Follow STWP for clean technical setups backed by price action and volume
🚀 Let’s trade with patience, logic, and clarity!
Be Self-Reliant | Trade with Patience | Learn with Logic
________________________________________________________________________________
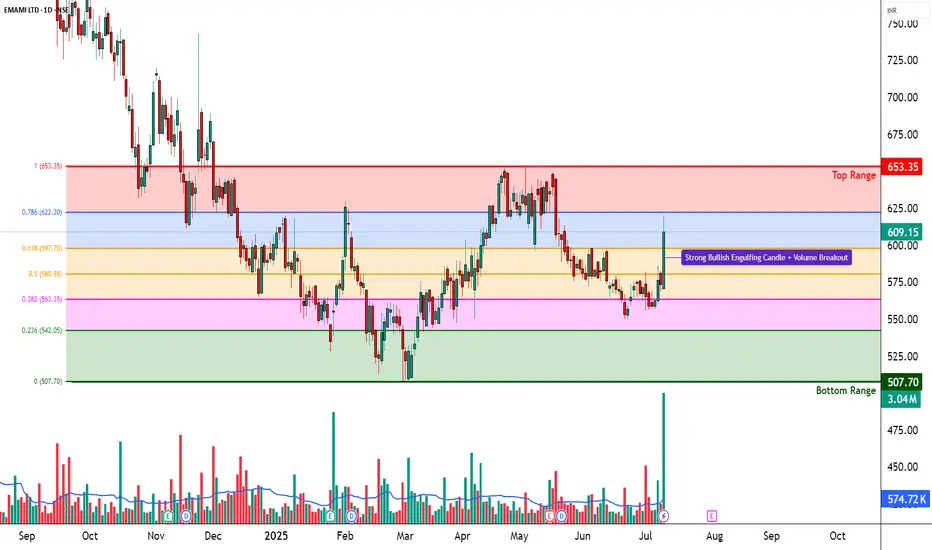
EMAMI LTD – Strong Bullish Breakout | Volume Spike________________________________________________________________________________
📈 EMAMI LTD – Strong Bullish Breakout | Volume Spike | Structure-Based Trade Idea
🕒 Chart Type: Daily Chart
📆 Date: July 9, 2025
________________________________________________________________________________
📌 Price Action:
EMAMI LTD has delivered a decisive breakout from its recent compression phase after trading sideways between 570–585 for several sessions. On July 9, the stock posted a wide-range bullish candle, closing at 609.15, backed by high delivery and breakout volume. The candle formed with an open = low structure, a strong intraday move, and solid closing near the high, confirming buyer dominance. This marks a shift in control from range-bound consolidation to potential momentum continuation.
________________________________________________________________________________
📊 Chart Pattern:
This breakout is from a Box Compression Zone, where the stock had been moving within a tight band. This is a textbook bullish compression breakout, often seen before short-term trend expansions. The range contraction, followed by a sudden expansion with volume, signals that smart money may be entering. Though not a VCP, the narrowing of ranges followed by a strong candle reflects controlled buildup and release of bullish pressure.
________________________________________________________________________________
🕯️ Candlestick Pattern:
Bullish Engulfing
Open = Low Candle
Momentum Continuation Candle
The current candle also fits the "Buy Today, Sell Tomorrow" setup logic, especially useful for short-term intraday/momentum traders from an educational lens.
________________________________________________________________________________
🔊 Volume Analysis:
Volume on July 9 crossed 3x the 20-day average, showing an institutional-grade breakout. What's more important is that this move comes after multiple low-volume sessions, which indicates that the base was silent before this burst — classic sign of accumulation followed by breakout. The presence of a BB squeeze and volume compression breakout confirms the start of a volatility expansion phase.
________________________________________________________________________________
📈 Technical Indicators:
RSI (Daily): 65 – strong and rising
MACD: Bullish crossover on Daily, but flat on Weekly/Monthly
CCI: 319 – strong bullish momentum reading
Stochastic: 85 – in a bullish zone, showing follow-through possibility
SuperTrend & VWAP: Bullish bias confirmed
BB Squeeze: Compression off, likely start of expansion
These indicators align well to show a breakout backed by momentum and volume expansion.
________________________________________________________________________________
🧱 Support & Resistance:
🔺 Resistance Zones to Watch:
629.23 – First key level where supply may come in
649.32 – Major resistance from previous swing
678.63 – Long-term resistance zone
Top Range: 653.35 – Official top of the recent consolidation base
🔻 Support Levels:
579.83 – Immediate support post-breakout
550.52 – Minor swing base
530.43 – Deeper demand level from which recent trend started
Bottom Range (Demand Zone): 507.70 – Long-term structural support
________________________________________________________________________________
👀 What’s Catching Our Eye:
What stands out in this chart is the confluence of breakout signals — RSI breakout, engulfing candle, Bollinger squeeze off, and high delivery volume — all firing together. The open-low bullish bar is not just random price movement; it's a statement from buyers that they're ready to defend this zone.
________________________________________________________________________________
🔍 What We’re Watching For:
We’re watching if EMAMI can sustain above 609–620 for the next couple of sessions. A consolidation above this zone will indicate strength. On the flip side, any rejection and close back below 579.83 will raise flags. We're also watching for any mild retest toward 580–585 on low volume, which can offer a secondary low-risk entry opportunity.
________________________________________________________________________________
✅ Best Buy Level for Equity (Low Risk Idea):
Breakout Entry: Above 620 with follow-through or retest confirmation
Pullback Buy: Into the 579.83–585 support zone with a strong bounce candle
Stop Loss: 560.33 (structure-based, on closing basis)
Risk-Reward Lens: Start with a 1:1 target; trail for 1:2+ based on structure — avoid fixed upside projections
________________________________________________________________________________
💼 Sector Tailwinds:
The FMCG and personal care space is seeing renewed demand due to rising rural consumption, price stability in raw materials, and stronger brand-led companies gaining market share. EMAMI, with a wide product portfolio, is well-positioned to benefit. Fundamentally, the stock is also recovering from long-term price compression — aligning well with the recent breakout.
________________________________________________________________________________
⚠️ Risk to Watch:
A close below 579 will invalidate the breakout setup
Indicators are strong but slightly stretched, so chasing blindly can invite volatility
The price must confirm above 620+ for the trend to gain broader legs
Always wait for follow-through before committing fresh capital
________________________________________________________________________________
🔮 What to Expect Next:
If EMAMI sustains above 609–620, the stock could gradually move toward 629.23 and test higher levels like 649.32. But if it fails to hold above the breakout candle, we may see a pullback to 580–585. Either way, price and volume in the next 2–3 sessions will confirm whether this is a false breakout or the start of a real trend.
________________________________________________________________________________
🧠 How to Trade EMAMI LTD (For Educational Use Only):
Breakout Plan (Hypothetical Setup):
🔹 Entry: Above 620 only if follow-through confirmation candle appears
🔹 Stop Loss: 560.33 (on closing basis)
🔹 Pullback Buy: Into 580–585 with same SL, if bullish reversal shows
🔹 Risk-Reward: 1:1 minimum; trail for more
🔹 Position Sizing: Use capital allocation based on risk tolerance — never go all-in on breakout
________________________________________________________________________________
⚠️ Disclaimer (Please Read):
• This chart is shared for educational purposes only and is not investment advice.
• I am not a SEBI-registered advisor.
• The information provided here is based on personal market observation.
• No buy/sell recommendations are being made.
• Please do your own research or consult a registered financial advisor before making any trading decisions.
• Trading involves risk. Always use proper risk management.
________________________________________________________________________________
💬 Found this helpful?
What would be your ideal trade in EMAMI — breakout follow-through or support pullback?
Drop your thoughts in the comments below ⬇️
🔁 Share this with your trading community
✅ Follow STWP for clean technical setups backed by price action and volume
🚀 Let’s trade with patience, logic, and clarity!
Be Self-Reliant | Trade with Patience | Learn with Logic
________________________________________________________________________________
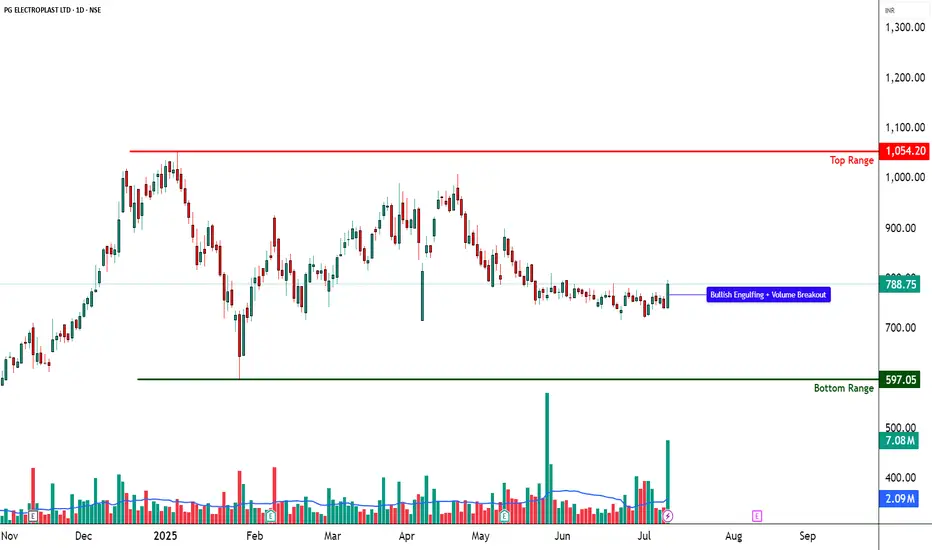
PG ELECTROPLAST – Volume Breakout from Tight Base________________________________________________________________________________
📈 PG ELECTROPLAST – Volume Breakout from Tight Base | Bullish Momentum Brewing
🕒 Chart Type: Daily Chart
📆 Date: July 9, 2025
________________________________________________________________________________
📌 Price Action:
PG ELECTROPLAST LTD has shown an impressive breakout from a tight base, rising from the 735–755 congestion zone with a wide-range bullish candle on July 9. The candle had an open = low structure, closed near the high, and was backed by massive volume. This signals clear buying strength and suggests that bulls are stepping in after a period of low volatility and sideways movement. The stock had been trading in a narrow band and has now broken out with strong conviction, hinting at the beginning of a possible trend reversal or a short-term momentum rally.
________________________________________________________________________________
📊 Chart Pattern:
The chart displays a tight base breakout from a multi-week compression zone. While not a textbook wedge or flag, the narrowing range combined with flat moving averages suggested the stock was coiling up for a move. The breakout candle pierced the upper end of the range, with volume confirming that it wasn't a false push. This kind of price behaviour often leads to trend expansion — especially when confirmed by broader volume activity.
________________________________________________________________________________
🕯️ Candlestick Pattern:
Bullish Engulfing Candle
Open = Low Structure
Strong Bullish Range Candle
This combination, particularly when seen after a base, is a strong signal of fresh buying interest. It also fits the “Buy Today, Sell Tomorrow” short-term momentum logic, especially for educational model trades.
________________________________________________________________________________
🔊 Volume Analysis:
The breakout was supported by a 10-day volume breakout, with volumes spiking over 3x the average. This is not just intraday noise — it reflects strong delivery participation and genuine interest. Volume spike at breakout is a key sign of smart money involvement. Moreover, the spike occurred from a compressed base, which adds further weight to the strength of the breakout.
________________________________________________________________________________
📈 Technical Indicators:
RSI (Daily): 56 — rising from neutral territory, not yet overbought
MACD: Bullish crossover active on Daily & Monthly
Stochastic: 90 on Daily – indicates strong upward momentum
CCI: 155 – overbought but in a bullish continuation zone
Bollinger Bands: Price broke out of a tight squeeze zone — start of volatility expansion phase
BB Squeeze + Bullish VWAP: Adds confirmation that the trend is beginning to expand
________________________________________________________________________________
🧱 Support & Resistance:
🔺 Resistance Levels:
810.43 – First resistance to watch above current price
832.12 – Prior swing level; price may pause or consolidate here if momentum continues
867.33 – Longer-term resistance zone, marked as a level of interest
Top Range: 1054.2 – Long-term weak resistance zone that triggered the previous major selloff
🔻 Support Levels:
753.53 – Closest support below breakout
718.32 – Well-tested swing level; acted as floor in recent range
696.63 – Important structural support
Bottom Range (Demand Zone): 597.05 – Major long-term support, last zone from where price rallied strongly
________________________________________________________________________________
👀 What’s Catching Our Eye:
The combination of price compression, bullish engulfing breakout, and high volume participation makes this setup stand out. Volume is not just high — it’s clean and backed by structure. The candle formation, RSI breakout, and BB squeeze all come together, creating a powerful setup for momentum continuation. This kind of alignment is rare and usually signals smart money entry.
________________________________________________________________________________
🔍 What We’re Watching For:
The most critical zone is the 796.90 breakout level. If price sustains above it for the next couple of sessions, the structure remains intact. We’re also watching for a possible retest toward the 753–755 zone — if the stock pulls back there on low volume and bounces again, it may offer a low-risk entry setup. Continuation beyond 810 could build momentum, but we will rely on risk-reward and price behaviour — not predictions.
________________________________________________________________________________
✅ Best Buy Level for Equity (Low Risk Idea):
Breakout Entry: Above 796.90, only on follow-through or sustained closing above breakout zone
Pullback Entry: Into the 753.53–755 support zone if the price stabilizes and shows a bullish reversal
Stop Loss: Structure-based, below 736.95 (on closing basis)
Risk-Reward Thinking: Look for 1:1 initially, then trail the stop as the move develops; no fixed projections — price action will guide the outcome
________________________________________________________________________________
💼 Sector Tailwinds:
PG ELECTROPLAST operates in the electronics and contract manufacturing sector — two spaces getting a major boost from PLI schemes, China+1 shift, and rising domestic demand. India’s push toward import substitution, rising middle-class consumption, and government incentives are all helping businesses like PG scale up. This provides a strong macro tailwind to any technical strength seen on charts.
________________________________________________________________________________
⚠️ Risk to Watch:
If price slips back below 753, the breakout weakens
A close below 736.95 negates the breakout setup and could invite selling pressure
Indicators are showing strength, but slightly stretched — so expect volatility and avoid over positioning
Never trade based only on breakout excitement — always wait for confirmation and manage risk first
________________________________________________________________________________
🔮 What to Expect Next:
If the price holds above 796.90, the path toward 810.43 may open up quickly. Sustained volume and consolidation near highs would indicate strength, while sharp rejection could signal a trap. A minor pullback to support zones (753–755) could offer a second opportunity if structure holds. The next few candles will tell us whether this breakout becomes a trend or just a temporary spike.
________________________________________________________________________________
🧠 How to Trade PG ELECTROPLAST (For Educational Use Only):
Breakout Plan (Hypothetical):
🔹 Entry: Above 796.90 (only if price sustains)
🔹 Stop Loss: 736.95 (closing basis; risk-controlled)
🔹 Trade Logic: Use position sizing as per capital and SL distance
🔹 Risk-Reward: Look for 1:1 minimum, trail for 1:2+ if structure expands — don’t fix targets, let the chart lead
🔹 Pullback Buy: Into 753–755 zone with same SL (if structure supports)
________________________________________________________________________________
⚠️ Disclaimer (Please Read):
• This chart is shared for educational purposes only and is not investment advice.
• I am not a SEBI-registered advisor.
• The information provided here is based on personal market observation.
• No buy/sell recommendations are being made.
• Please do your own research or consult a registered financial advisor before making any trading decisions.
• Trading involves risk. Always use proper risk management.
________________________________________________________________________________
💬 Found this helpful?
Where would you look for a trade in PG — breakout follow-through or pullback into the support zone?
Share your thoughts or questions in the comments ⬇️
🔁 Share this with your trading community
✅ Follow STWP for clean technical setups backed by price action and volume
🚀 Let’s trade with patience, logic, and clarity!
Be Self-Reliant | Trade with Patience | Learn with Logic
________________________________________________________________________________
METROPOLIS – Big Volume Breakout + Price Action + Momentum___________________________________________________________________________
📈 METROPOLIS – Big Volume Breakout | Strong Momentum Building |
Price Action | Volume Structure
🕒 Chart Type: Daily Chart
📆 Date: July 9, 2025
___________________________________________________________________________
Price Action: METROPOLIS HEALTHCARE LTD has delivered a strong breakout on the daily chart, moving out of a multi-week consolidation zone between 1880–1910 with a wide-range bullish candle on July 9. This breakout above the key resistance of 2110.9 comes with a clean structure, strong closing, and sharp momentum — now placing the stock near its 52-week high. The accumulation phase is likely over, and this price action suggests the beginning of a new trend. As a key player in the diagnostics sector, METROPOLIS is gaining renewed attention post-COVID, with the healthcare space showing strong tailwinds and fresh investor interest.
___________________________________________________________________________
Chart Pattern: The chart is showing a Flat Base Breakout following a multi-week consolidation, indicating the potential beginning of a new momentum leg within the broader structure. Notably, the base was tight and shallow, which is considered a strong bullish signal as it reflects controlled accumulation and limited profit-booking. This clean breakout hints at renewed strength and the possibility of sustained upside if volume and structure hold.
___________________________________________________________________________
Candlestick Pattern: NA
___________________________________________________________________________
Volume Analysis: The volume analysis strongly supports the breakout, with trading volume on the breakout day soaring to over 5 times the average of the past 20 sessions. This surge was not just in quantity but also in delivery volume, signaling that the move was backed by genuine long-term accumulation rather than intraday speculation. As the classic saying goes, “volume precedes price” — and this sharp spike clearly points to smart money entering the stock, lending credibility to the breakout and hinting at further upside potential.
___________________________________________________________________________
Technical Indicators: The technical indicators paint a strongly bullish picture. The RSI on the daily timeframe is at 84, which, while overbought, reflects strength and momentum rather than exhaustion. The MACD has triggered a bullish crossover, with a steadily rising histogram indicating a healthy momentum buildup. Both CCI and Stochastic oscillators are deep in bullish territory — CCI above 300 and Stochastic over 88 — highlighting the intensity of the current uptrend. Additionally, the price has expanded beyond the upper Bollinger Band, suggesting the start of a volatility expansion phase, which often accompanies strong directional moves.
___________________________________________________________________________
Support & Resistance: The stock has given a decisive breakout above ₹2110.9, which now acts as a strong reference point and the official top of its recent consolidation range. This level was pierced by a bullish candle backed by high volume, confirming strength and conviction in the move. Ahead, the stock faces its first hurdle at ₹2157, a short-term resistance just above the breakout zone where minor profit-booking may emerge. Beyond that, ₹2256.1 marks a key medium-term resistance aligned with a previous swing high — a level to watch closely if the rally continues on solid volume. For positional traders, ₹2401.3 stands as a distant resistance zone that, while weak, could be relevant if momentum accelerates. On the downside, ₹1912.7 offers immediate support, being the level that held firm during base formation. If deeper retracements occur, ₹1767.5 and ₹1668.4 are layered supports where the price previously showed strength. At the very base lies ₹1315, the major long-term demand zone — a structural support that triggered the prior trend and serves as the final defence in case of any broad weakness.
___________________________________________________________________________
What’s Catching Our Eye: The price has decisively broken above a multi-week resistance zone, and what makes this move stand out is the massive volume backing it. This isn't just a random spike — it's a structured breakout with all the internals lining up beautifully. Momentum indicators like RSI, MACD, CCI, and Stochastic are all in bullish alignment, confirming that the strength is real and not a one-off event. This kind of confluence often signals the start of a meaningful trend, not just a short-lived rally.
___________________________________________________________________________
What We’re Watching For: The key question now is whether the price can sustain above ₹2110.9, the breakout level, without slipping back into the previous range — a crucial sign of breakout validation. We're also keeping an eye out for a healthy pullback toward the ₹1880–₹1910 zone, which could offer a far better risk-reward entry if the uptrend remains intact. Most importantly, the bigger picture is in focus: Is this the beginning of a larger trend aiming for ₹2400+, or are we simply witnessing a short-term momentum burst? The next few sessions will be critical in answering that.
___________________________________________________________________________
Best Buy Level for Equity (Low Risk Idea): A low-risk buying opportunity opens above ₹2110.9, but only if the price sustains this breakout for a day or two — confirming strength and avoiding a false breakout scenario. Alternatively, a pullback to the ₹1880–₹1910 zone could offer an excellent risk-reward setup, especially if accompanied by a clear bullish reversal signal (like a strong candle or volume spike). In both cases, keep a strict stop loss at ₹1839 on a closing basis to protect against deeper downside.
___________________________________________________________________________
Sector Tailwinds: The diagnostic sector continues to build long-term strength in the post-COVID landscape, as healthcare awareness and preventive testing become mainstream. Investors are increasingly allocating capital toward healthcare services, recognizing their structural growth potential. Add to that the rising urban demand for quality diagnostics and the company's strong brand trust, and you get a solid layer of fundamental support fueling this rally — making the technical breakout even more meaningful.
___________________________________________________________________________
Risk to Watch: If the price fails to hold above ₹2110 and starts slipping below ₹1910, there’s a real risk of this breakout turning into a false move. While the current momentum is strong, indicators are overheated, which increases the chances of a short-term pullback or shakeout. Most importantly — no confirmation means no trade. Avoid chasing blindly; let the price action validate the move before committing capital.
___________________________________________________________________________
What to Expect Next: The stock may see a sideways move or a minor pullback toward the ₹1910 zone as it digests the breakout. However, if the price holds above the breakout level, we could see a continuation move toward ₹2157–₹2256 in the near term. The key to watch is volume — if the stock holds near highs with rising volume over the next 2–3 sessions, it could trigger a strong trending move, confirming that smart money is firmly in control.
___________________________________________________________________________
How to Trade METROPOLIS (For Educational Use Only):
Here’s a simple Breakout Trade Plan based on current structure and volume confirmation:
🔹 Entry: Above ₹2110.9 — either on a successful retest of the breakout level or a clean follow-through candle with strength
🔹 Stop Loss: ₹1839 (on closing basis) to protect capital in case of breakdown
🔹 Risk-Reward: Aim for 1:1 initially, then trail for 1:2+ if momentum holds
🔹 Position Sizing: Adjust based on your capital, risk appetite, and SL range — avoid going all-in; stay disciplined with allocation
📌 Always follow your trading plan. This setup is for educational and analysis purposes only.
___________________________________________________________________________
⚠️ Disclaimer (Please Read):
• This chart is shared for educational purposes only and is not investment advice.
• I am not a SEBI-registered advisor.
• The information provided here is based on personal market observation.
• No buy/sell recommendations are being made.
• Please do your own research or consult a registered financial advisor before making any trading decisions.
• Trading involves risk. Always use proper risk management.
___________________________________________________________________________
💬 Found this helpful?
What would be your ideal entry in this METROPOLIS setup — breakout follow-through or demand zone pullback?
Drop your thoughts or questions in the comments below ⬇️
🔁 Share this with your trading community
✅ Follow STWP for clean technical setups backed by price action and volume
🚀 Let’s trade with patience, logic, and clarity!
Be Self-Reliant | Trade with Patience | Learn with Logic
___________________________________________________________________________

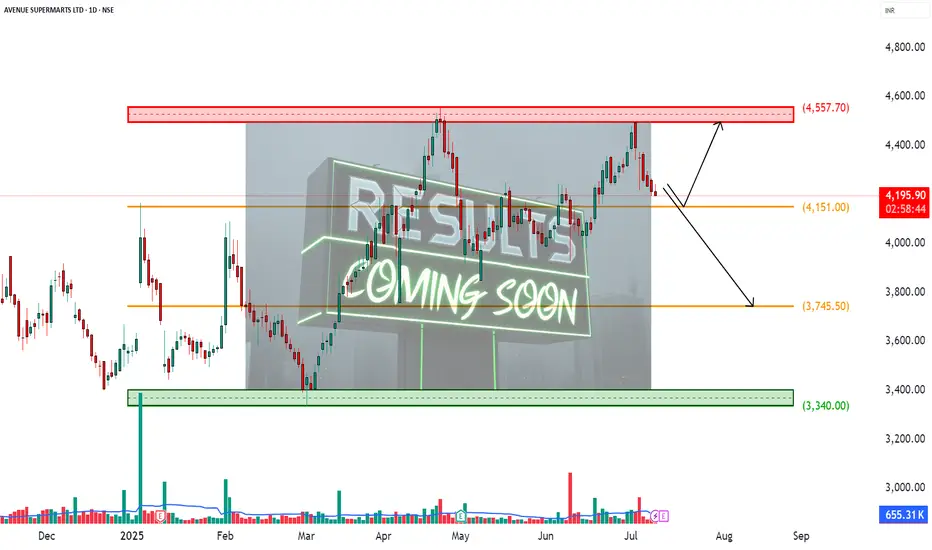
DMART – Earnings Incoming________________________________________________________________________________📈 DMART – Earnings Incoming: What’s the Right Time to Enter an Options Trade?
📆 Result Date: 11th July 2025 (Friday)
🕒 Strategy Style: Beginner + STWP HNI Learning Setup
🔍 For Educational Purposes Only
________________________________________________________________________________
🧠 What's the Setup?
DMART is announcing results on Friday, 11th July. We’re expecting a strong move — either up or down — because of mixed expectations around revenue and margins.
When you trade options around results, timing your entry is just as important as selecting the right strikes.
Let’s simplify it ⬇️ ________________________________________________________________________________✅ Option 1: Enter on 10th July (Thursday, After 2 PM)
💡 This is the ideal time for most traders.
🟢 Better option prices (not too inflated yet)
🟢 Good liquidity for smooth entry
🟢 Gives you overnight time to plan
🟢 You avoid the Friday panic crowd
🎯 STWP Suggested Strategy:
Buy 4300 CE + 4100 PE = ~₹180 total premium
This is called a Long Strangle – You win if the stock moves sharply up or down after results.
________________________________________________________________________________⚠️ Option 2: Enter on 11th July (Friday, Before 2 PM)
🔸 You might think, "Let me wait till Friday to get more clarity" — but there’s a catch:
❌ Option prices become expensive (high IV)
❌ Bid-ask spreads get wide (hard to enter)
❌ No time to react if results come intraday
❌ You’re stuck with weekend gap risk without prep
Unless you're experienced or scalping early, it’s not ideal for beginners.
________________________________________________________________________________🎯 Best Timing Rule – STWP Style:
📌 Enter on 10th July between 2:00 PM – 3:15 PM
Why?
You’ll lock in a clean setup with decent pricing and avoid stress.
📆 Exit Plan:
Hold through the weekend → Exit on Monday (14th July) if stock moves sharply 🔥
________________________________________________________________________________🧠 Alert:
Set alerts at:
₹4450 (Upside)
₹3950 (Downside)
If either hits on Monday, trail the winning side and exit the losing leg.
________________________________________________________________________________
📚 This is a learning example – not a trade recommendation.
Options carry risk. Please manage your capital and don’t trade blindly.
________________________________________________________________________________⚠️ Disclaimer (Please Read):
• This chart is shared for educational purposes only and is not investment advice.
• I am not a SEBI-registered advisor.
• The information provided here is based on personal market observation.
• No buy/sell recommendations are being made.
• Please do your own research or consult a registered financial advisor before making any trading decisions.
• Trading involves risk. Always use proper risk management.
________________________________________________________________________________
NAUKRI - Demand Zone + Key Levels________________________________________________________________________________
📊 INFO EDGE (NSE: NAUKRI) – Beginner Chart Study | Demand Zone + Key Levels
🕒 Chart Timeframe: 15-Min | 📆 Updated: July 8, 2025
________________________________________________________________________________
🔍 What the Chart Shows:
NAUKRI recently bounced from a clearly defined demand zone and is now trading near a key mid-level. This educational post is meant to help understand how price behaves around such zones.
________________________________________________________________________________
✅ Zones to Observe for Strength (Upside):
• Above 1489.00: Price sustaining above this top range may indicate strength.
• Between 1432.35 and 1404.10: This broader zone has acted as support earlier. If revisited, watch how price behaves here.
________________________________________________________________________________
⚠️ Neutral / Observation Area:
• Around 1459.40 (near 1460.65): Price is consolidating near this level. It’s better to observe and wait for more clarity from price movement and volume.
________________________________________________________________________________
🔻 Zones to Observe for Weakness (Downside):
• Between 1460.65 – 1489.00: If price reacts negatively here (e.g., rejection candles or high supply volume), observe how it develops.
• Below 1402.85: This would invalidate the previous demand zone. Further weakness could be possible if price closes below.
________________________________________________________________________________
🧠 Learning Takeaways for Traders:
• Avoid trades in the middle zone without clear confirmation.
• Always wait for bullish or bearish patterns and supporting volume before considering action.
• Structure and levels help guide observation – not prediction.
________________________________________________________________________________
📌 Levels Recap:
• Top Range (Resistance): 1489.00
• Mid Resistance: 1460.65
• Mid Support: 1432.35
• Bottom Range: 1404.10
• Demand Zone Reference: 1414.20 – 1404.90 | SL Reference Level: 1402.85 (used for structure observation only)
________________________________________________________________________________
⚠️ Disclaimer (Please Read):
• This chart is shared for educational purposes only and is not investment advice.
• I am not a SEBI-registered advisor.
• The information provided here is based on personal market observation.
• No buy/sell recommendations are being made.
• Please do your own research or consult a registered financial advisor before making any trading decisions.
• Trading involves risk. Always use proper risk management.
________________________________________________________________________________
💬 Join the Discussion (Comments):
✅ Was this chart structure easy to understand?
✅ How do you look at such supply and demand zones in your charting?
✅ Want more beginner-focused educational charts? Drop a 💬 below.
✅ If you're learning technical analysis, follow for more such breakdowns.
________________________________________________________________________________

KOTAKBANK – Strong Call Long Build-Up________________________________________________________________________________
📈 KOTAKBANK – Strong Call Long Build-Up Signals Possible Upside Attempt
🕒 Chart: 15-Min | 📆 July 8, 2025
________________________________________________________________________________
🔍 What’s Catching Our Eye:
Buyers are aggressively building positions in multiple Call strikes from ₹2200 to ₹2320, hinting at bullish sentiment returning.
________________________________________________________________________________📌 What We’re Watching For:
If price sustains above ₹2240–₹2241.5, we may see a move toward ₹2300+ in the short term.
________________________________________________________________________________📌 OI Inference:
Call side is witnessing Long Build-Up (2240–2320, even 2400 CE), while Put side is under Short Build-Up, showing Put sellers are confident the downside is limited.
________________________________________________________________________________🔁 Trend Bias:
🟢 Bullish to Range-Bound – as long as price holds above ₹2200 with rising Call OI and falling PE premiums.
________________________________________________________________________________🧠 Trade Logic / Reasoning:
• Major Call strikes like 2240, 2260, 2300 under Long Build-Up
• 2200 CE shows Short Covering – a sign of prior bearish positions being exited
• Puts are mostly under Short Build-Up = downside cushion building
• Volatility is low = option buyers betting on directional breakout
________________________________________________________________________________📍 Important Levels to Mark:
🔺 Top Range (Resistance): ₹2241.5
🔻 Bottom Range (Support): ₹2111
🟢 Demand Zone: NA
🔴 Supply Zone: NA
________________________________________________________________________________🎯 Trade Plan (Educational Purpose Only):
✅ Buy (Equity): Above ₹2241.5 with strength and follow-through
✅ Sell (Equity): Only below ₹2200 if fresh PE Long Build-Up appears
✅ Best CE to Buy: ₹2240 CE or ₹2260 CE if price sustains above ₹2240
❌ Avoid Put Buying: Most Put options are under Short Build-Up (bearish bets getting closed)
📌 Strategy Idea (Low Risk):
Bull Call Spread – Buy ₹2240 CE, Sell ₹2300 CE
→ Works well if stock rises, and risk stays limited
________________________________________________________________________________⚠️ Invalidation Levels:
🔻 Below ₹2200 = Long view weakens
🔺 Above ₹2241.5 = bullish breakout confirmed
________________________________________________________________________________
⚠️ Disclaimer:
This is only for educational purposes.
STWP is not a SEBI-registered advisor.
Please consult a financial advisor before making trades.
STWP is not responsible for any trading decisions based on this content.
________________________________________________________________________________
💬 Will KOTAKBANK break out above ₹2240 or stay stuck?
⬇️ Share your view in the comments!
🔁 Repost this if you’re tracking the zone
✅ Follow STWP for clean Options + Price Action setups
🚀 Let’s trade with clarity and confidence!
________________________________________________________________________________

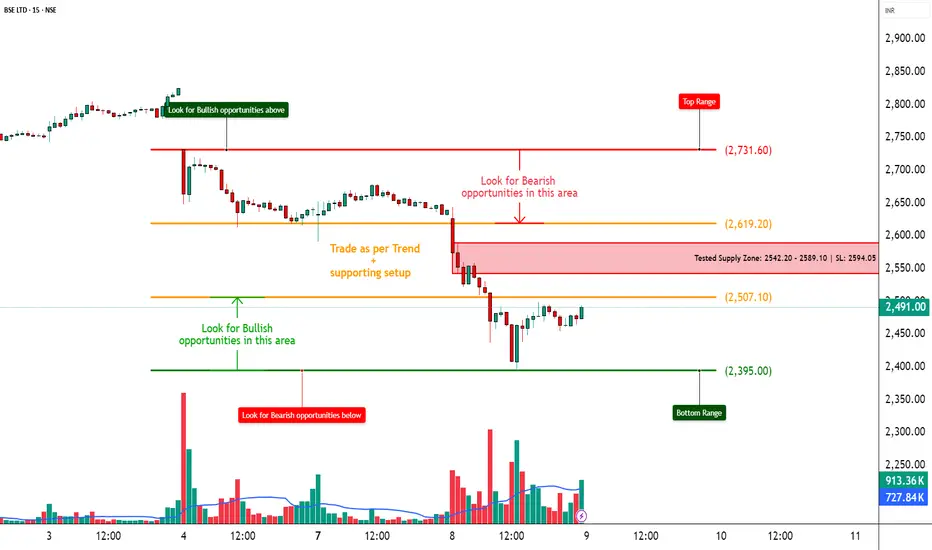
BSE – Strong Call Writing | Tested Supply Zone in Play________________________________________________________________________________
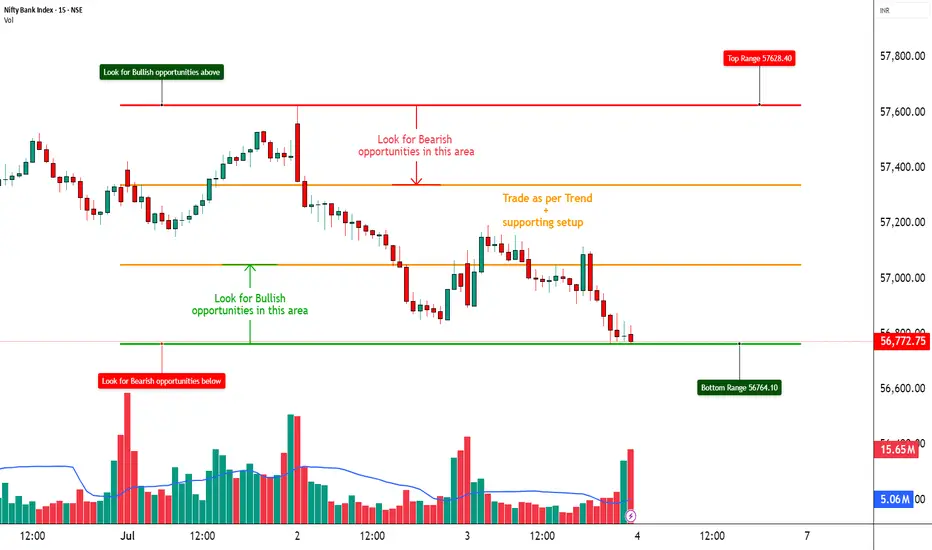
📈 BSE – Strong Call Writing Below 2600 | Tested Supply Zone in Play
🕒 Chart: 15-Min
📆 July 8, 2025
________________________________________________________________________________
🔍 What’s Catching Our Eye:
Massive Call writing seen from ₹2400 to ₹2900, clearly indicating resistance at higher levels.
________________________________________________________________________________📌 What We’re Watching For:
Price is facing selling near the ₹2542–₹2589 supply zone; a rejection here can drag it toward ₹2395 or below.
________________________________________________________________________________📌 OI Inference:
CEs are heavily sold across all levels – especially 2600, 2500, 2700, and 2400 CE.
Strong Put buying from 2400 down to 2000 PE → Market participants are expecting downside.
________________________________________________________________________________🔁 Trend Bias:
🔴 Bearish to Range-Bound – unless price breaks above ₹2594.05 with volume and CE unwinding.
________________________________________________________________________________🧠 Trade Logic / Reasoning:
• 12+ Call Strikes under Short Build-Up = strong ceiling
• Long Build-Up in deep Puts (2500, 2400, 2300, even 2000)
• Tested supply zone between ₹2542–₹2589 = rejection likely
• PE IVs rising = fear building up, especially below 2500
________________________________________________________________________________📍 Important Levels to Mark:
🔺 Top Range (Resistance): ₹2731.6
🔻 Bottom Range (Support): ₹2395
🟢 Demand Zone: NA
🔴 Supply Zone: ₹2542.20 – ₹2589.10 | SL: ₹2594.05(Tested Zone)
________________________________________________________________________________🎯 Trade Plan (Educational Purpose Only):
✅ Sell (Equity): Near ₹2542–₹2589 if price rejects the supply zone
✅ Buy (Equity): Only above ₹2594.05 with strong volume
✅ Best Put to Buy: ₹2500 PE or ₹2400 PE on breakdown
❌ Avoid Call Buying: All Calls are under heavy selling
📌 Strategy Idea (Low Risk):
Bear Put Spread – Buy 2500 PE, Sell 2400 PE
→ Profitable if stock drops, risk stays limited
________________________________________________________________________________⚠️ Invalidation Levels:
🔺 Above ₹2594.05 = bearish setup may fail
🔻 Below ₹2395 = confirms breakdown and trend continuation
________________________________________________________________________________
⚠️ Disclaimer:
This post is for educational purposes only.
STWP is not a SEBI-registered advisor.
No buy/sell recommendations are made.
Please consult your financial advisor before trading.
STWP is not responsible for any trading decisions based on this content.
________________________________________________________________________________
💬 Will BSE break supply and fly, or get rejected again?
⬇️ Share your view in the comments!
🔁 Repost this if you're watching BSE
✅ Follow STWP for clean Options + Price Action insights
🚀 Let’s trade with clarity and confidence!
________________________________________________________________________________
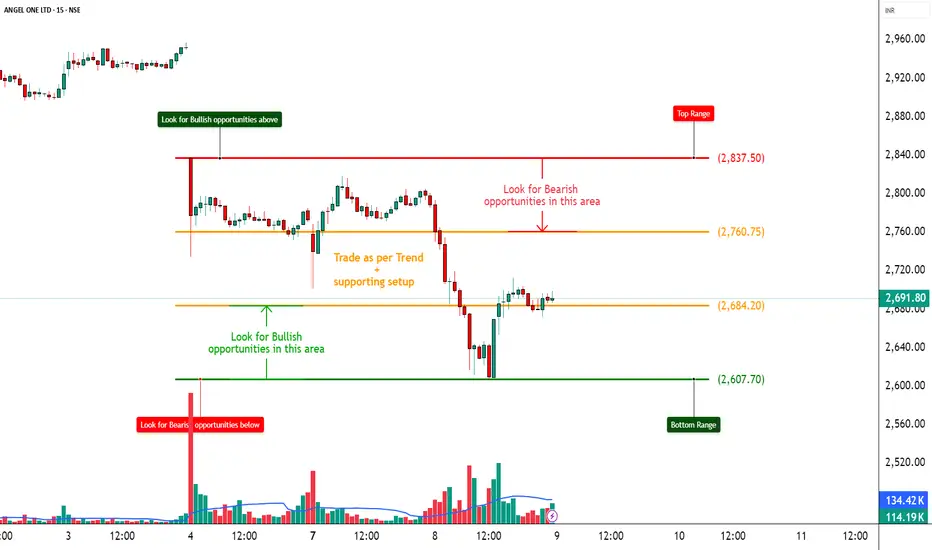
ANGELONE – Heavy CE Writing Signals Bearish Bias________________________________________________________________________________📈 ANGELONE – Heavy CE Writing Signals Bearish Bias Below 2800
🕒 Chart: 15-Min
📆 July 8, 2025
________________________________________________________________________________
🔍 What’s Catching Our Eye:
Call writers aggressively building positions from ₹2700 to ₹3000, capping upside.
________________________________________________________________________________
📌 What We’re Watching For:
If price fails to cross ₹2750–₹2800, there’s a chance it can fall back toward ₹2600 or lower.
________________________________________________________________________________
📌 OI Inference:
CEs are heavily written across the board – from 2700 to 3000 – while PEs are being accumulated.
This is bearish skew with strong support building up around ₹2500–2600.
________________________________________________________________________________
🔁 Trend Bias:
🔴 Bearish to Range-Bound – unless price breaks above ₹2837.5 with volume and Call unwinding
________________________________________________________________________________
🧠 Trade Logic / Reasoning:
• Multiple Call Strikes are under Short Build-Up
• Strong Put writing from 2700 down to 2400 = hedging for downside
• Price is below most of the heavy Call strikes → smart money may be expecting weakness
• Implied Volatility (IV) on PEs rising → indicates fear of volatility spike on downside
________________________________________________________________________________
📍 Important Levels to Mark:
🔺 Top Range (Resistance): ₹2837.5
🔻 Bottom Range (Support): ₹2607.7
🟢 Demand Zone: NA
🔴 Supply Zone: NA
________________________________________________________________________________🎯 Trade Plan (Educational Purpose Only):
✅ Sell (Equity): Near ₹2750–₹2800 if price gets rejected
✅ Buy (Equity): Only above ₹2837.5 with good volume
✅ Best Put to Buy: ₹2700 PE or ₹2600 PE if price starts falling again
❌ Avoid Call Buying: Most Calls are under selling pressure(Look for reversal confirmation)
📌 Strategy Idea (Low Risk):
• Bear Put Spread – Buy 2700 PE, Sell 2600 PE
→ You gain if price falls, but risk is limited
________________________________________________________________________________⚠️ Invalidation Levels:
🔺 If price moves above ₹2837.5, bearish setup may fail
🔻 If price breaks below ₹2607.7, more downside likely
________________________________________________________________________________⚠️ Disclaimer:
This analysis is for educational purposes only.
STWP is not a SEBI-registered advisor.
No buy/sell recommendations are made.
Please consult your financial advisor before trading.
STWP is not responsible for trading decisions based on this post.
________________________________________________________________________________
💬 Will ANGELONE bounce or fall more?
What’s your view on ANGELONE? Comment below ⬇️
🔁 Share this if you're tracking the zone
✅ Follow STWP for clean Price Action + OI Trades
🚀 Let’s trade with clarity and confidence!
________________________________________________________________________________
ASIAN PAINTS LTD – Gap Fill Setup Near Resistance | Price Action________________________________________________________________________________📈 ASIAN PAINTS LTD – Gap Fill Setup Near Resistance | Price Action Analysis
🕒 Chart Type: Daily (1D)
________________________________________________________________________________
🔍 What’s Catching Our Eye:
Price is testing a major resistance with a gap still left to be filled above.
________________________________________________________________________________
📌 What We’re Watching For:
A breakout above 2491 or a reversal from the resistance zone.
________________________________________________________________________________
📊 Volume Footprint:
Breakout occurred on slightly lower volume – caution advised.
________________________________________________________________________________
🔁 Trend Bias:
Short-term bullish with breakout momentum in play.
________________________________________________________________________________
🧠 Trade Logic / Reasoning:
Strong bullish candle with BB breakout and VWAP support suggest strength.
________________________________________________________________________________
📍 Important Levels to Mark:
Key zones are 2491 (Top) and 2124.75 (Bottom) for breakout or bounce setups.
________________________________________________________________________________
🎯 Trade Plan (Educational Purpose Only):
Best Buy:
Above 2491 on retest with volume; or near 2451–2419 with bullish reversal.
________________________________________________________________________________
Best Sell:
Below 2451 with rejection confirmation; or near 2520 if breakout fails.
________________________________________________________________________________
Demand Zone / Supply Zone: NA
________________________________________________________________________________
⚠️ Invalidation Below:
Breakdown below 2435 would invalidate current bullish bias.
________________________________________________________________________________
⚠️ Disclaimer:
This analysis is for educational purposes only.
STWP is not a SEBI-registered advisor.
No buy/sell recommendations are made.
Please consult your financial advisor before trading.
STWP is not responsible for trading decisions based on this post.
________________________________________________________________________________
💬 Found this helpful?
Will Asian Paints Breakout or Fakeout
Share your thoughts in the comments ⬇️
🔁 Spread the insight with fellow traders
✅ Follow STWP for smart technical setups backed by volume and price action
🚀 Let’s trade with patience, logic, and clarity!
Be Self-Reliant | Trade with Patience | Learn with Logic
________________________________________________________________________________

BRITANNIA INDUSTRIES LTD. – TECHNICAL INSIGHT________________________________________________________________________________
📊 BRITANNIA INDUSTRIES LTD. – TECHNICAL INSIGHT
📆 Date: July 8, 2025 | 🕒 Daily Chart
📍 Symbol: NSE: BRITANNIA
💡 Educational Breakdown – For Study & Learning Only
________________________________________________________________________________
🔹 Price Action Overview:
Britannia closed at ₹5,884.00, up by +1.95%, forming an “Above the Stomach” bullish continuation pattern just below a key resistance zone.
________________________________________________________________________________
🔴 Top Range (Resistance): ₹5,899.50
📉 Bear Strength: 53
The price has approached a previous supply zone where sellers have shown resistance. Watch this level closely for either a breakout or rejection.
________________________________________________________________________________
🟢 Bottom Range (Support): ₹4,506
📈 Bull Strength: 77
This zone acted as a strong demand base in the past, initiating a rally with a sharp volume spike.
________________________________________________________________________________
🔍 Pattern Focus: Above the Stomach
A bullish candle has opened above the midpoint of the previous red candle, suggesting buyer strength. This often signals momentum continuation, especially near breakout levels.
________________________________________________________________________________
🎯 What to Watch For:
✅ Breakout Confirmation Zone:
If price closes decisively above ₹5,900 with volume expansion, it may indicate strength and fresh upside continuation.
________________________________________________________________________________
🚫 Failure Zone:
If price faces rejection near ₹5,900–₹5,920 and forms a bearish engulfing or strong upper wick, short-term profit booking could occur.
________________________________________________________________________________
📌 Risk Management Tip:
Traders typically look for entry above breakout candle high with a stop below recent swing low or candle low. Volume confirmation is essential before considering directional bias.
________________________________________________________________________________
🔍 Contextual Takeaway:
This is a textbook example of price consolidating just below a resistance after a strong trend and forming a bullish candle setup. A breakout or failure here can define the next leg of the move.
________________________________________________________________________________
📚 Stay objective, wait for confirmation, and let the price lead.
________________________________________________________________________________
Entry Above ₹5,905–₹5,920 (on breakout)
Stop Loss ₹5,765
Risk Reward 1:1 | 1:2 +
________________________________________________________________________________
⚠️ Disclaimer:
This analysis is for educational purposes only.
STWP is not a SEBI-registered advisor.
No buy/sell recommendations are made.
Please consult your financial advisor before trading.
STWP is not responsible for trading decisions based on this post.
________________________________________________________________________________
What’s your view on BRITANNIA ? Comment below ⬇️
🔁 Share this if you're tracking the stock
✅ Follow STWP for clean Price Action + Candlestick patterns
🚀 Be Self-Reliant | Trade with Patience | Learn with Logic
________________________________________________________________________________

HINDUNILVR – TECHNICAL ANALYSIS________________________________________
📈 HINDUNILVR – TECHNICAL ANALYSIS
📆 Date: July 8, 2025 | ⏱ Timeframe: Daily Chart
🔍 Educational Breakdown – For Learning & Study Use Only
________________________________________
🔹 Price Action Zones
• 🔴 Top Range: 2602
• Resistance: 2437.07 – 2463.73 – 2511.77
• 🟢 Bottom Range: 2136
• Support: 2287.67 – 2314.33 – 2362.37
________________________________________
🔹 Chart Pattern: ✅ Bullish Marubozu Breakout
Price bounced from a demand zone near 2326.90 – 2304| SL: 2302.50 with a powerful Marubozu candle and reclaimed structure strength. This breakout aligns with STWP’s HNI setup and suggests the beginning of a strong bullish leg.
________________________________________
🔹 Reversal Candlestick Patterns:
✅ Bullish Marubozu
✅ Strong follow-through near support
✅ High conviction breakout from base – Open = Low
________________________________________
🔹 Volume Footprint:
✅ Volume spiked to 2.7M (vs average 1.63M)
✅ Indicates institutional participation backing the breakout
🚨 Watch for continuation volume above 2415 to confirm momentum
________________________________________
🔹 Trend Bias: ✅ Bullish
Clear bullish trend forming after breakout. Supports are holding, and resistance levels are now being tested with strength.
________________________________________
📌 What’s Catching Our Eye:
• STWP HNI Setup triggered at 2400–2415 range
• Breakout above strong support near 2300–2320
• OI Data and Option Chain analysis supports upward continuation
________________________________________
👀 What We’re Watching For:
• Sustained close above 2415 = bullish continuation
• Option build-up hints at possible follow-through toward higher zones
• Strong CE activity at 2420, 2440, and 2460 levels
________________________________________
🔹 OPTION CHAIN ANALYSIS – KEY TAKEAWAYS
💥 CALL Side (Bullish Builds):
• 2420 CE: 40.05 – 📈 OI up +158%, Long Build-Up
• 2440 CE: 31.25 – 📈 OI up +182%, Long Build-Up
• 2460 CE: 24.50 – 📈 OI up +345%, Long Build-Up
• 2500 CE: 14.45 – 📈 OI up +22%, Long Build-Up
🚀 Indicates participants are positioning for extended upside toward 2460–2500
📉 PUT Side (Writers in Control):
• 2300 PE: Down -60%, Short Build-Up
• 2400 PE: Down -52%, Short Build-Up
💡 Suggests confidence that price will hold above 2400
🧠 Conclusion from OI Data:
Strong bullish sentiment — Call Writers/Buyers increasing exposure at higher strikes, Puts being shorted. Volume + OI = directional strength.
________________________________________
⚠️ Risks to Watch:
• Close below 2390–2395 = early weakness sign
• Bearish divergence + volume fade risk
• Watch 2460–2512 for rejection
________________________________________
🔮 What to Expect Next:
• ⚡ Price retesting 2460 zone likely
• 🔄 Pullbacks toward 2395–2405 may offer low-risk re-entry
• ⚠️ Watch for spikes in volatility near 2500
________________________________________
📊 Trade Plan (Educational Only – Based on Logic + Volume Confirmation)
🔼 Breakout Long Setup
• Entry: Above 2415
• Stop Loss: 2339.30
• Risk–Reward: 1:1 to 1:2 +
📌 Why:
• Bullish Marubozu + Volume
• OI Long Build-Up at 2420–2460
• STWP HNI Setup alignment
🔁 Pullback Long Setup
• Entry Zone: 2395–2400
• Stop Loss: 2365
• Risk–Reward: 1:1 to 1:2 +
📌 Why:
• Breakout retest zone
• Tight SL with continuation logic
🔽 Bearish Setup (Only on Failure)
• Entry: Below 2360
• Stop Loss: 2410
• Risk–Reward: Flexible (trader-defined)
📌 Why:
• Only valid on strong breakdown with volume
• Reversal below structure
________________________________________
📊 Option Trade Ideas – For Learning Purpose Only
🔼 Best CE (Bullish Bias)
➡️ 2420 CE @ 40.05
• Risk–Reward Potential: 1:1 to 1:2+
🛑 SL: 26
📌 Why: Clean momentum zone, well-aligned with breakout
🟡 Alternate CE (Momentum Extension)
➡️ 2440 CE @ 31.25 – if expecting further move toward 2490–2510
• Slightly lower Delta, higher risk-reward
🔽 Best PE (Only if Breakdown)
➡️ 2400 PE @ 34.40
• Use only below 2390 with high-volume reversal
• Risk–Reward Potential: 1:1 to 1:2 +
🛑 SL: 21
________________________________________
❌ Invalidation Triggers:
• Daily close below 2360
• Long unwinding on CE strikes
• PE Long Build-Up + Volume = Bearish Shift
________________________________________
⚠️ Disclaimer:
This analysis is for educational purposes only.
“STWP HNI Setup” is a proprietary internal model shared for study and learning.
STWP is not a SEBI-registered advisor.
This is not a buy/sell recommendation.
Please consult your financial advisor before taking any action.
STWP is not responsible for trading decisions based on this post.
________________________________________
💬 Found this helpful?
Did the STWP HNI Setup help you anticipate the move?
💭 Drop your thoughts in the comments ⬇️
🔁 Share this with fellow traders
✅ Follow STWP for volume-based, logic-driven setups
🚀 Be Self-Reliant | Trade with Patience | Learn with Logic
________________________________________
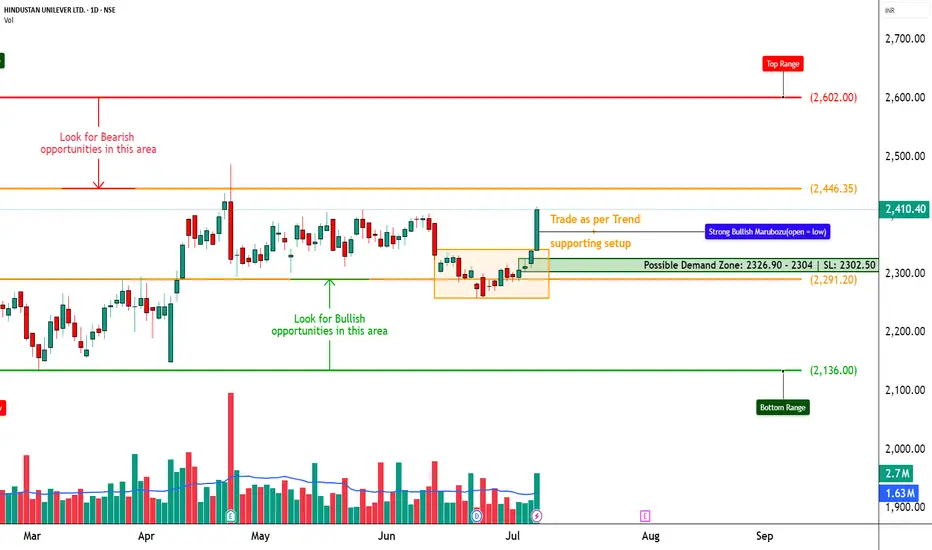
MAZDOCK – TECHNICAL ANALYSIS - W PATTERN________________________________________________________________________________
📈 MAZDOCK – TECHNICAL ANALYSIS
📆 Date: July 4, 2025 | ⏱ Timeframe: Daily Chart
🔍 Educational Breakdown – For Learning & Study Use Only
________________________________________________________________________________
🔹 Price Action Zones
• 🔴 Top Range: 3775
• Resistance: 3362 – 3396 – 3423
• 🟢 Bottom Range: 3077.7
• Support: 3241 – 3274 – 3301
________________________________________________________________________________
🔹 Chart Pattern: ✅ W-Bottom Formation
A clean W-shaped reversal pattern is forming. Price is respecting demand zones and gradually forming higher lows. Neckline lies around 3369 — breakout above this may fuel further upside.
________________________________________________________________________________
🔹 Reversal Candlestick Patterns:
⛔ No major reversal candle on 4th July 2025.
________________________________________________________________________________
🔹 Volume Footprint:
✅ Gradual volume pickup
🚨 Watch for breakout above 3362–3396 with volume >3.5M
🔼 A successful breakout may trigger a swift move toward 3425–3520.
________________________________________________________________________________
🔹 Trend Bias: ✅ Bullish
Short-term momentum favors the bulls with sectoral tailwinds from PSU + Defense themes.
________________________________________________________________________________
📌 What’s Catching Our Eye:
• W-Bottom Pattern nearing breakout
• Price reclaimed key demand zone and consolidating just below resistance
• PSU + Defense theme rally adds sector momentum
________________________________________________________________________________
👀 What We’re Watching For:
• Breakout Confirmation: Daily close above 3396 with 3.5M+ volume
• Pullback Re-entry: Ideal zone 3300–3310 for fresh entries
• Volume Spike: Key trigger for breakout validation
________________________________________________________________________________
⚠️ Risks to Watch:
• Low volume breakout = Bull trap risk
• Sector rotation or sudden weakness in PSU/Defense
• Breakdown below 3240 = pattern failure & shift in bias
________________________________________________________________________________
🔮 What to Expect Next:
• ⚡ Retest of 3362–3396 range likely
• 🔄 Minor consolidation / handle formation possible
• 🔄 Watch for volatility near resistance (intraday fakeouts)
________________________________________________________________________________
📊 Trade Plan (Based on Logic + Volume Confirmation)
🔼 Breakout Long Setup:
• Entry: Above 3369
• Stop Loss: 3300
• Risk–Reward: ~1:1 to 1:2
📌 Why:
• W-bottom breakout
• Sector strength + price structure alignment
• Volume >3.5M is the key trigger
________________________________________________________________________________
🔁 Pullback Long Setup:
• Entry Zone: 3305–3310
• Stop Loss: 3240 (Support 3)
• Risk–Reward: ~1:1 to 1:2
📌 Why:
• Tight SL near structure
• Good risk-reward for early entry
________________________________________________________________________________
🔽 Bearish Setup (Rejection from Resistance):
• Entry: Below 3300
• Stop Loss: Above 3365
• Risk–Reward: ~Flexible — as per individual trader's strategy and risk appetite
📌 Why:
• Rejection from neckline
• Low-volume breakout = trap
• Breakdown below support shifts structure to bearish
________________________________________________________________________________
❌ Invalidation Triggers:
• Daily Close below 3240
• Bearish Marubozu with volume = shift to supply pressure
________________________________________________________________________________
📌 Intraday Supply Zones Noted (15-Min Chart):
The 15-minute chart reveals the presence of multiple intraday supply zones, indicating short-term selling pressure.
🟥 Tested Supply Zone: 3337.30 – 3346.30 | SL: 3352.20
🟥 Strong Supply Zone: 3349.40 – 3358.60 | SL: 3364.50
These zones may act as resistance levels for intraday traders. Watch for price rejection or confirmation candles in these areas before planning any breakout trades.
________________________________________________________________________________
⚠️ Disclaimer:
This analysis is for educational purposes only.
STWP is not a SEBI-registered advisor.
No buy/sell recommendations are made.
Please consult your financial advisor before trading.
STWP is not responsible for trading decisions based on this post.
________________________________________________________________________________
💬 Found this helpful?
Have you caught this W-pattern early?
Share your thoughts in the comments ⬇️
🔁 Spread the insight with fellow traders
✅ Follow STWP for smart technical setups backed by volume and price action
🚀 Let’s trade with patience, logic, and clarity!
Be Self-Reliant | Trade with Patience | Learn with Logic
________________________________________________________________________________
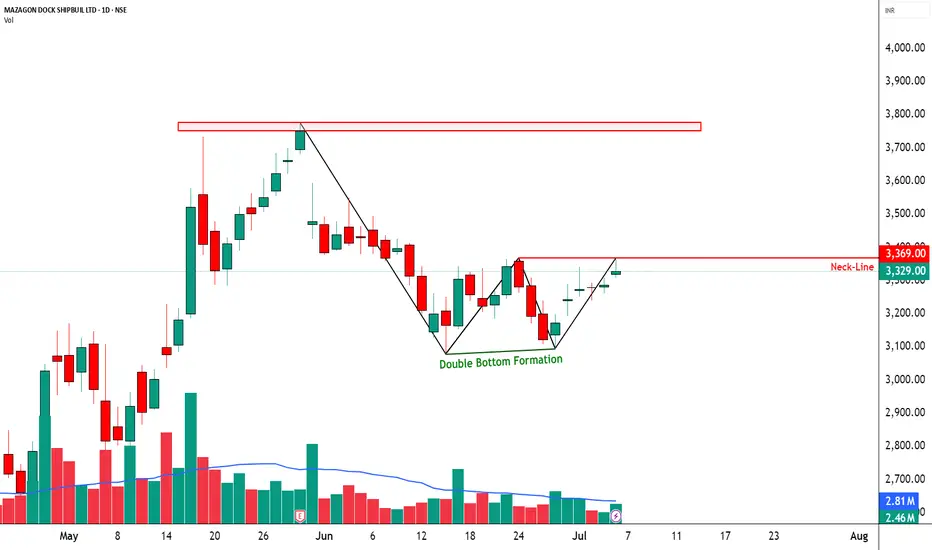
UNITED BREWERIES LTD. (UBL) – Bullish Setup from Demand Zone📈 UNITED BREWERIES LTD. (UBL) – Bullish Setup from Demand Zone | Price Action + Volume Analysis
🕒 Chart Type: Daily
📆 Date: July 3, 2025
🔍 What’s Catching Our Eye:
UBL has printed a strong bullish engulfing candle from the bottom range of ₹1,848, a zone that has historically acted as demand support. This move is happening after multiple tight sessions, suggesting potential breakout energy. While the candle shows strength, volume is unusually low, indicating the need for confirmation before high-conviction entries.
📊 Volume Footprint:
Despite the bullish candle, volume is not supportive. The breakout attempt lacks wide participation. This could either be a low-volume trap or a smart money accumulation zone. Look for a follow-up candle with higher volume for confirmation.
🧠 Technical Outlook & Trade Reasoning:
UBL has rebounded from its demand zone with a textbook bullish engulfing. Price action suggests momentum may follow, but the lack of volume signals a need for patience. Ideal scenario would be a high-volume green candle in the next session for breakout confirmation.
If volume picks up, swing traders can look for entries near ₹1,985–1,995, keeping SL at ₹1,922, and targeting ₹2,080–2,150 in the short term. A sustained move toward ₹2,300 is possible only if the intermediate zones are taken out with strength.
📌 Current Setup Details:
Entry Level: ₹1,988.00
Stop-Loss (SL): ₹1,922.20 (Risk per share: ₹65.80)
Master Level Confidence: 89.91% (as per STWP system)
⚠️ Invalidation Levels:
Close below ₹1,922 (SL level)
Breakdown below ₹1,848 (Demand Zone) on high volume
⚠️ Disclaimer:
This analysis is shared for educational and informational purposes only.
STWP is not a SEBI-registered advisor.
This is not a buy/sell recommendation.
Always consult your financial advisor before making investment decisions.
💬 Found this helpful?
Share your thoughts in the comments ⬇️
🔁 Spread the insight with fellow traders
✅ Follow STWP for smart technical setups backed by volume and price action
🚀 Let’s trade with patience, logic, and clarity!
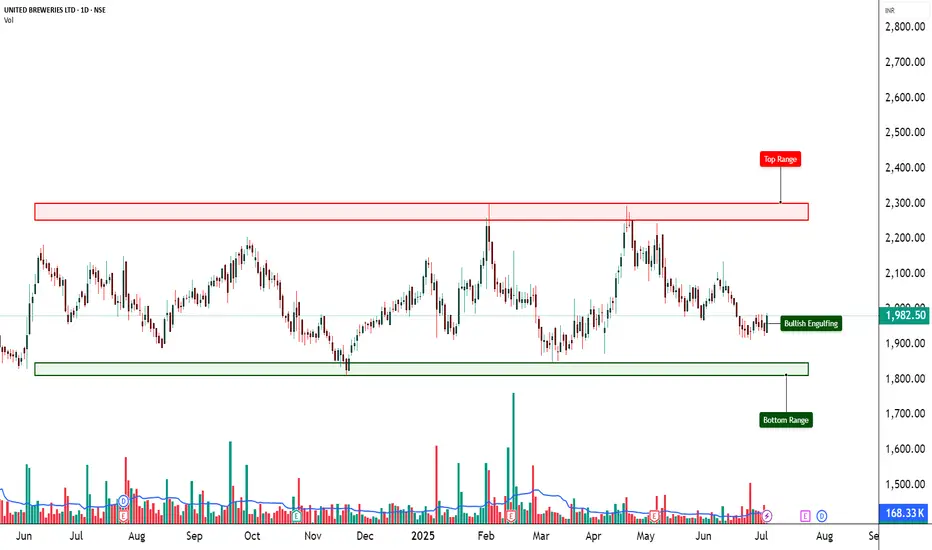
RELIANCE – Trapped Between Strikes📈 RELIANCE – Trapped Between Strikes | Option Chain + Price Action Insights
🕒 Chart Type: 15-Minute
📆 Date: July 3, 2025
________________________________________
🔍 What’s Catching Our Eye:
RELIANCE is hovering just above ₹1,517.8 and facing resistance from rising short positions on Calls across 1540–1580 levels. Despite minor short covering at the 1500 and 1520 CEs, fresh Short Build-Up is visible across most strikes, suggesting upward moves are being capped. On the flip side, Puts between 1500–1530 are also witnessing Short Build-Up, indicating traders aren't expecting a major breakdown either.
________________________________________
📌 What We’re Watching For:
RELIANCE appears range-bound, and clear directional strength is missing. Price needs to decisively break above ₹1,540 for bullish strength to materialize. On the downside, support exists around ₹1,500, but if that breaks, expect pressure to mount quickly.
________________________________________
📊 Volume Footprint:
Heavy volume on both sides:
• 13k+ contracts at 1520 CE
• 11k+ contracts at 1600 CE
• Over 9k contracts traded at 1500–1530 PE
→ Traders are actively betting on both sides, suggesting volatility ahead.
________________________________________
📈 Option Chain Highlights:
• Call Side:
o 1530 CE → Long Build-Up (+2.45% OI)
o 1540 CE → Long Build-Up (+2.45%)
o 1550–1580 CE → Short Build-Up, signaling resistance buildup
o 1520 CE → Short Covering
• Put Side:
o 1500–1530 PE → Short Build-Up, hinting at base support around 1500
Inference: The tug-of-war is real. Calls are being written at higher strikes while Puts are being sold at lower strikes. That creates a tight range of ₹1,500–1,540, with traders unsure of breakout direction.
________________________________________
🔁 Trend Bias:
🟡 Neutral to Slightly Bullish – Only if ₹1,540 is reclaimed with volume
________________________________________
🧠 Trade Logic / Reasoning:
Price is squeezed between the ₹1,500 Put writers and ₹1,540+ Call writers. This is a textbook “compression zone” where a breakout or breakdown may soon follow. If bulls want control, they must push above ₹1,540 with volume and follow-through. Else, expect the sideways to weak bias to continue.
________________________________________
📍 Important Levels to Mark:
🔺 Top Range (Resistance): ₹1,540 – Break & sustain needed for upside
🔻 Bottom Range (Support): ₹1,500 – Breakdown will shift sentiment bearish
________________________________________
🎯 Trade Plan (Educational Purpose Only):
✅ Best Buy (Equity): Only above ₹1,540 with confirmation
✅ Best Sell (Equity): If price breaks below ₹1,500
✅ Best CE to Long: 1530 CE – Strong long build-up with good delta
✅ Best PE to Long: Avoid – PE sellers still active; no breakdown confirmed
🟢 Demand Zone: NA
🔴 Supply Zone: NA
⚠️ Invalidation Below:
Bullish view invalid if price fails at ₹1,540 or slips below ₹1,500 with volume
________________________________________
⚠️ Disclaimer:
This analysis is for educational purposes only.
STWP is not a SEBI-registered advisor.
No buy/sell recommendations are made.
Please consult your financial advisor before trading.
STWP is not responsible for any trading decisions based on this content.
________________________________________
💬 Found this helpful?
Drop your feedback in the comments ⬇️
🔁 Share with traders who track RELIANCE
✅ Follow STWP for consistent zone + option chain insights
🚀 Let’s trade smart, with patience and clarity!

DMART – Mixed Signals with Option Chain Clues________________________________________________________________________________📈 DMART – Mixed Signals with Option Chain Clues | Option Chain + Price Action Analysis
🕒 Chart Type: 15-Minute
📆 Date: July 3, 2025
________________________________________________________________________________
🔍 What’s Catching Our Eye:
DMART is displaying notable volatility near its technical range. While the option chain reveals contrasting setups across strikes—with several Calls showing short build-ups and some Puts indicating long build-ups—the overall price action remains undecided. The current equity price (spot at 4348.70) is being carefully watched in relation to its normalized chart range.
________________________________________________________________________________
📌 What We’re Watching For:
We’re monitoring for a decisive move beyond the established range. A sustained move above the Top Range of 2464.4 (normalized chart level) could validate a bullish reversal; conversely, a breakdown below the Bottom Range of 2326.1 might trigger a bearish slide. Given the option chain dynamics, any clear directional breakout—supported by volume—will be key to shaping our view.
________________________________________________________________________________
📊 Volume Footprint:
Today’s volume is recorded at 1.83M, significantly higher than the previous 836.47k, indicating an active session. A continued high volume reading on a breakout or breakdown from our range will be critical for confirmation.
________________________________________________________________________________
📈 Option Chain Highlights:
• On the Call side, the 4,500 CE and 4,300 CE are showing strong short build-ups, while the 4,400 CE stands out with a long build-up—hinting at an emerging bullish bias if the price rallies. Additionally, the 4,600 CE continues to exhibit short build-up pressure.
• On the Put side, the 4,200 PE displays a strong long build-up, suggesting downside protection, and the 4,000 PE also shows long build-up. A notable short covering is observed in the 4,300 PE and the 4,250 PE shows additional long build-up.
These option-chain cues—combined with the volatility in the underlying—highlight the market’s mixed expectations.
________________________________________________________________________________
🔁 Trend Bias:
The bias remains directionally dependent—bullish if a reversal above the top range is confirmed, or bearish if the price falls below the bottom range.
________________________________________________________________________________
🧠 Trade Logic / Reasoning:
DMART’s price action is teetering near its critical range. The normalized technical levels (Top Range: 2464.4, Bottom Range: 2326.1) serve as key decision zones. On the options side, the presence of long build-up in the 4,400 CE suggests that, if the price reverses, buyers could step in. In contrast, the strong long build-up on the 4,200 PE underlines the protective positions if the price breaks lower. With a higher session volume amplifying the move’s significance, caution is warranted until a clear breakout or breakdown occurs.
________________________________________________________________________________
📍 Important Levels to Mark:
🔺 Top Range: 2464.4 – Look for a breakout or a reversal candlestick pattern with confirmatory volume
🔻 Bottom Range: 2326.1 – Watch for a breakdown or a bullish reversal pattern with volume support
________________________________________________________________________________
🎯 Trade Plan (Educational Purpose Only):
✅ Best Buy (Equity): Enter long on DMART if a robust bullish reversal is confirmed—ideally when the price reclaims above the top range (2464.4) with strong volume and supportive candlestick action.
✅ Best Sell (Equity): Take short positions if the price decisively breaks and holds below the bottom range (2326.1) on high volume.
✅ Best CE to Long: Opt for the 4,400 CE when the reversal is underway; its long build-up in the option chain signals the initiation of bullish interest.
✅ Best PE to Long: In a bearish scenario, consider the 4,200 PE—its long build-up indicates traders are positioning for a downside move.
🟢 Demand Zone: NA
🔴 Supply Zone: NA
⚠️ Invalidation Below:
Any bullish setup becomes invalid if DMART breaks and holds below the bottom range of 2326.1 (normalized level) with strong volume.
________________________________________________________________________________
⚠️ Disclaimer:
This post is for educational purposes only.
STWP is not a SEBI-registered advisor.
This is not a buy/sell recommendation.
Please consult your financial advisor before trading.
STWP is not responsible for any trading outcomes.
________________________________________________________________________________
💬 Found this helpful?
Drop your thoughts in the comments ⬇️
🔁 Share with fellow traders
✅ Follow STWP for zone-based price action & option chain insights
🚀 Let’s boost awareness of smart & patient trading!
________________________________________________________________________________
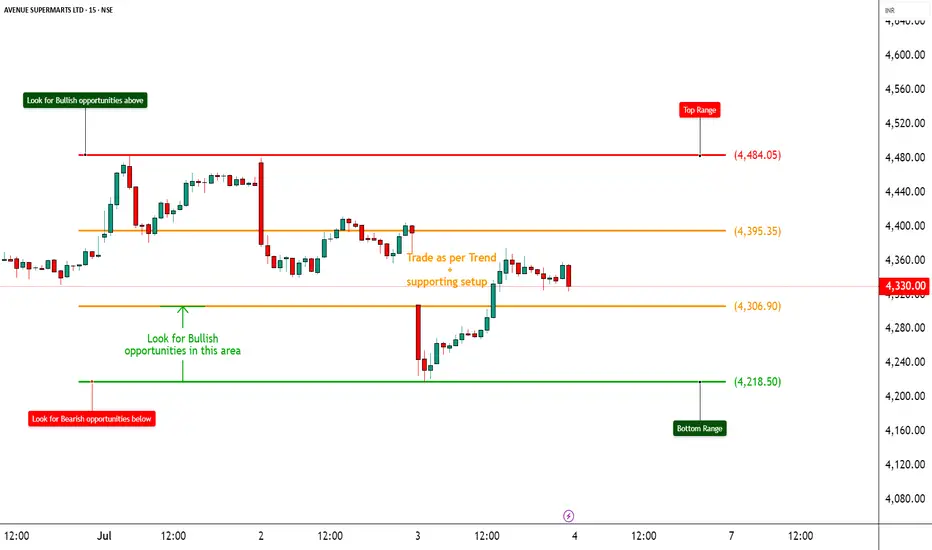
NIFTY – Range-Bound but Bearish Tilt Emerging📈 NIFTY – Range-Bound but Bearish Tilt Emerging | Option Chain + Price Action Analysis
🕒 Chart Type: 15-Minute
📆 Date: July 3, 2025
________________________________________
🔍 What’s Catching Our Eye:
NIFTY closed at ₹25,397.40, hugging the key support zone at ₹25,378. The index remains inside a well-defined range, but the sharp rejection from the ₹25,490–₹25,509 supply zone highlights sustained selling pressure. The failure to reclaim ₹25,455 signals caution from buyers.
________________________________________
📌 What We’re Watching For:
The ₹25,378 level is crucial. A breakdown below it with volume could ignite fast momentum towards ₹25,300–₹25,250. On the other side, a bullish reversal setup is only valid if NIFTY reclaims ₹25,455 with a strong candle and high volume. Option data tilts clearly bearish, showing confidence from institutions—not speculation.
________________________________________
📊 Volume Footprint:
Current volume stands at 293.43M, lower than the previous session’s 330.09M, indicating reduced participation and indecision. Watch for a volume spike below ₹25,378 (for breakdown confirmation) or above ₹25,455 (to validate reversal strength).
________________________________________
📈 Option Chain Highlights:
The 25,500 CE shows heavy short build-up, with OI sharply higher—clear sign of strong resistance. The 25,600 CE adds to that pressure with additional short positions. Meanwhile, 25,400 PE is witnessing long build-up, and strong OI in 25,000 PE shows downside anticipation. Overall, OI positioning strongly supports a bearish view.
________________________________________
🔁 Trend Bias:
🔴 Bearish unless NIFTY reclaims and sustains above ₹25,455
________________________________________
🧠 Trade Logic / Reasoning:
Price remains in a supply-driven setup, with a sharp rejection seen from ₹25,490–₹25,509. Support at ₹25,378 has held so far but looks increasingly fragile. Option chain behaviour reinforces this bearish bias—Call writers dominating higher levels and Put buyers building exposure at lower strikes.
________________________________________
📍 Important Levels to Mark:
🔺 Top Range: ₹25,608 – Look for breakout or reversal candlestick pattern + volume
🔻 Bottom Range: ₹25,378 – Watch for breakdown or bullish reversal pattern + volume
________________________________________
🎯 Trade Plan (Educational Purpose Only):
✅ Best Sell: Long - 25,400 PE – If breakdown below ₹25,378 confirms with volume
✅ Best Buy: Long 25,300 CE if price reclaims ₹25,455 + ₹25,490 zone with a strong bullish candle + volume
🟢 Demand Zone: NA
🔴 Supply Zone: ₹25,490–₹25,509 (Confirmed rejection area)
⚠️ Invalidation Below:
Bullish view becomes invalid if NIFTY breaks and holds below ₹25,378 with strong volume
Bearish view loses strength if NIFTY reclaims ₹25,455 with follow-through
________________________________________
⚠️ Disclaimer:
This post is for educational purposes only.
STWP is not a SEBI-registered advisor.
This is not a buy/sell recommendation.
Please consult your financial advisor before trading.
STWP is not responsible for any trading outcomes.
________________________________________
💬 Found this helpful?
Drop your thoughts in the comments ⬇️
🔁 Share with fellow traders
✅ Follow STWP for zone-based price action & option chain insights
🚀 Let’s boost awareness of smart & patient trading!
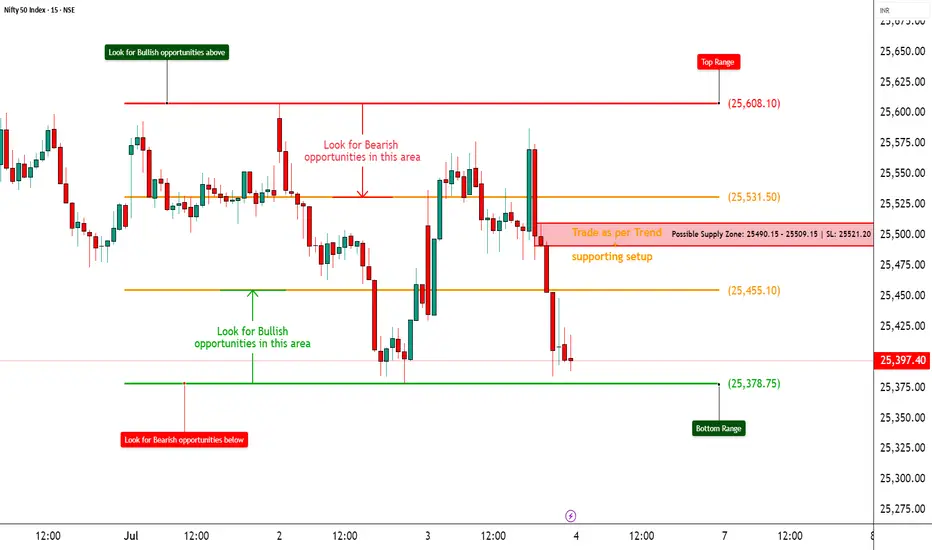
BANKNIFTY – On the Edge of Breakdown📈 BANKNIFTY – On the Edge of Breakdown | Option Chain + Price Action Analysis
🕒 Chart Type: 15-Minute
📆 Date: July 3, 2025
🔍 What’s Catching Our Eye:
BANKNIFTY is sitting dangerously close to the ₹56,770 support zone, which has been tested multiple times. Price action remains weak, and failure to bounce indicates rising pressure on this level.
📌 What We’re Watching For:
We’re closely monitoring the price action near ₹56,770 — a breakdown below this key level could trigger a sharp pick-up in bearish momentum. On the flip side, any meaningful reversal setup will only be considered valid if BANKNIFTY reclaims ₹57,100 with a strong bullish candlestick supported by volume. As of now, the option chain data continues to heavily favor the bears, offering more confirmation than speculation for a potential downside move.
📊 Volume Footprint:
The current volume stands at 149.89M, slightly lower than the previous session’s 162.75M, indicating a mild drop in participation. This suggests that traders are in a wait-and-watch mode. A sharp surge in volume—especially on a move below ₹56,770—could validate a breakdown and trigger momentum on the downside.
📈 Option Chain Highlights:
The 57000 PE is showing a strong long build-up, signaling that traders are positioning for further downside. On the other hand, the 57000 CE has witnessed a heavy short build-up, reinforcing the bearish sentiment. Additionally, lower strike PEs between 56700 and 56900 are also displaying long build-up, further confirming downside pressure. Meanwhile, Call OI is increasing at higher strikes, indicating that resistance is likely forming in the 56900–57200 range.
🔁 Trend Bias:
🔴 Bearish unless we reclaim and sustain above ₹57,100 with confirmation
🧠 Trade Logic / Reasoning:
There is a visible and well-established supply zone between ₹57,400 and ₹57,600, which has consistently capped upside attempts. On the downside, the ₹56,770 support is showing signs of exhaustion due to repeated tests. Derivative data continues to favor the sellers, with strong bearish positioning in the option chain. As there is no visible sign of a reversal yet, it's prudent to remain cautious on taking any premature long positions.
📍 Important Levels to Mark:
🔺 Top Range: 57,600 - Look for breakout or reversal candlestick pattern + volume
🔻 Bottom Range: 56,770 - Watch for breakdown or bullish reversal pattern + volume
🎯 Trade Plan (Educational Purpose Only):
✅ Best Sell: 57000 PE – Long Build-Up present, indicating institutional downside play
✅ Best Buy: 56500 CE – if reversal above 57,100 is confirmed with price action
🟢 Demand Zone: NA
🔴 Supply Zone: NA
⚠️ Invalidation Below:
Any bullish view becomes invalid if BANKNIFTY breaks and holds below 56,750 with high volume
⚠️ Disclaimer:
This post is for educational purposes only.
STWP is not a SEBI-registered advisor.
This is not a buy/sell recommendation.
Please consult your financial advisor before trading.
STWP is not responsible for any trading outcomes.
💬 Found this helpful?
Drop your thoughts in the comments ⬇️
🔁 Share with fellow traders
✅ Follow STWP for zone-based price action & option chain insights
🚀 Let’s boost awareness of smart & patient trading!