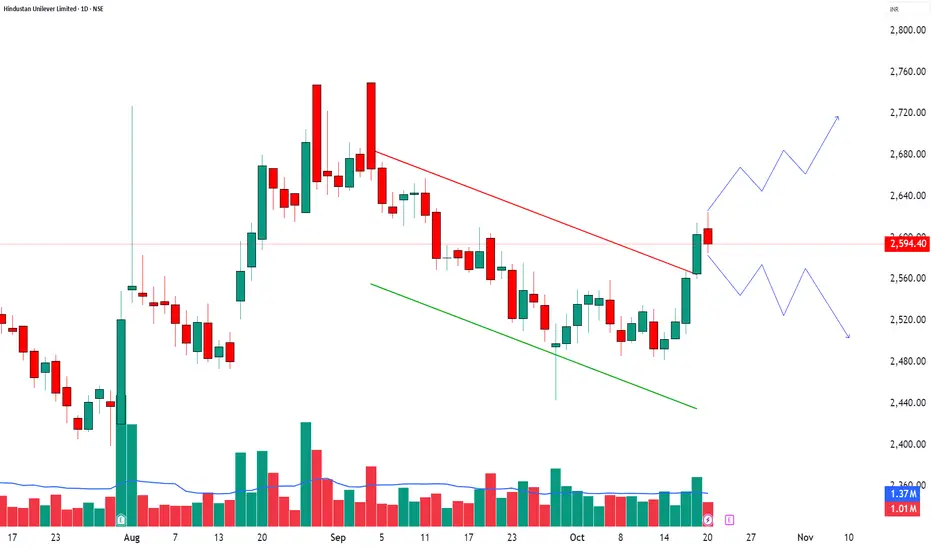
HINDUNILVR – Bulls Resting, Bears Watching💹 Hindustan Unilever Ltd (NSE: HINDUNILVR)
Sector: FMCG | CMP: ₹2,610.80 | View: Neutral-to-Bullish Zone Reaction Setup
Key Levels:
Resistance: 2618/2641/2657
Support: 2578/2562/2539
STWP Trade Analysis:
A Retested Demand zone: 2509.20 – 2482.30
Stock has moved up almost 4% in the last 4 days.
The bulls seem to have taken a rest at these levels.
Two possible scenarios:
🟢 Scenario 1 – Bulls Take Charge: I will buy @ 2624.70 with a stop at around 2583.45
View: Bullish continuation setup if price sustains above 2620 zone.
🔴 Scenario 2 – Bears Take Charge: I will sell at 2585.60 with a stop at around 2626.85
View: Reversal setup if price fails to hold above 2618 and selling pressure builds.
───────────────────────────────────────────────
⚠️ **DISCLOSURE & DISCLAIMER (SEBI-Compliant)**
───────────────────────────────────────────────
📘 **Purpose:**
This content is created **solely for educational and informational purposes** to help readers understand market structure, price action, and technical analysis.
It does **not constitute investment advice**, research recommendation, or a solicitation to buy or sell any security.
👤 **Author Disclosure:**
The author is **not a SEBI-registered investment adviser or research analyst.**
All chart studies, price levels, and observations are based on publicly available data (e.g., **NSE India**, **TradingView**) and are presented purely for **learning illustration**.
📊 **Position Status:**
No active position in * * at the time of publication.
“The author may sometimes trade in the securities discussed, but such trades are independent and shared here only for educational understanding.”
⚠️ **Risk Disclosure:**
Trading and investing involve financial risk. Market movements can be unpredictable, and losses may exceed invested capital.
Readers are strongly advised to consult a **SEBI-registered investment adviser** before making any trading or investment decisions.
🧠 **Responsibility Clause:**
By engaging with this post, you acknowledge that you are **solely responsible for your own trading or investment decisions**, and that this content is intended only for **market education and awareness**.
───────────────────────────────────────────────
💬 **Did You Find This Useful?**
If this analysis helped you understand price structure or market psychology better:
🔼 **Boost** to support transparent & structured financial education.
✍️ **Comment** your insights, observations, or questions — let’s learn together.
🔁 **Share** this post with learners and aspiring traders who value discipline.
📚 **Follow stwp** for more structured, educational breakdowns on stocks & setups.
🚀 *Stay Calm. Stay Clean. Trade With Patience.*
💡 *Trade Smart | Learn Zones | Be Self-Reliant.*
───────────────────────────────────────────────
Learntotradethemarket
Demat & Trading AccountsIntroduction
If you want to invest in the stock market or hold securities in India, two terms you will always come across are Demat Account and Trading Account. These two accounts are like the backbone of modern investing. Without them, buying and selling shares in today’s electronic stock market would be nearly impossible.
Earlier, shares were held in physical form (paper certificates). If you wanted to buy or sell, you had to physically deliver these certificates to the buyer or to the exchange. This process was time-consuming, risky (due to frauds, fake certificates, theft, or loss), and created unnecessary delays. To solve this, India adopted the system of dematerialization (demat) in the 1990s.
Today, all trades in the stock market happen online using these two accounts:
Demat Account → for holding securities electronically.
Trading Account → for buying and selling them through the stock exchange.
This write-up will explore both accounts in detail, explain their importance, features, working, types, and practical role in the Indian stock market.
1. Understanding the Basics
1.1 What is a Demat Account?
A Demat Account (short for Dematerialized Account) is an account that holds your shares, bonds, mutual funds, ETFs, and other securities in electronic format.
Think of it like a bank account, but instead of holding money, it holds your financial securities. When you buy shares, they get credited to your Demat Account. When you sell, they get debited.
Example: If you buy 100 shares of Infosys, instead of getting paper certificates, these 100 shares are electronically stored in your Demat Account.
In India, Demat Accounts are maintained by Depositories:
NSDL (National Securities Depository Limited)
CDSL (Central Depository Services Limited)
These depositories hold securities, while intermediaries called Depository Participants (DPs) (like banks, brokers, or financial institutions) give investors access to open and manage accounts.
1.2 What is a Trading Account?
A Trading Account is an account that allows you to place buy or sell orders in the stock market.
You cannot directly go to NSE or BSE to buy stocks. You need a broker who provides you with a Trading Account.
Through this account, you send orders (like “Buy 10 shares of TCS at ₹3500”) which get executed on the stock exchange.
In simple words:
Trading Account = Interface between you and the stock exchange.
Demat Account = Storage for your securities.
1.3 How Demat & Trading Accounts Work Together
Both accounts are interconnected. Here’s the flow of a transaction:
You place a buy order via your Trading Account.
Money gets debited from your Bank Account.
Shares are transferred into your Demat Account.
Similarly, when you sell shares:
You place a sell order in the Trading Account.
Shares get debited from your Demat Account.
Money gets credited into your Bank Account.
Thus, three accounts are linked:
Bank Account (funds)
Trading Account (market transactions)
Demat Account (holdings)
2. History & Evolution in India
2.1 Before Demat Accounts
Shares were issued in physical form.
Transfer of ownership required endorsement and physical delivery.
Problems: Fake certificates, theft, delays in settlement, bad deliveries.
2.2 Introduction of Demat System
1996: India introduced Dematerialization under SEBI regulation.
First electronic trade took place with NSDL as the main depository.
Later, CDSL was established.
Today, more than 99% of trades in India happen in electronic form.
3. Features of Demat Account
Paperless Holding – No physical certificates, only electronic form.
Multiple Securities – Can hold shares, bonds, ETFs, government securities, mutual funds, etc.
Easy Transfer – Quick transfer of shares during buying/selling.
Safety – Reduces risk of theft, forgery, and loss.
Nomination Facility – You can nominate someone to inherit your securities.
Corporate Benefits – Dividends, bonuses, stock splits, and rights issues are automatically credited.
Accessibility – Can be accessed via online platforms, mobile apps, or brokers.
4. Features of Trading Account
Market Access – Enables buying/selling on NSE, BSE, MCX, etc.
Multiple Segments – Can trade in equity, derivatives (F&O), commodities, and currencies.
Order Types – Market order, limit order, stop-loss order, etc.
Leverage/Margin Trading – Allows intraday and margin trading.
Technology Driven – Mobile apps, algo-trading, advanced charts.
Real-Time Updates – Live prices, executed trades, P&L statements.
5. Types of Demat Accounts
Regular Demat Account – For Indian residents to hold securities.
Repatriable Demat Account – For NRIs, linked with NRE bank account.
Non-Repatriable Demat Account – For NRIs, linked with NRO bank account.
Basic Services Demat Account (BSDA) – For small investors, with low charges.
Corporate Demat Account – For companies and institutions.
6. Types of Trading Accounts
Equity Trading Account – For stocks and equity derivatives.
Commodity Trading Account – For commodities (gold, oil, agricultural products).
Currency Trading Account – For forex trading.
Derivatives Trading Account – For futures and options.
Discount Brokerage Account – For low-cost trading, minimal services.
Full-Service Brokerage Account – With advisory, research, and premium services.
7. Process of Opening Accounts
7.1 Opening a Demat Account
Steps:
Choose a Depository Participant (DP) (bank, broker, NBFC).
Fill application form (KYC).
Submit documents (Aadhar, PAN, photo, bank proof).
Sign agreement with DP.
Get your Demat Account Number (DP ID + Client ID).
7.2 Opening a Trading Account
Steps:
Choose a broker (full-service or discount).
Fill KYC & account opening form.
Link Bank Account and Demat Account.
Get Login ID & Password for online trading.
8. Charges & Costs
Demat Account Charges
Account Opening Fee (some brokers offer free).
Annual Maintenance Charges (AMC).
Transaction Charges (per debit).
Custodian Fee (rare now).
Trading Account Charges
Brokerage Fee (flat fee or percentage).
Transaction Charges (exchange fee).
Securities Transaction Tax (STT).
SEBI Turnover Fees.
GST & Stamp Duty.
9. Advantages of Demat & Trading Accounts
Convenience – Buy/sell in seconds from anywhere.
Safety – No risk of fake/lost certificates.
Transparency – Easy tracking of holdings & trades.
Liquidity – Quick conversion of investments into cash.
Integration – Bank, trading, and demat are linked.
Corporate Benefits – Automatic credit of dividends/bonus.
Access to Multiple Markets – Equity, commodity, currency, derivatives.
10. Risks & Limitations
Technical Failures – System downtime can block trades.
Fraud Risks – If login/password is misused.
Charges – Brokerage and maintenance fees can reduce profits.
Overtrading – Easy access may tempt frequent trading, leading to losses.
Cybersecurity Threats – Hacking of accounts.
11. Role of Demat & Trading Accounts in Indian Stock Market
Helped India move from paper-based to electronic system.
Improved market efficiency and liquidity.
Attracted more retail investors with easy digital access.
Essential for IPOs (Initial Public Offerings) – shares are credited only in Demat form.
Integrated with apps & online platforms (Zerodha, Upstox, Angel One, ICICI Direct, HDFC Securities, etc.).
12. Practical Example
Suppose you want to invest in Reliance Industries:
You log in to your Trading Account and place a buy order for 50 shares.
Money is deducted from your Bank Account.
After settlement (T+1 day), 50 shares appear in your Demat Account.
Later, when Reliance declares a dividend, the amount is directly credited to your Bank Account.
If Reliance issues bonus shares, they are automatically credited to your Demat Account.
This shows the smooth link between all three accounts.
13. Future of Demat & Trading Accounts in India
More digital integration with UPI, AI-based advisory, and robo-trading.
Growth in retail participation due to mobile apps.
Expansion of commodity and global investing options.
Reduced charges with increasing competition among brokers.
Enhanced cybersecurity measures for safer trading.
Conclusion
Demat and Trading Accounts have revolutionized the Indian stock market. They replaced the old paper-based system, making investing faster, safer, and more efficient.
A Demat Account stores your securities.
A Trading Account lets you buy/sell them on exchanges.
Together, they act as the gateway for every investor to participate in the financial markets.
Whether you are a beginner or an experienced trader, understanding these two accounts is the first step toward wealth creation through the stock market.
Part 2 Trading Master ClassPsychology of Options Trading
Discipline and patience are crucial. Many beginners lose money because they:
Over-leverage.
Ignore volatility.
Fail to manage positions.
Professional traders rely on data-driven strategies, not emotions.
Conclusion
Options trading strategies are powerful tools that allow traders to tailor risk and reward according to their outlook. From simple long calls and puts to complex spreads and condors, each strategy has its place in the trader’s toolkit. The key is to understand market conditions, implied volatility, and risk tolerance.
In essence, options trading is like a chess game in the financial markets—requiring foresight, planning, and strategic execution. Traders who master options can generate income, hedge portfolios, and take advantage of unique opportunities that stocks alone cannot offer.
Why Use Options?
Options provide traders with:
Leverage: Control a large position with a smaller investment.
Flexibility: Create strategies for any market scenario.
Risk Management: Hedge against adverse price movements.
Income Generation: Sell options to collect premium.

Part 1 Trading Master ClassReal-World Applications of Options
Hedging
Institutions hedge portfolios using index options. For example, buying Nifty puts to protect against market crash.
Income Generation
Funds sell covered calls or iron condors to earn steady income.
Event-Based Trading
Earnings announcements, policy changes, and global events cause volatility—ideal for straddles or strangles.
Speculation with Leverage
Traders use calls/puts for leveraged bets on short-term moves.
Pros and Cons of Options Trading
Pros
Flexibility in strategy.
Limited risk (for buyers).
High leverage.
Ability to profit in all market conditions.
Cons
Complexity.
Time decay erodes value of options.
Volatility risk.
Unlimited risk (for sellers).

Futures & Options (F&O) TradingIntroduction
Futures and Options (commonly known as F&O) are among the most exciting segments of financial markets. They fall under the category of derivatives trading, meaning their value is derived from an underlying asset such as stocks, commodities, currencies, or indices.
Unlike simple buying and selling of shares, F&O trading allows investors to hedge risks, speculate on price movements, and even leverage small capital into big trades. However, it also carries high risk and requires deep understanding.
This guide will cover:
What F&O trading is
How futures work
How options work
Key terms
Strategies used
Advantages & risks
Practical examples
Psychology of F&O trading
Regulations in India
Final thoughts for beginners
By the end, you’ll have a solid foundation in F&O trading.
Part 1: Understanding Derivatives
What are Derivatives?
A derivative is a financial contract whose value depends on the price of an underlying asset. For example, if you buy a derivative linked to Reliance Industries stock, its value will move as Reliance’s stock price moves.
Derivatives can be of many types:
Futures
Options
Forwards
Swaps
In India, the most popular are Futures and Options (F&O).
Part 2: Futures Trading
What are Futures?
A futures contract is an agreement between two parties to buy or sell an asset at a predetermined price on a future date.
Buyer of futures: Agrees to buy the asset in future.
Seller of futures: Agrees to sell the asset in future.
Both are obligated to honor the contract on expiry.
Key Features of Futures:
Standardized contracts – traded on exchanges (like NSE, BSE).
Leverage – You pay only a margin (a fraction of total value).
Settlement – Can be cash-settled or delivery-based.
Expiry dates – Futures have fixed expiry (weekly, monthly, quarterly).
Example of Futures:
Suppose Reliance stock is trading at ₹2,500.
You buy a Reliance Futures contract (lot size 250 shares).
Contract value = ₹2,500 × 250 = ₹6,25,000.
But you don’t pay full amount, only margin (say 15% = ₹93,750).
If Reliance rises to ₹2,600, your profit = (100 × 250) = ₹25,000.
If Reliance falls to ₹2,400, your loss = ₹25,000.
So, futures magnify both profit and loss.
Part 3: Options Trading
What are Options?
Options are more flexible than futures. An option gives the buyer the right, but not the obligation, to buy or sell the underlying asset at a fixed price on or before expiry.
There are two types of options:
Call Option (CE): Right to buy.
Put Option (PE): Right to sell.
Key Terms in Options:
Strike Price: Pre-decided price at which option can be exercised.
Premium: Price paid by buyer to seller of option.
Option Buyer: Has rights, limited risk (loss = premium).
Option Seller (Writer): Has obligation, unlimited risk but limited profit (premium received).
Example of Call Option:
Reliance at ₹2,500.
You buy a Call Option (CE) 2600 strike, expiring in 1 month, paying ₹20 premium.
Lot size = 250. Total premium paid = ₹5,000.
If Reliance goes to ₹2,700 before expiry:
Option value = ₹100 (intrinsic value).
Profit = (100 - 20) × 250 = ₹20,000.
If Reliance stays below ₹2,600, option expires worthless.
Loss = only premium paid (₹5,000).
So, options limit risk for buyers but sellers face higher risk.
Part 4: Comparison – Futures vs Options
Feature Futures Options
Obligation Buyer & seller both obligated Buyer has right, seller has obligation
Risk High (both sides) Limited for buyer, unlimited for seller
Cost Margin required Premium required
Profit Potential Unlimited both ways Unlimited for buyer, limited for seller
Best for Speculation & hedging Hedging, speculation, income strategies
Part 5: Why Trade F&O?
1. Hedging
Investors use F&O to protect portfolios from adverse price movements.
Example: An investor holding Reliance shares can buy a Put Option to protect against downside.
2. Speculation
Traders use leverage to bet on market movements.
3. Arbitrage
Taking advantage of price differences between cash market and F&O.
4. Income Generation
Selling (writing) options to earn premium.
Part 6: Important Concepts in F&O
Leverage & Margin – You control large value with small capital.
Mark-to-Market (MTM) – Futures contracts are settled daily.
Time Decay (Theta) – Options lose value as expiry nears.
Implied Volatility (IV) – Measures expected price swings.
Greeks in Options – Delta, Gamma, Vega, Theta, Rho – help manage risk.
Part 7: Common F&O Strategies
Futures Strategies:
Long Futures – Buy if you expect rise.
Short Futures – Sell if you expect fall.
Options Strategies:
Covered Call – Hold stock + sell call.
Protective Put – Hold stock + buy put (insurance).
Straddle – Buy call + buy put (expect big move).
Strangle – Buy out-of-money call & put.
Iron Condor – Combination to earn premium in sideways market.
Part 8: Risks in F&O Trading
High Leverage Risk – Small moves can wipe out capital.
Time Decay in Options – Value erodes with time.
Volatility Risk – Sudden moves may cause losses.
Liquidity Risk – Some contracts have low trading volume.
Psychological Pressure – High stress and emotions.
Part 9: F&O in India
Introduced in 2000 (NSE).
Most popular: Index Futures & Options (Nifty, Bank Nifty).
Also available: Stock futures, stock options, currency derivatives, commodity derivatives.
Regulated by SEBI (Securities and Exchange Board of India).
Lot Sizes in India
Each F&O contract has a fixed lot size decided by SEBI (e.g., Nifty lot = 50 units).
Expiry Cycle
Index Options: Weekly & monthly expiry.
Stock Options: Monthly expiry.
Part 10: Psychology of F&O Trading
Success in F&O is not just about knowledge, but also about mindset:
Discipline – Stick to stop-loss and plan.
Patience – Wait for right setup.
Emotional Control – Don’t let greed/fear drive decisions.
Risk Management – Never risk more than 1–2% of capital in one trade.
Conclusion
Futures & Options (F&O) trading is a double-edged sword. It offers leverage, hedging, and high profit potential, but also comes with complexity and high risk.
For beginners:
Start with options buying (limited risk).
Learn basic strategies like covered call, protective put.
Always use stop-loss.
Treat F&O as a tool for hedging first, speculation second.
With proper knowledge, discipline, and risk management, F&O can become a powerful addition to an investor’s toolkit.
Trading Master Class With ExpertsRisk and Reward in Options
Options provide defined risk for buyers and potential risk for sellers:
Buyers: Maximum loss = premium paid, profit = theoretically unlimited for calls, limited for puts.
Sellers (writers): Maximum profit = premium received, risk = potentially unlimited for uncovered calls, high for puts.
Example:
Selling a call without owning the stock (naked call) can lead to unlimited losses if the stock skyrockets.
Buying a put limits risk but can still profit from sharp downward moves.
Hedging with Options
Options are a powerful tool for hedging investments:
Protective Put: Buying a put on a stock you own protects against a decline.
Collar Strategy: Buy a put and sell a call to limit both upside and downside risk.
Portfolio Insurance: Large investors use index options to protect portfolios during market volatility.

What Is India VIX & Its impact on the Market Q: What is India VIX?
Ans) India VIX, or India Volatility Index, measures the market's expectation of volatility
over the near term. It is often referred to as the "Fear Gauge" as it indicates
the level of fear or risk in the market.
Higher VIX values indicate higher expected volatility,
while lower values suggest lower expected Volatility.
Q: What does a High India VIX indicate?
Ans) A High India VIX indicates that traders expect significant volatility
in the market. This often corresponds with market uncertainty or fear,
possibly due to Economic Events, Political instability, or other factors that
might cause large price swings.
Q: What does a L ow India VIX indicate?
Ans) Low India VIX suggests that traders expect the market to be relatively
stable in the near term. This typically corresponds with periods of market
confidence and lower perceived risk.
Q: How do major events affect India VIX?
Ans) Major Events such as Elections, Economic Announcements, Geopolitical Tensions,
or Natural Disasters can significantly impact India VIX. These events often lead to increased uncertainty and Fear, causing India VIX to spike as traders anticipate greater market volatility.
These are some of the Basic information about the India VIX and its impact on the Market
Like & Follow for more Educational Posts ✍️

What you need to become a successful trader?here we have discussed what are the important things that you will need to become a successful trader.
1. Techinical Analysis Skill: Understanding the chart behaviour;
Price
Volume
Support and resistance
Trendlines
2. Risk Capability
How much money you can afford to lose on a single order, and on a single day.
3. Peace of Mind
Are you having a thought that might disturb your trade making decision. You must
have a calm and peaceful mind for being a successful trader.
4. Trade Managment
Trade management is the skill that gives you the power to make intelligent
decisions based on the analysis of which point is the best point to enter and
exit from the trade.

Understanding patterns - PART 1Patterns have been in use for as long as technical analysis have existed and are working today also, traders all over the world try to find patterns in chart to anticipate the possibility of the next move for any Index or stock. Pattern have a reason for working this greatly because all the patterns have an underlying psychology behind it and all these are driven by none other than the human emotions that lie behind them.
What are patterns?
According to John J Murphy "Price patterns are pictures or formations, which appear on price charts of stocks or commodities, that can be classified into different categories, and have a predictive value."
Putting it simply these are formations of candles which take a special shape when seen together and give you an idea of the future possible move of any script.
Why do patterns work?
Patterns work because they are the depiction of human emotions in the market and clearly shows what the traders in the market want a stock or commodity to do in a particular timeframe, now it must be odd and you may be thinking that how can a simple pattern or movement of the candles can tell you what is going inside the minds of people. Let me give you an idea so that you understand what is it that I mean by reading the minds of the traders using pattern and understanding what they want a particular stock or commodity to do.
The chart that you see above is hindalco which is listed on NSE.
To understand this let me tell you about the white lines you see, these are called trendlines and are made by connecting highs to highs or lows to lows to get an idea of the trend on current ongoing move or to make a pattern.
The pattern you see above is called ascending triangle pattern and is a bullish structure that when gives a breakout the stock or commodity gives a run for the upside.
Now the answer to the the question why ascending triangle pattern is bullish and how we get to anticipate the future movement lies in the human emotion or psychology that made this pattern in the market and it will also explain how you understand the human emotion in the market depicted as pattern.
This ascending triangle pattern is made by joining two line which I have named as trendline 1/resistance & trendline 2/support.
Trendline 1/Resistance shows us that the bears are not willing to let the price go beyond the levels of 470 and are shorting the stock near that price. Bears are wanting the stock to remain below the 470 price level.
Trendline2/Support tells us that the bulls are buying the stock on higher prices again and again that's the reason the trendline is inclined, bulls are wanting the stock to go up.
Now all of this tells us that right now bulls are more aggressive than the bears as bears are not willing to short below the price of 470 but bulls are ready to buy the stock at higher price and are the reason the price keeps surging up.
There comes a time when both the lines meet and there is no buffer space left between buyers and sellers and the price can now only go in single direction now, so bulls being more aggressive breaks the resistance of 470 and the price moves above it. Now there are two things that are going to happen:
1. More buyers will come in to buy as the resistance is broken making the price rally even more.
2.Short positions will have to be covered for, which will yet again make the price move up.
So that is how a mere pattern of a triangle joined by two line made you see the emotions of the traders inside the market and thus anticipate the future movement of price. Now this concept applies to all of the patterns there are in the market, some will be as simple as this one while others being more complex but all of these will make you a better trader letting you anticipate the movement.
This was the end of Part one of this series in which I'll be trying to make you understand patterns and trade more effectively using them.
The Next part will be the two main categories of pattern which will be in more depth and will actually help you anticipate the prices and add these pattern into your trading style.
If you have read it far enough so please give it a like and do follow me for the next part which I'll try to drop on the next weekend.

Why I am bullish on Airtel - Macro trend analysisThis is a long-term analysis for the telecommunications giant - Bharti Airtel .
There are two primary market trends in the broad perspective :
1. Uptrend/downtrend
2. Accumulation/ Distribution.
The accumulation phase is the boring phase , when smart investors accumulate positions and get in early. the uptrend/mark-up phase is the euphoria phase when the retail market participation increases, indicated by surge in volume, and smart investors slowly start unloading their positions, until the uptrend momentum has subsided, followed by a new accumulation phase and another possible mark-up, or a distribution phase followed by a downtrend, which is also known as a bear market. Till the time price has moved away from the range it has been trading in, we do not know whether the range is accumulative or distributive in nature.
As you can see in the chart, Bharti Airtel has been in an accumulation range for more than 10 years, and it seems as though we have finally successfully managed to break away from the range to the upside. The longer a stock has been in accumulation, the stronger the momentum once price breaks away from the range.
Let us see a stock that has done something similar. It is none other than, Reliance Industries .
You can clearly see how quickly the trend progressed after leaving the accumulation range.
Key takeaway points from the analysis and comparison
1. Airtel has been range bound for a longer period of time as compared to Reliance. This implies that Airtel has spent more time in the accumulation phase.
2. Airtel broke out of the range in early 2020, but threatened to fall back into the range, only to deviate back above and hold the range-high as support for several months. Deviation and reclaim as support is considered a strong bullish sign, indicating that buyers are stepping in to defend the range high as support.
3. Reliance never back-tested its range high as support before its second mark-up phase. Airtel back-testing range high as support is giving buyers more confidence that the stock is ready for price-discovery mode.
4. Volume analysis - Airtel has a better volume profile, with depleting low volume during accumulation phase and a surge in volume upon breakout attempt, and is showing continued volume strength. This setup was not seen in Reliance.
Conclusion
With this we can conclude that Airtel is giving us a nice bullish setup for a long term trend change shift and tackling new all time highs. The Indian stock market has been in a bull run ever since the year 2000, with corrections along the way (two major corrections in 2008 and 2020). As long as this macro bullish structure of the Indian market continues, we can expect Bharti Airtel to perform strongly in the coming years and have a similar run up as compared to Reliance Industries.
Thank you. Do leave a like/comment if you enjoyed the analysis.
Note: This is not financial advise. It is for educational/entertainment purposes only
