Is BTCUSD (Bitcoin) heading towards $91,000?Hello!
BTC has finally broken through its main downward trendline, signaling a shift in market sentiment after a prolonged period of selling pressure. Following this breakout, the price formed a clear inverse head and shoulders pattern, indicating that buyers have stepped in strongly after the final liquidation at the head level. Since then, BTC has been moving within a clearly defined ascending channel, consistently creating higher highs and higher lows, which confirms the bullish trend.
As long as the price respects the lower boundary of this channel, the bullish structure remains intact. The next significant resistance lies between the 92,500 and 93,000 levels, which also aligns with the previous breakout area you marked. This area is likely to attract sellers, making it a realistic target for the current move.
Overall, the chart continues to support an upward movement towards the 93K level, unless the price breaks below the channel support, which would weaken the bullish reversal setup.
Long-short

BTCUSD: Overbought Rally Approaches Strong Support ZoneBINANCE:BTCUSD is nearing a crucial support zone, one where buyers have consistently stepped in before and sparked significant reversals. This price history alone makes this level incredibly important to watch closely. Price is approaching this zone once more, and the current market structure suggests potential for a bullish move if we see signs of rejection, such as a strong bullish engulfing candle, long lower wicks indicating absorption of selling pressure, or an uptick in buying volume.
If this support holds, I anticipate price will push towards the 98,700 area, fitting well with a short-term rebound scenario. However, if price breaks through this support and remains below it, the bullish thesis will be invalidated, opening up the possibility for a deeper pullback.
The best approach here is to wait for confirmation from the chart. Pay attention to how candles close, how volume behaves, and only consider long positions if the market defends this support level clearly. Solid risk management is key: position sizing, stop loss placement, and invalidation levels should always be aligned with the volatility that could arise around such a critical area.
This is just my personal view on the current support and resistance structure, not financial advice. Always do your own research and trade with a well-structured risk management plan. Best of luck out there!

Technical Analysis of BTCUSD – Is a Correction Approaching?BINANCE:BTCUSD is currently moving within a clearly defined falling wedge pattern, with price now pressing against the lower boundary of the structure. This level may act as dynamic support, and if price shows a strong rejection, a corrective move toward the resistance zone near 102,000 could occur.
If sellers manage to defend that resistance area, the bearish structure remains intact, giving BTCUSD the potential to continue dropping to lower levels. But if price breaks above that zone, there is room for a higher correction toward the upper boundary of the wedge.
At this stage, paying close attention to candlestick patterns and volume behavior around this key area is crucial for identifying the best selling opportunities. Make sure every trade setup is supported by clear confirmation, and always apply solid risk management.
If you have any additional insights or a different perspective on this setup, I’d love to hear it. Feel free to share your thoughts in the comments!

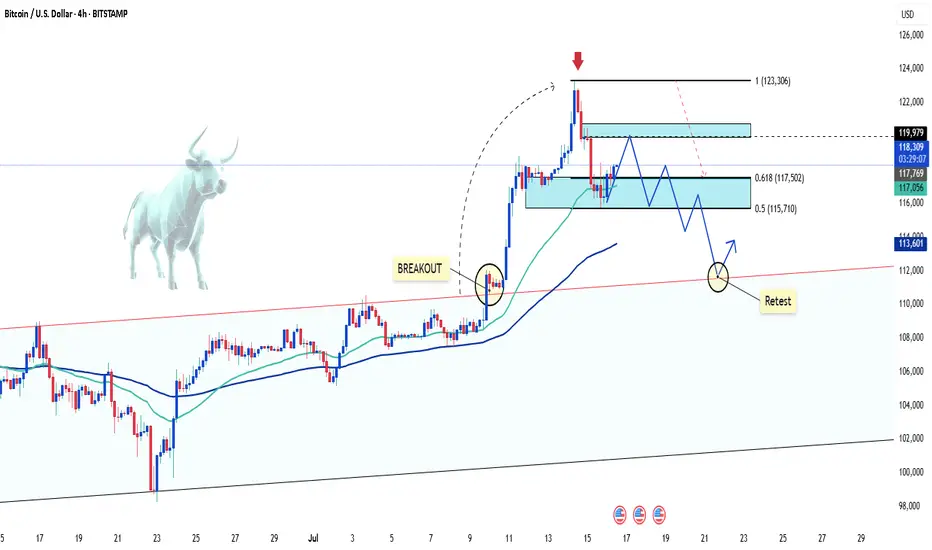
Bitcoin rebounds with strength after whale dumpAfter a surprising sell-off triggered by whale pressure, Bitcoin (BTCUSD) has shown impressive internal strength, bouncing quickly from the Fibonacci support zone between 114,488 and 116,571 USD (0.618 – 0.5 levels).
The D1 chart reveals that the bullish structure remains intact, with EMA 34 and EMA 89 acting as solid support levels. The recent "dump" did not alter the overall trend; on the contrary, it created an opportunity for reaccumulation within the price box—serving as a vital base for the next breakout.
A likely scenario is that BTCUSD will continue to move sideways for a few more sessions before targeting the 1.272 Fibonacci extension near the 128,000 USD area. If this plays out, it would be a strong confirmation of the next growth phase for Bitcoin.
Do you believe Bitcoin is ready to break all-time highs and set a new record? Share your thoughts below!

BTC/USD Pullback: What’s Next for Bitcoin?Hello, passionate and wealthy traders! What are your thoughts on BTC/USD?
After a strong surge above the 122,500 USD zone, BTC/USD has started to experience a slight pullback. This is completely normal and necessary for Bitcoin to gain new momentum.
In my personal view, the recent peak of BTC/USD signals that this correction is in play. But where do you think BTC/USD will adjust to? Personally, I believe the 111,500 USD zone is quite reasonable. It’s also the previous breakout level, and this pullback aims to test the uptrend safely.
What about you? Where do you see BTC/USD heading? Looking forward to hearing your thoughts!
BTC/USD Soars: A Surge That Took the Market by SurpriseBitcoin BITSTAMP:BTCUSD has shocked the market with a massive surge, reaching new highs in recent days. This unexpected jump has taken many traders and analysts by surprise, as BTC breaks through previous resistance levels.
The driving forces behind this surge appear to be increased institutional interest, positive market sentiment, and strong demand from retail investors. As Bitcoin enters new territory, it's essential for traders to stay vigilant and manage their risk, as volatility remains high.
Will Bitcoin continue its rally or face a correction? Keep an eye on the charts for the next move!

BTCUSDT – Is a Breakout Imminent?Bitcoin is once again testing the descending trendline that previously triggered three strong rejections, hovering around the 106,500–106,600 USDT zone. A clear rounded bottom has formed, with strong support holding around 104,200–104,700, fueling the recent rebound.
Price action is now consolidating just below the key resistance, setting the stage for a potential bullish continuation pattern. A clean breakout above this zone could open the door for a rally toward 108,600 and even 110,200 – both previous highs.
However, if the trendline holds again, the highlighted support zone is likely to attract fresh buying interest. The overall market bias leans bullish, but confirmation via breakout is crucial for the next move.
Are you ready to ride the next BTC wave?

Crude Oil Futures Under Pressure; Key Resistance Confirmed at ₹5Crude Oil futures on the MCX continued their downward trajectory on Wednesday, closing near ₹4,949 amid growing bearish momentum. WaveNodes Pro Max AI flagged a "Seller Trap Possible", but downside targets remain intact for now.
Seller trap alert means big players are finding opportunity to trap or shed short sellers.
The system-identified Short Entry at ₹5,212 has held firm as resistance, with two clear retests failing to breach the impact zone of ₹5,233–₹5,263. This former support has now flipped decisively into supply, adding pressure on intraday rallies.
🔻 Key Developments:
AI Bearish Probability: Rises to 50.9%, surpassing bullish odds.
Target 1 (₹5,036–₹5,103) achieved successfully.
Target 2 set at ₹4,750–₹4,818, with potential for deeper correction toward ₹4,465–₹4,533.
Profit Booking Alert: ₹5,084 marked as short-term profit-taking zone.
📉 Market Sentiment:
Volatility remains elevated at 23 PPB, with good volatility reading at 21 PPB, suggesting controlled but active movement.
Despite bearish strength, the AI warns of a possible seller trap, especially if prices reclaim levels above ₹5,084.
🧠 Analyst Take: “The rejection at ₹5,212 confirms the breakdown structure. As long as crude trades below this zone, lower targets remain open. However, a surprise reclaim could trigger short covering,” analysts from WaveNodes noted.
📊 Outlook:
Trend: Bearish
Resistance: ₹5,212–₹5,263
Support: ₹4,750 → ₹4,465
Traders are advised to watch volumes closely as crude approaches the next support band. A failure to break lower could validate the seller trap thesis.

JSWSTEEL POTENTIAL SHORT TERM TRADEJSWSTEEL has given a nice breakout after consolidating in a range for a few weeks. Bullish trend spotted, can be a good short term trade at the CMP.

NFP report: How Will it Shape the Gold Trend?NFP report: How Will it Shape the Gold Trend?
Gold prices experienced a rise on Tuesday and Thursday (sideways on Wednesday), driven by traders' expectations of another interest rate hike by the US Federal Reserve. But is the medium-term downtrend really over?
One fundamental indicator that can help answer this question is the nonfarm payrolls, due to be released this Friday (US time). Any unexpected outcomes could lead to heightened volatility in rate-sensitive assets such as gold.
Market projections indicate that the upcoming nonfarm payrolls report for May will show a slowdown in job additions to the economy, with 190,000 jobs compared to the 253,000 jobs added in April. Interestingly, the forecast for the previous month was also around 190,000 jobs.
The nonfarm payroll data serves as the final key indicator ahead of the release of inflation data on June 14 and the concurrent interest rate decision from the Federal Reserve.
Market sentiment currently suggests a 60% probability of a 25 basis-point interest rate hike during the Federal Reserve's upcoming June meeting, compared to a 26% chance observed a week earlier. If implemented, this would mark the central bank's 11th consecutive rate increase.
Gold was trading around $1,932, reaching its lowest level since March 17 before its incline began on Tuesday. While Thursday was a positive day for the metal, it still retraced about half of its gains on the day and now trades at approximately $1,960. It peaked at $1,974, which is the most immediate resistance level but without much historical precedence. Considering the NFP is still two days away, this level might become irrelevant.
$1,985 is a level with more medium-term precedence but will have to wait until closer to the release of the data to tell if this level is something that needs to be watched. If gold turns to the downside, it might pay to keep an eye on $1,938 as a support level.

Bitcoin Dead Or Gone At This Level $28200 or $26450See #bitcoin has this condition right now, no wonder btc always disappoint as well as always outperformed.
the resistance level of btc which is $28200 has to be crossed in order to reach $30k to $40k frame
if reversal pattern cross the support level of $26400 then we will se the collapse till $24k to $22k
hope you have the clarity in market
show love and respect for me to provide the best information of the market
thanks!
#crypto
#pepe
#btc

Nifty: With FED Meeting done & dusted what to expect from Nifty?18030-18065 would play a crucial role
Sustaining below 18030 on 15 min candle one may look to sell for target of 17960 odd levels with a SL tad above 18065
giving a Risk:: Reward ratio of 1::2
A weekly close below 17960 could open doors for a move towards 17800 / 17750 odd levels.
Sustaining 17960 and managing to give a Weekly close Above 18065 In that case Long can be initiated for target of 18400 in coming days with a SL at 17960 giving a Risk::Reward ratio of 1::3.3
Like and Follow
Take care and safe trading..!!!

SBIIN BANK long and short opportunityThis analysis Is on a 15 M Timeframe you can activate both short and long
after opening, the market's strong move first take the " 1:2 " target and
then bring your stop-loss to cost and continue your trade...

WOO bullish scenario BINANCE:WOOUSDTPERP
Bullish scenario . Travelling inside the channel good to long at support.
FOLLOW FOR MORE
FROM: 𝕄🌚🌚ℕ𝕋𝔸ℕ𝔾 ℂ𝕃𝔸ℕ™️

nifty longterm , weekly chart analysisnifty current 18080,18100 support lvl(day S lvl)
nifty current resistance 18373,18440,18614(day R lvl)
head and sholder pattern , and weekly , daily channel pattern formed
if Market breakout it will be nifty range 18600-18800-19500( imaginary points).
breaish side 17800-17500 strong bear market ,(known).
but , nifty sign on longterm investment(if breakout).
market now consolidation, avoid sideways market.

TVS MOTORSAfter the completion of the rounding pattern or bowl pattern from the level of 800 its continuously in the bullish form making higher highs pattern.
Now it's showing the exhaustion so we can see some profit booking here either it can move for buying if it crosses the channel right now it just breakdown the major trendline followed by it from the level of 800 once it crossed below 1080 and 1060(majorly) we can see fall and also on the monthly chart time frame we can observe that it can make the inside candle thus making it in your list is gonna be a jackpot.
On the way we are having the support of 50 MA which can be a good sign for buyers and sellers if it closed below it can fall easily.

sgx nifty 50 futurefibonacci channel finding
high and low rejection or out points,
18000-19000 future market ( shown fib channel).
similar point to break out for all time high.
or not.
goodluck fii data shown low selling but not toomuch ,

nifty 50 greed lvl after 18400 breAKOUTgreed not extreme lvl
18000-18750-18800
now supported is changed 18280-18370 ,
higher will be testing or another breakout will be another chance for all time high.
nifty 50 upperside bullish engulfing candle after breakout 18400.
18550, 18600 resistance lvl.
goodluck
market volatality is low , trade for better entry, any side call and put option.( next week better for option trading).

Selling opportunity in Nifty or Not!-->For the first time since 13/10/2022 Nifty has closed below its previous days closing "PDC" yesterday.
-->Nifty has extended quite high without a correction and I'm expecting a small correction before its BIG BULL RUN.
--> Why not BUYING today?
-->Yeah we can also buy with todays low as SL and enter when market gives retracement towards days low and again shows bullish momentum
--> PLAN 1
-->Continuing with shorting plan one can Short around 0.618 level at any strong bearish candle with 0.78 levels as SL or a big SL (18192 like that)
Short Entry:18095
SL:18155
--> PLAN 2
-->Wait till market comes till 0.78 levels and then short market with approx 60 points SL
-->This is high probable setup because chances of achieving 1:1 and securing the trade is high.
-->Even if price goes into stop loss zone we will have a good chance to exit if Price move around that level for some time ,coming to our entry area.
Short ENTRY : 18132
SL :18192 levels
I am posting this for Live testing purpose.
Managing the trade:
If the trade goes in our way
*Exit half Quantity @1:1 Risk/Reward Target and Shift to SL to cost
*Exit Half of the remaining with 1:1.5 or 1:2 Risk/Reward (by looking at momentum) and trail the SL.
*Exit remaining with trailing Stop loss.
*SECURING THE TRADE AND PROTECTING THE CAPITAL SHOULD BE YOUR FIRST PRIORITY.
*NOT A SUGGESTION VIEWS ARE FOR EDUCATIONAL PURPOSES
***If you think video analysis will be good for better understanding & If you want me to do video analysis pls give a boost. Your boost and follow is my MOTIVATION.
I will be updating

Should we buy or sell Nifty Today?Nifty is in narrow range since opening.
15 min candle breakout should give good target either side.
For Upside 1;1 should be 1st Target and then trailing.
For downside also same thing but can focus on gap filling also.
BREAKOUT PLAN
The breakout candle should close above the range (at least 30 percent of body)
Then one can enter at candle close with SL below bottom range level. (should be ~50 points)
OR
After Breakout one can wait for some retracement and enter the same with same SL (can get small SL)
BREAKDOWN PLAN
The breakdown candle should close BELOW the range (at least 30 percent of body)
Then one can enter at candle close with SL above range level. (should be ~50 points)
OR
After Breakdown one can wait for some retracement and enter the same with same SL (can get small SL)
I am posting this for Live testing purpose.
Managing the trade:
If the trade goes in our way
*Exit half Quantity @1:1 Risk/Reward Target and Shift to SL to cost
*Exit Half of the remaining with 1:1.5 or 1:2 Risk/Reward (by looking at momentum) and trail the SL.
*Exit remaining with trailing Stop loss.
*SECURING THE TRADE AND PROTECTING THE CAPITAL SHOULD BE YOUR FIRST PRIORITY.
*NOT A SUGGESTION VIEWS ARE FOR EDUCATIONAL PURPOSES
***If you like my analysis let me know by giving boost or a comment.
I will be updating

Selling opportunity in Niftylets see if we can secure this trade with at least 1:1 RR. SL of just 40 points .
Candle close above 18020 will change every thing Until then its a good risk reward .
Closing below 17940 will be considered as proper weakness then one can plan for positional trades.
As of now not that much weakness but in smaller TF i have observed market breaking the structure and it is afternoon also lets see if any selling pressure comes.
I am posting this for Live testing purpose.
Managing the trade:
If the trade goes in our way
*Exit half Quantity @1:1 Risk/Reward Target and Shift to SL to cost
*Exit Half of the remaining with 1:1.5 or 1:2 Risk/Reward (by looking at momentum) and trail the SL.
*Exit remaining with trailing Stop loss.
*SECURING THE TRADE AND PROTECTING THE CAPITAL SHOULD BE YOUR FIRST PRIORITY.
*NOT A SUGGESTION VIEWS ARE FOR EDUCATIONAL PURPOSES
***If you like my analysis let me know by giving boost or a comment.
I will be updating

Not every swing high is a Fake Breakout !Good morning traders.
If you have entered long at the high of the green candle as shown in the chart you would have thrown out of the market by taking your SL and kept you thinking Oh! It must be a Fake Breakout.
-->We all know that market structure is combination of waves.
-->These waves will follow Primary trend, Secondary trend and all the minor trends on the way.
-->In the Bullish momentum - Price will form Higher highs and higher lows.
-->In the Bearish momentum price will form Lower highs and lower lows.
-->If we observe the recent path the market is following, it has formed higher highs and higher lows.(Bullish If i have to say)
-->Before Friday the recent swing low the market has formed at 17637 level.
About the fake breakout - The price level it broke has hardly respected once. If the price has respected that level 2-3 times and then if it breaks it and comes back into range then we may call it a fake breakout or if it has broken the previous swing low then we can consider it as a fake breakout.
Since none of the above mentioned has happened its just be a another swing high and market is still in up move.
Above concept is done.
Now on Friday market has formed a new swing high 17830 level and major swing low is 17637 levels. If price can go past 17835 on Monday then swing low will be shifted to 17723 levels.
Then why I post shorting trades in the Ideas?
I try to plan my trades at the extremes (at swing lows and swing highs).
There is no point in going long at a swing high unless our stop loss is huge.
That is why in a bull structure I plan to buy at swing lows or I plan to short at swing highs both of them will have small SL and High rewards. Do you agree with me in this aspect?
If we observe our recent market openings, it has opened with gap ups. So I don't want to risk huge SL for limited intraday up move that's why I plan contra trades.
On Monday I will be cautions because SGX Nifty is showing 18000 + and it will make it as a good supply zone.
I will observe the price action in smaller time frames and plan my trade.
The future market direction will be decided at these levels.
--> What we need to observe?
--> Whether the market is accumulating at this level or Distributing at this level.
I have written so much in this ,I will write more based on the response I get from this. I know few of these will be confusing, do let me know If you want to know about particular concepts then I will have Idea about what I should be writing for.
*SECURING THE TRADE AND PROTECTING THE CAPITAL SHOULD BE YOUR FIRST PRIORITY.
*NOT A SUGGESTION VIEWS ARE FOR EDUCATIONAL PURPOSES.
If you think video analysis will be good for better understanding & If you want me to do video analysis pls give a boost. Your boost and follow is my MOTIVATION.

Bank Nifty Trade Plan.Good Morning Everyone,
Key levels on Bank Nifty
-->Major Supply zone- 41700 - 42000
-->Fib Resistance zone: 41250
-->On Higher Time frames Major Support 39850 level
-->If we observe the volumes on recent swing high i.e., 40700 We can consider this as a decent breakout indicating Bullish behavior
-->Until we get a Closing below 39850 level market will remain bullish .
-->This doesn't mean we can long right now unless you can risk 4000 - 4500 per lot
--> Its always better to wait for retracements and buy on those dips.
-->From 39850 BNF is in up move when this wave is over in smaller Time frame we shall see a correction then we can go long with small SL.
Managing the trade:
If the trade goes in our way
*Exit half Quantity @1:1 Risk/Reward Target and Shift to SL to cost
*Exit Half of the remaining with 1:1.5 or 1:2 Risk/Reward (by looking at momentum) and trail the SL.
*Exit remaining with trailing Stop loss.
*SECURING THE TRADE AND PROTECTING THE CAPITAL SHOULD BE YOUR FIRST PRIORITY.
*NOT A SUGGESTION VIEWS ARE FOR EDUCATIONAL PURPOSES
***If you like my analysis let me know by giving boost or a comment.
I will be updating.
