CEIGALL INDIA LIMITED Setup: Base formation after a prolonged downtrend
Trigger: Sustained move above ₹291
Volume / RSI: Volume expanding, RSI ~70, OBV trending higher
-Stoploss: ₹265
-Targets: ₹334 → ₹375
-Bias: Early reversal candidate; acceptable risk–reward near breakout
Longsetup

Century PlyboardsSetup: Symmetrical triangle (multi-month compression)
Trigger: Breakout above ₹850
RSI / Momentum: RSI >50 and rising
Missing piece: OBV confirmation still awaited
-Stoploss: ₹776
-Target: ₹1150
-Bias: Watchlist → act only on price + volume confirmation

Ajanta Pharma in a cup and handle pattern Ajanta Pharma
Setup: Cup & Handle
Trigger: Breakout above ₹2890
Strength: RSI >60, OBV rising, volume strong on up-moves
Stoploss:
Aggressive: ₹2770
Conservative: ₹2660
Target: ₹3480
Bias: One of the cleaner momentum structures

Imdus towers in a rectangle pattern Indus Towers
Setup: Range consolidation near resistance
Trigger: Breakout above ₹454
Confirmation needed: ≥ 1.5× average volume
RSI / OBV: RSI near 60, OBV improving
Stoploss: ₹318
Target: ₹594
Bias: Conditional — trade only on decisive expansion

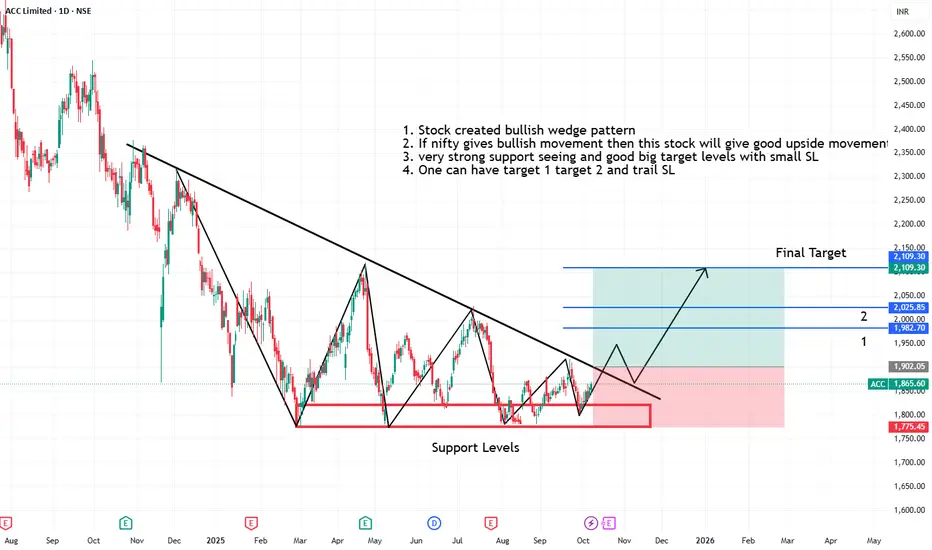
Acc creating bullish wedge pattern on strong support levels1. Stock created bullish wedge pattern
2. If nifty gives bullish movement then this stock will give good upside movements
3. very strong support seeing and good big target levels with small SL
4. One can have target 1 target 2 and trail SL
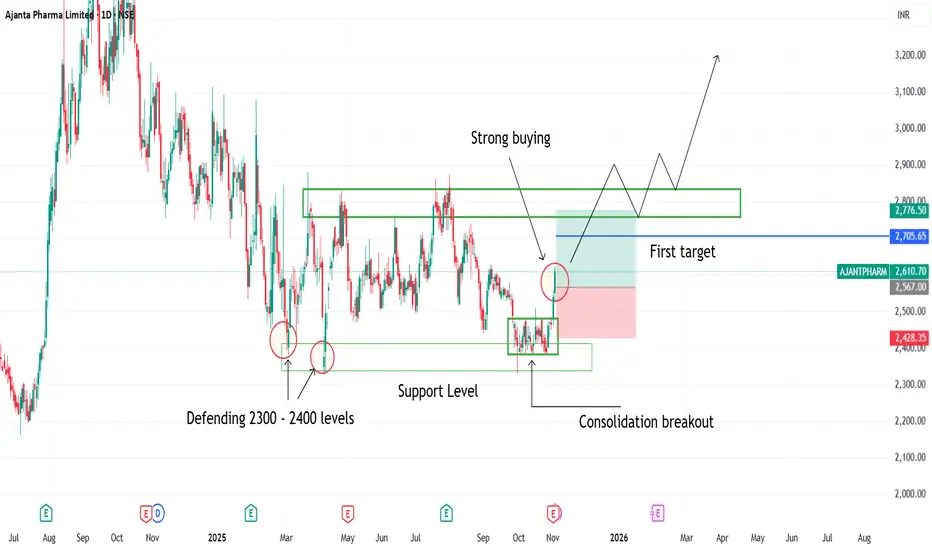
Consolidation breakout seen in ajanta pharma1. Consolidation breakout seen in ajanta pharma
2. Buyers defending 2300 2400 levels
3. Strong Bullish candles indicating strong buyers strength
4. Consolidation breakout has been happened on support levels
BNBUSDT – Daily Timeframe AnalysisBNB is reacting from a strong support zone around 770 after a sharp sell-off. I’m looking for a bounce from this demand area for a possible short-term recovery.
Plan:
📍 Entry zone: 770–780
🎯 Target: 950–1000 (previous resistance area)
🛑 Stop-loss: Below 700
Bias: Cautious bullish while price holds above support.
If support fails, bearish continuation toward lower levels is possible.
Not financial advice. Trade with proper risk management.

FUSION - Time to shine?DISCLAIMER: This is NOT a trade recommendation but only my observation. Please do your own analysis before entering your trades
Points to note:
-----------------
1. Price has been in consolidation for 8 months inside a triangle
2. Attempt to breakdown was rejected with price swiftly moving back into the triangle.
3. Finally price is breaking out, accompanied by good volumes
4. Target is the pattern height of the triangle.
Keeping the above points in mind:
Entry CMP, SL 155, TGT 260, RR 2.5

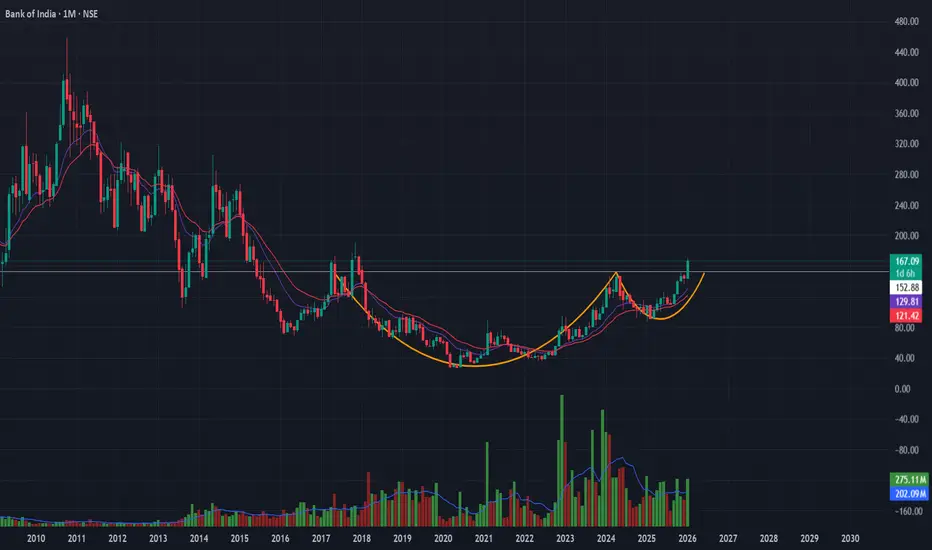
Bank of India | Cup & Handle Breakout SetupStructure:
Long-term Cup & Handle pattern nearing completion on monthly timeframe, indicating accumulation after a prolonged base.
Confirmation Signals:
-Volume expanding on rallies
-RSI above 50 and rising
-OBV trending higher → accumulation visible
-Price holding above short-term EMAs
Trade Plan:
-Buy: Sustained breakout above ₹151
-Targets: ₹199 → ₹268
-Stop-loss: ₹134 (ATR-based, structure-valid)
-Risk–Reward: ~1:5
JINDALSTEEL | Flag continuationStrong prior impulse, orderly flag structure
-RSI >50, EMAs rising, OBV confirms accumulation
-Sector tailwind: strength in metals
Trade plan:
-Buy > 1100 (volume confirmation required)
-SL: 1030
-Positional target: 1770
-R:R ≈ 1:11

NASDAQ bullish bias on HTF and ITFThe price is currently reacting to THE DAILY FAIR VALUE GAP , which is a good confluence for bullish and long clarity, as the dollar continues to freefall , we can consider the relative strength between the index and the currency to support our long idea.
The closest target would be the recents 4 hour highs.
Wait until 9:30 openin for any manipulation to frame our trade.
Invalidation :- closing below the (dfvg)

XAUUSD (Gold) | Technical Outlook | 22nd Jan'2026Gold continues to trade near 4,831, maintaining a strong bullish structure across all major timeframes. Price remains firmly above key moving averages (20/50/100/200), signaling sustained buyer control and trend continuation.
Momentum indicators support the upside, with RSI in bullish territory, MACD positive, and ADX above 35, confirming strong trend strength. Volatility remains elevated, suggesting sharp and directional price moves.
Key Levels to Watch
Support: 4,800–4,790 | 4,770–4,760 | 4,740–4,730
Resistance: 4,838–4,845 | 4,870–4,888
Major Breakout: Above 4,900
Bullish Bias
As long as Gold holds above 4,770–4,780, the trend remains bullish. A break and close above 4,845 could trigger momentum buying toward 4,870 → 4,900+. Pullbacks are expected to remain corrective.
Bearish / Correction
Bearish pressure emerges only below 4,770, with downside levels at 4,740 → 4,700 → 4,660. Trend reversal only if 4,630 breaks on a daily close.
Trading Focus
Buy on dips near 4,800–4,790
Sell only on breakdown below 4,770
Watch US PMI, GDP, Jobless Claims, Fed commentary & DXY for volatility
Conclusion
Gold remains firmly bullish, with the path of least resistance pointing higher unless key supports fail.

Equitas Small Finance Bank – Swing Trade ViewPrice has broken out of a long-term falling channel, signaling a trend shift from bearish to bullish.
Post-breakout structure shows higher highs and higher lows, confirming strength.
Price has broken out of a long-term falling channel, signaling a trend shift from bearish to bullish.
Buy Zone :
₹66–₹67 on pullback to former resistance turned support
Or on daily close above ₹70 for continuation
Stop-Loss:
Below ₹65 (structure-based)
Targets:
T1: ₹73–₹75
T2: ₹78–₹80

Long idea📈 GMR Airports | Long-Term Resistance Test ✈️
GMR Airports is trading near a major multi-year resistance zone (~₹100) on the weekly timeframe.
Price action shows strong recovery from long-term base and is now testing a critical breakout level.
🔍 Technical Highlights:
• Multi-year downward trendline in focus
• Strong base formation over several years
• Higher highs & higher lows since 2023
• Volume remains supportive
📊 Current View:
• Sustained weekly close above ₹100 → breakout confirmation
• Rejection from this zone → consolidation likely
📌 Bias: Neutral → Bullish on confirmation
⚠️ Disclaimer: Educational purpose only. Not financial advice.
#GMRAirports #StockMarketIndia #BreakoutWatch #WeeklyChart #LongTermInvesting #TechnicalAnalysis #IndianStocks #PriceAction

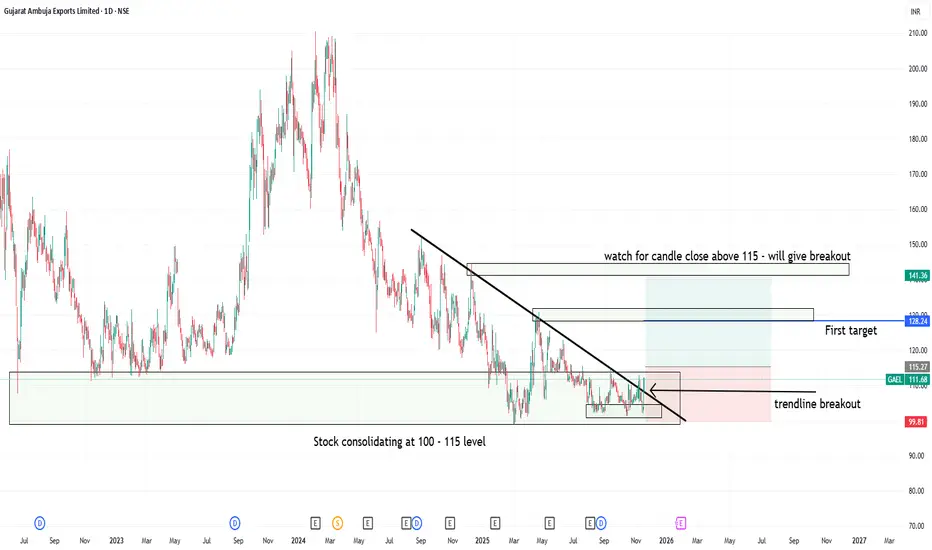
Trendline breakout at support level in GAEL1. Gujrat ambuja export lt- showing consolidation at 100 to 115 levels
2. Candle close above 115 can trigger consolidation breakout at strong support zone
3. Trendline breakout has already happend but above 115 close will be safe and logical
4. Good Risk:Reward one can watch for upside movement with strict sl level
Union Bank of India: Long-Term Head & Shoulders PatternUnion Bank of India has delivered a decisive long-term breakout on the monthly timeframe after completing a classic Inverse Head & Shoulders pattern, marking a major structural shift in trend. The pattern has been in formation for several years, with a well-defined left shoulder, a deep head near the bottoming zone, and a higher right shoulder, clearly reflecting gradual accumulation after prolonged weakness.
The most important technical development is the clean breakout above the neckline resistance, which had capped price action for multiple years. This neckline breakout is supported by strong bullish candles, indicating conviction from long-term participants rather than short-term speculation. Such breakouts on higher timeframes often signal the beginning of a multi-year uptrend rather than a temporary rally.
From a projection perspective, the measured move derived from the head-to-neckline height suggests a primary upside target near the 240+ zone, followed by an extended target around 280+. If momentum sustains and the broader banking sector remains supportive, the structure also opens the door for a long-term projected target near 325+, aligning with the full pattern height projection shown on the chart.
Risk remains clearly defined in this setup. As long as the price holds above the neckline breakout zone, the bullish structure remains intact. Any sustained move back below this level would weaken the breakout thesis and shift the view back to consolidation. This makes the trade favorable from a risk–reward standpoint, as downside risk is limited relative to the potential upside.
Overall, Union Bank of India is transitioning from a prolonged basing phase into a new bullish cycle. Such high-timeframe pattern breakouts are often accompanied by volatility in the initial phase, but structurally they favor positional and long-term investors, especially when managed with disciplined risk control.

BALKRISIND | Support Trendline + Demand Zone ConfluenceDISCLAIMER: This is NOT a trade recommendation, but only my observation. Please do your own analysis before entering your trades.
Points to note:
------------------
1. A Support trendline of 3 years is being respected by price
2. There is tightness since Oct 2025, on the said trendline, indicating accumulation.
3. A Higher High, Higher Low formation is being seen.
------------------
Keeping in mind the above points, the following trade:
Entry CMP, SL 2220, TGT 2525, 2750

BUY NATIONAL ALLUMINIUMNational Aluminum gives all time high breakout and than retest the level which become strong support and stoploss for a trade, so long on national aluminum or hold as a trade as well long term investment with strict stoploss. Do your own research this is only for education purpose not any buy or sell recommendations. i am not expert in market because market is the king. Enjoy the Ride.

Nifty Breakout and RetestNifty gave a breakout of a triangle on Friday and today it has given a retest of the breakout level.
One can look for longs from here on on Nifty with 26100/26050 as SL.
Target- 26300, 26450, 26500.
Check the Chart for understanding the pattern and keep a track for more learning.
Disclaimer- This is just for educational purpose.
Jai Shree Ram.

MFSL | Uptrend Continuation?DISCLAIMER: This idea is NOT a trade recommendation but only my observation. Please take your trades based on your own analysis.
Points to note:
-----------------
1.Stock in a strong uptrend, and broken out of a Cup & handle consolidation that lasted.
2. The breakout is strong and firm, forming a pole. Currently price is consolidating inside a flag.
3. The breakout from this flag can lead to another good move up
4. The target price is the pole's height
Considering these points, the following trade:
Entry CMP, SL 1425, TGT 2310

ETH Looks Bullish .Why No one is talking about this? What is see : strong 💪 breakout . Better to enter on retest.

JSWCEMENT | A reversal finally?DISCLAIMER: This idea is NOT a trade recommendation but only my observation. Please take your trades based on your own analysis.
Points to note:
-----------------
1. A downtrend dominant in the stock since it listed on the market
2. A Solid base formation with breakout of the neckline seen. (A cup and handle is generally a continuation pattern, but its just a name. So focus more on the rounding base rather the label.)
3. The target is the same as the pattern height
Following trade: Entry - CMP, SL- 114, Tgts - 136

XAUSUD (Gold) | Technical Outlook | Last Day of Analysis 2025Gold is showing short-term weakness despite a bullish higher-timeframe trend (weekly/monthly). Current price action is driven by profit booking and momentum selling, with volatility keeping key levels in focus. As long as gold trades below 4,350, the intraday bias remains bearish, with downside levels at 4,327 → 4,305 (key) → 4,282, and a break below 4,305 opening room toward 4,275. Rallies below resistance are likely to be sold. A bullish reversal is only valid on a strong break and hold above 4,370, followed by acceptance above 4,395, which can open upside toward 4,416–4,450. For today, selling near resistance offers higher probability, while long positions should be considered only on confirmed breakout strength.
