Grasim Industries (CMP ₹2,891.7)Pattern: Cup and Handle — retesting neckline post breakout.
Structure: Throwback towards neckline near ₹2,885–₹2,900 zone; strong recovery from base.
Indicators:
RSI above 55, turning upward.
MACD bullish crossover holding.
21 EMA > 50 EMA > 200 EMA — uptrend intact.
Trade Plan:
📈 Buy above: ₹2,902
🛑 Stoploss: ₹2,851
🎯 Targets: ₹2,963 / ₹3,035
View: Excellent structural strength; watch for breakout confirmation with volume.
Longsetup

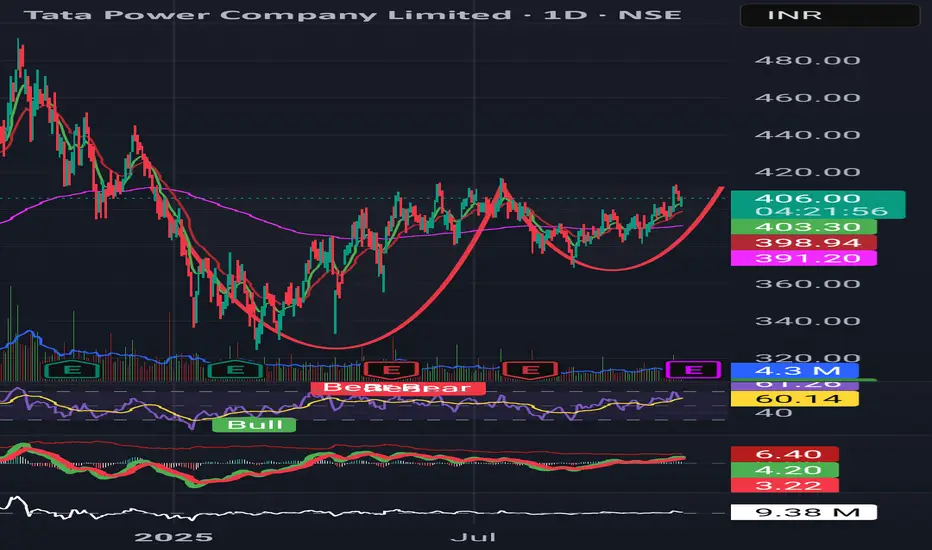
Tata Power (CMP ₹404.9)Pattern: Cup and Handle nearing breakout.
Structure: Handle formation visible near ₹400–₹410 zone; consolidation on low volume.
Indicators:
RSI at 59, gradually rising.
MACD turning positive with histogram expansion.
Trade Plan:
📈 Buy above: ₹416
🛑 Stoploss: ₹410
🎯 Targets: ₹440 / ₹459
View: Breakout potential high; confirmation needed above ₹416 with strong close.
BPCL (CMP ₹356.8)Pattern: Cup and Handle; neckline at ₹352 recently reclaimed.
Structure: Breakout retest visible with price consolidating just above 21 EMA.
Indicators:
RSI at 68, bullish momentum intact.
MACD shows renewed crossover — supports continuation.
Trade Plan:
📈 Buy above: ₹352
🛑 Stoploss: ₹344
🎯 Targets: ₹382 / ₹403
View: Oil & Gas sector remains strong; momentum aligns with sector tailwinds.

Ashok Leyland (CMP ₹141.5) Pattern: Cup formation nearing neckline resistance.
Structure: Price consolidating near resistance zone of ₹143–145 after a rounding bottom recovery.
Indicators:
RSI steady around 60, mild bullish bias.
MACD positive, slightly flattening — needs fresh momentum.
Price above 50 & 200 EMA — trend intact.
Trade Plan:
📈 Buy above: ₹144 (confirmation above neckline)
🛑 Stoploss: ₹140
🎯 Targets: ₹149 / ₹152.4
View: Short-term consolidation but potential continuation if ₹144 breaks with volume.

GLENMARK PHARMA LONG SETUP FORMATIONKeep eye on Glenmark Pharma closing above 1845 than make long position with small stoploss and wait for the reward. No guaranteed return assured. Do your analysis from your side than made an entry.

BUY MAX HEALTHCARE FOR TRADINGMax healthcare gives a breakout on weekly as well as daily time frame to consider a buy call for short term trading perspective with strictly stoploss. 1:2 Risk Reward Ratio. if All Time High break out than i repeat my targets in next few days. Stay Tuned. This is only for educational purposes do not consider as a recommendation. do your home work first not guarantee return.

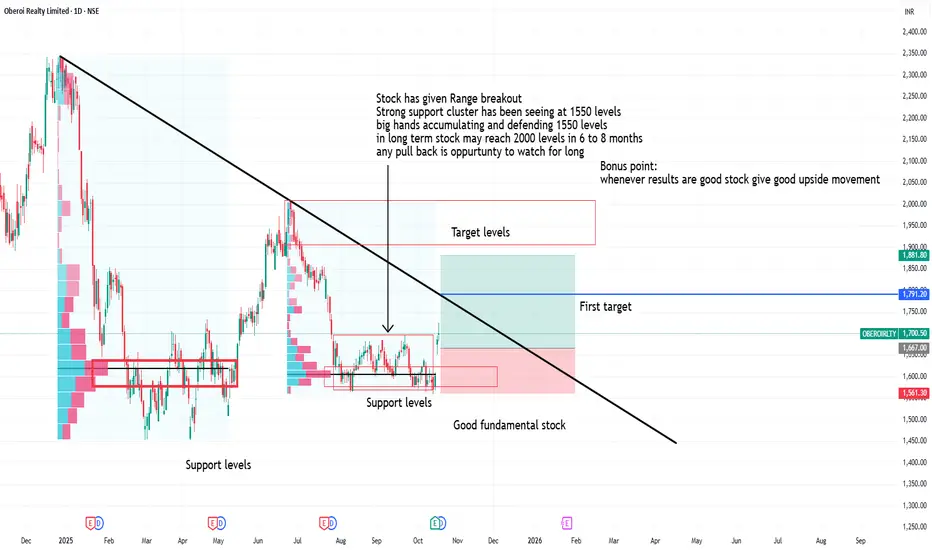
Oberoi reality range breakoutStock has given Range breakout
Strong support cluster has been seeing at 1550 levels
big hands accumulating and defending 1550 levels
in long term stock may reach 2000 levels in 6 to 8 months
any pull back is oppurtunty to watch for long
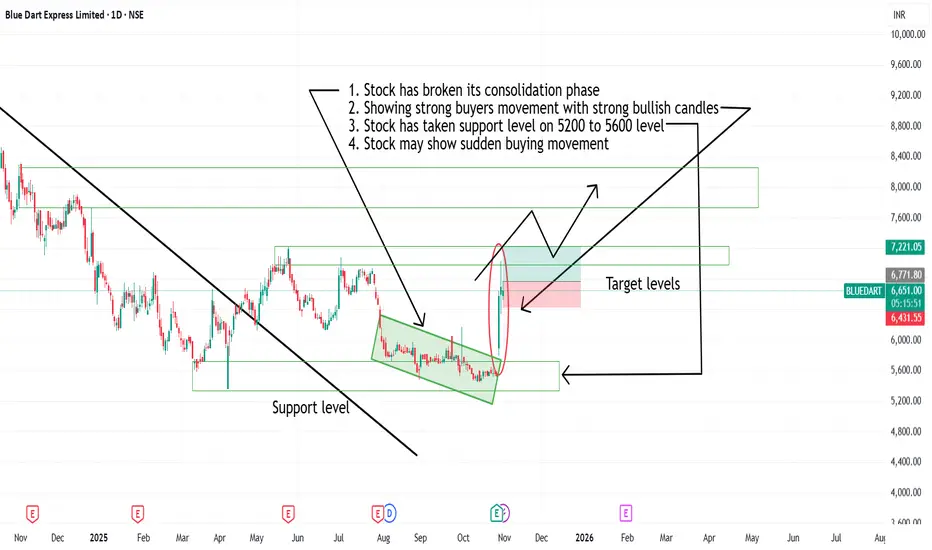
Strong buying holds bluedart1. Stock has broken its consolidation phase
2. Showing strong buyers movement with strong bullish candles
3. Stock has taken support level on 5200 to 5600 level
4. Stock may show sudden buying movement
IRB trendline breakout on support level1. trendline breakout on support level
2. Inverse head and shoulder pattern on support level
3. good for swing upside movement

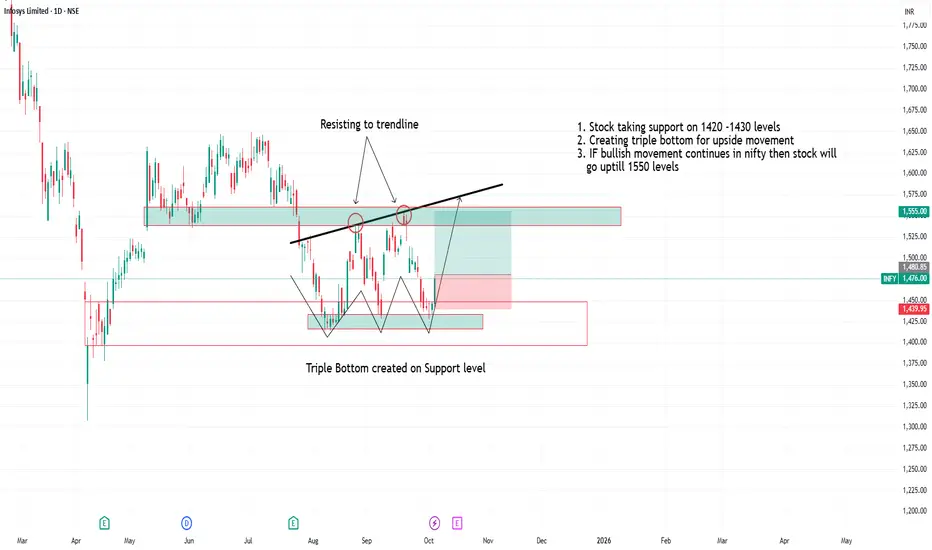
Infosys creating triple bottom on 1420-1430 level1. Stock taking support on 1420 -1430 levels
2. Creating triple bottom for upside movement
3. IF bullish movement continues in nifty then stock will
go uptill 1550 levels
Double bottom W pattern in LIC housing financeDouble bottom W pattern in LIC housing finance
may test its resistance zone
good for upside movement

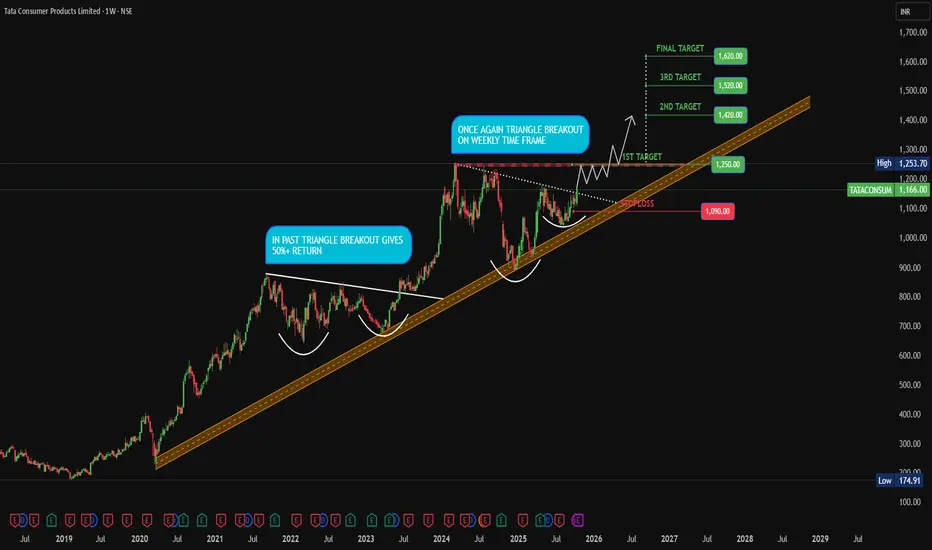
BUY TATA CONS HISTORICAL BREAKOUT in past TATA CONS stock make same triangle structure and gives a breakout than consolidated for 6 to 7 week for accumulation and than gives 52%++ return in a year. Last week its gives same breakout with strong support and good to consider for long term with good risk return. Do your own study and research before entering any position. No guarantee return.
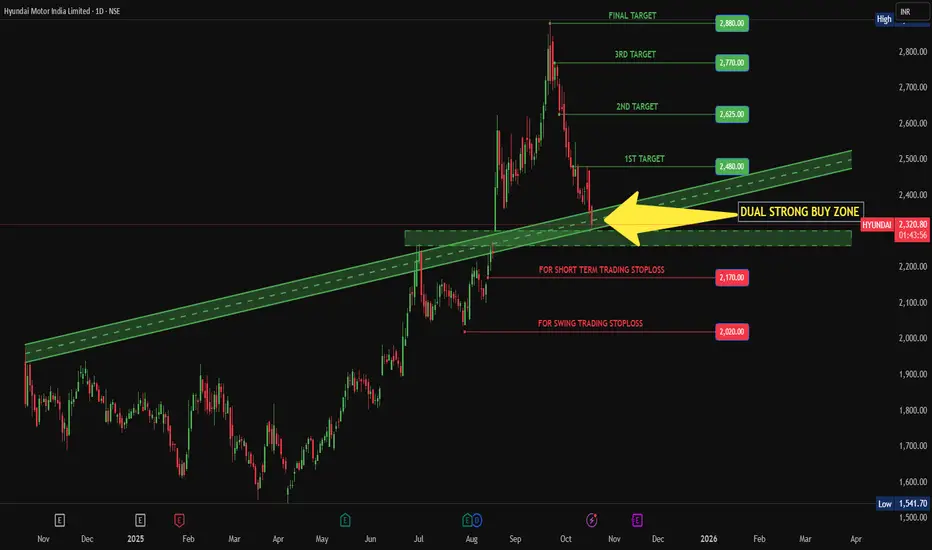
HYUNDAI IN STRONG BUY ZONEHyundai Motors India reach at dual strong buy zone area to consider as a long trade, use your skill as well knowledge to enter in a trade not guaranteed return. Do your own research than make a trade. But technically and fundamentally Hyundai is in good spot to consider as a long trade.
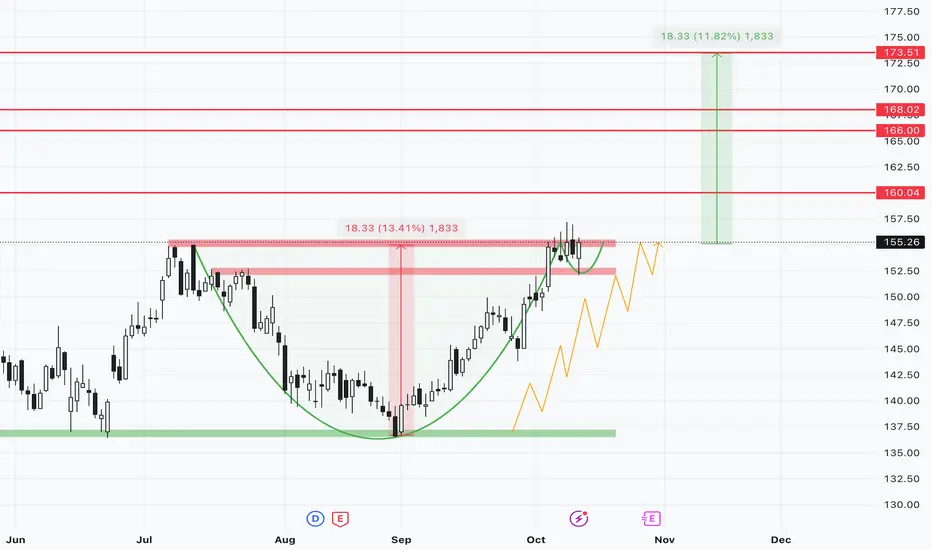
IOC - Potential breakout swing candidateChart Analysis :
Price sustaining near its major resistance of 155 and gave a retest today near 152 level. If breaks out and sustains 1hour above 156 can consider for long. Following a Cup and Handle pattern with Higher Highs intact from recent September lows.
Key Levels :
Support : 152/150
Resistance/Targets : 157/160/166/168/173
StopLoss: 150 Closing basis
Disclaimer:
I am not SEBI registered. This analysis is for educational purposes only and not investment advice. Please do your own research before trading or investing.
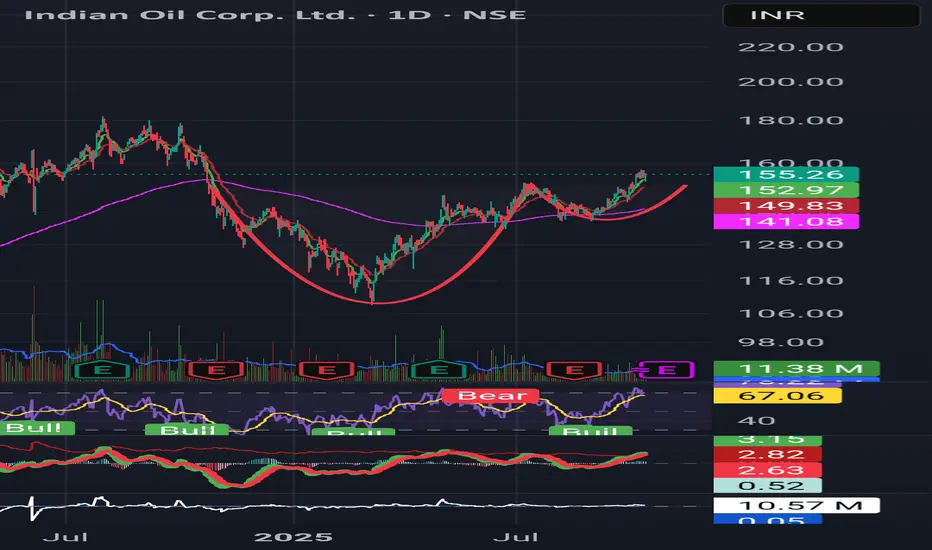
IOC forming a strong cup-and-handle breakout. IOC looks strong technically — cup-and-handle breakout on daily chart, trend intact across timeframes.
CMP 155-156;
stop 148.8;
target 180.
Trend supported by momentum & EMAs.
📈 RSI > 65
✅ MACD bullish
📊 Holding above ₹148.8 keeps the trend
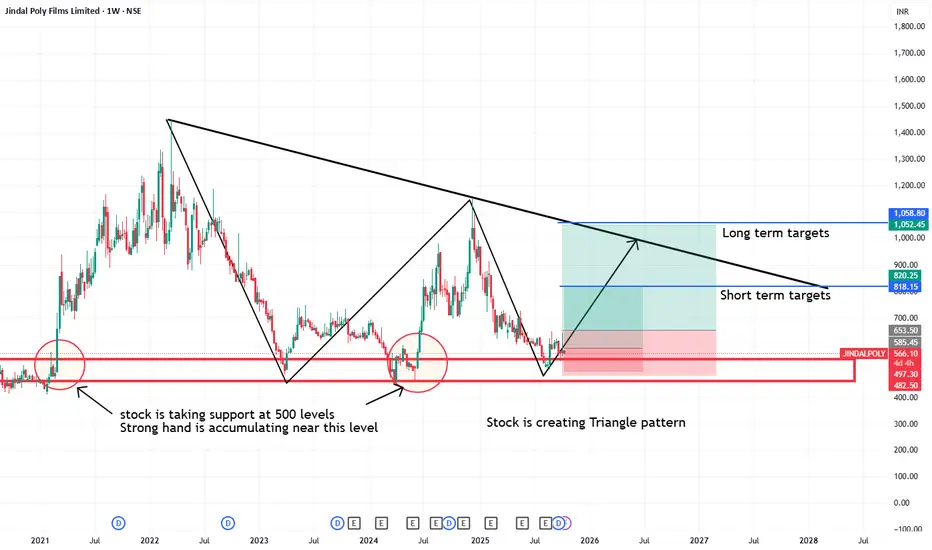
Jindal poly creating triangle pattern stock is taking support at 500 levels
Strong hand is accumulating near 500 level
Good triangle pattern is forming
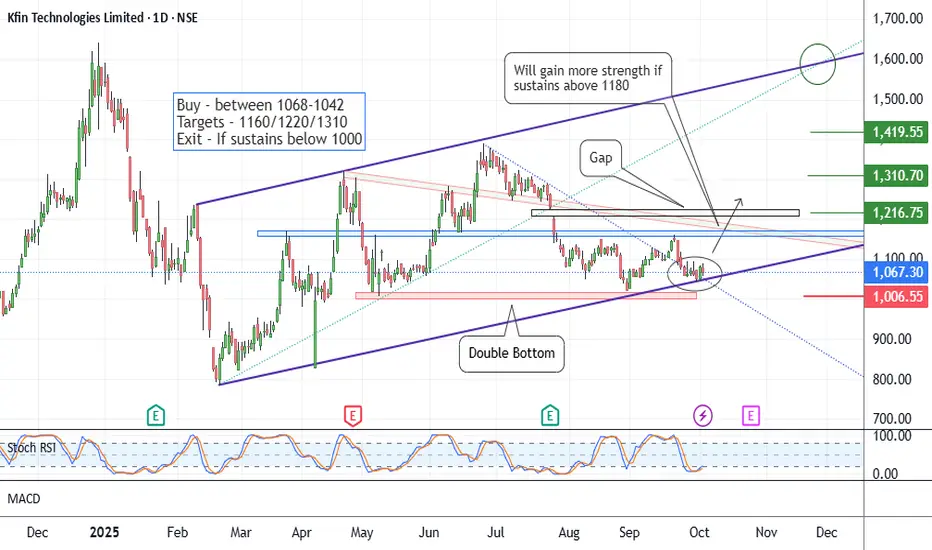
Kfin Tech - Low Risk Long SetupCMP 1067 on 04.10.25
All important levels are marked on the chart.
The price has been traveling in a parallel channel and presently resting at the lower edge of the channel.
Also, a double bottom pattern was formed, with a bottom of around 1000.
First target is 1160, considering the stop loss of 1000.
If it crosses 1180 and sustains above, it will gain more strength.
If it sustains below 1000 levels, the setup will go weak.
One should keep the position size in accordance with the risk capacity.
All these illustrations are only for learning and observation purposes; they should not be considered as trading recommendations.
All the best.
BSE Ltd break out.BSE Ltd breaking out of the falling trend.
Bullish divergence on RSI
RSI Breakout post few months.

GMR Airports Ltd – Bullish Bounce from Support ZoneThe chart of GMR Airports Ltd (Daily timeframe) is showcasing a well-respected ascending channel pattern, where price is currently bouncing off the lower support trendline, indicating a continuation of the bullish structure. This setup provides a compelling long opportunity if confirmed with price action.
• Uptrend Channel Structure Remains Intact
GMR Airports has been moving within a clearly defined uptrend channel with multiple touches at both resistance and support zones. The current bounce is happening near the support line, which has previously acted as a strong reversal point — suggesting that buyers are stepping in again.
• Twizzer Bottom Candlestick at Support
A key bullish candlestick pattern, the Twizzer Bottom, has formed right at the trendline support. This candlestick combo is known for reversal potential, especially at critical zones like this. The confluence of support + reversal pattern adds strong conviction to the bullish setup.
• EMA Support Alignment
The price also aligns closely with the 50-day EMA (blue line) and is above the 200-day EMA (red line) — a typical bullish sign in trend-following strategies. This alignment reinforces the uptrend bias and increases the odds of an upside continuation.
• Upside Targets Clearly Marked
- The initial target is placed at ₹93+, which corresponds to the last swing high.
- Target 2 is marked at ₹97+, aligning with the 52-week high.
- If price breaks through the upper resistance channel with momentum, the final target may extend higher, potentially entering price discovery mode.
• Risk Management is Well Defined
- The stop-loss is marked below ₹85, just under the previous swing low and trendline support.
- A close below this level will indicate a long setup failure, and the structure will need re-evaluation.
- This gives a favorable risk-reward ratio for swing traders entering at current levels.
• Conclusion – Watch for Momentum Confirmation
If follow-through buying occurs in the coming sessions, this could lead to a sharp upward move back toward the upper channel resistance. Traders should wait for volume expansion and strong candle closure above ₹88 for further confirmation. The overall bias remains bullish until the lower channel is broken convincingly.

Nifty Double bottom Nifty is being oversold and making a double bottom in 1 hr time frame. If it breaks the neckline that is the blue line as you can see in the chart, one may go for long with target 24950 with SL of 24650.
Disclaimer - This is just for educational purposes.
Jai Shree Ram.

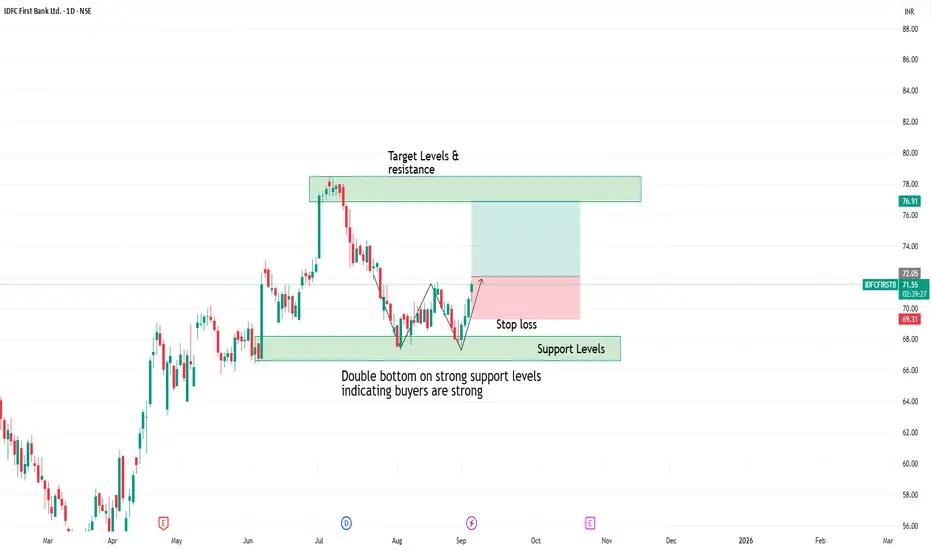
Double bottom created in idfc first bank Double bottom created on support levels
which indicates buyers are strong and accumulating at support levels
one can observe this for upside movement with strict stoploss
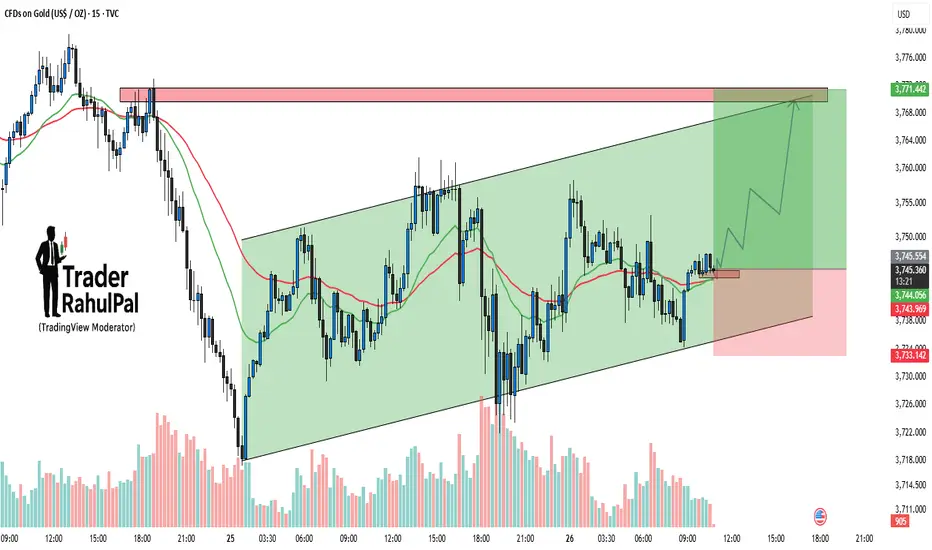
Gold – Channel Support Holding, Upside Target Towards 3770Gold is trading within a well-defined ascending channel on the 15-min chart. Price action has repeatedly respected both support and resistance lines, which makes this pattern highly reliable in the short term. Currently, the price is bouncing from the lower channel support and holding firmly above the 3740–3743 zone. As long as this support area is protected, the bullish momentum remains intact and the next upside target comes in around 3770, aligning with the channel resistance. A breakout above 3770 could trigger an even stronger rally, while a failure to hold below 3733 would invalidate the setup and shift the bias to the downside.
Disclaimer: This analysis is for educational purposes only and should not be taken as financial advice. Please do your own research or consult your financial advisor before investing.
Analysis By @TraderRahulPal (TradingView Moderator) | More analysis & educational content on my profile
👉 If you found this helpful, don’t forget to like and follow for regular updates.
XAUUSD Facing Downward PressureHello traders, XAUUSD is currently facing downward pressure following recent economic news. The lower-than-expected unemployment claims data suggests economic stability, reducing the demand for gold. The higher-than-expected PCE core index increases the likelihood that the Fed will maintain high interest rates, putting pressure on gold prices. While the US GDP remains stable , there is no strong breakthrough.
Technically, XAUUSD is in an uptrend but has encountered resistance at $3,790 . The price of gold is currently testing support at $3,700. If this level is broken, gold could fall to the $3,635 region.
Given the current fundamental and technical factors , the likelihood of XAUUSD continuing to decline is high. If support doesn't hold, gold could continue to drop.
Wishing you successful trading!
