Gold Soars: Will a Weak USD Open the Door for New Highs?Hello traders, it’s clear that gold is rising sharply, supported by the weakening of the USD. Can gold continue to conquer new highs?
On the chart, the price is moving within a clear upward channel. The key support level at 3,750,000 has been tested multiple times, and if the price holds above this level, gold could continue rising towards 3,827,000. The areas near recent highs also show an increase in trading volume, reinforcing the bullish trend.
Forecasts indicate that the U.S. labor market is slowing down, with 233K jobs created, slightly higher than the previous 231K. This weakens the USD, creating an opportunity for gold to continue its rise, as gold typically benefits from a weaker USD.
With strong technicals and a weakening USD, XAU/USD could continue its upward momentum. Get ready for some exciting opportunities!
Longsetup

BTCUSDT Set to Explode: Strong Uptrend Ahead!Hello everyone, today we’ll analyze an exciting opportunity with BTCUSDT, evaluating its strong uptrend and the potential to reach new highs.
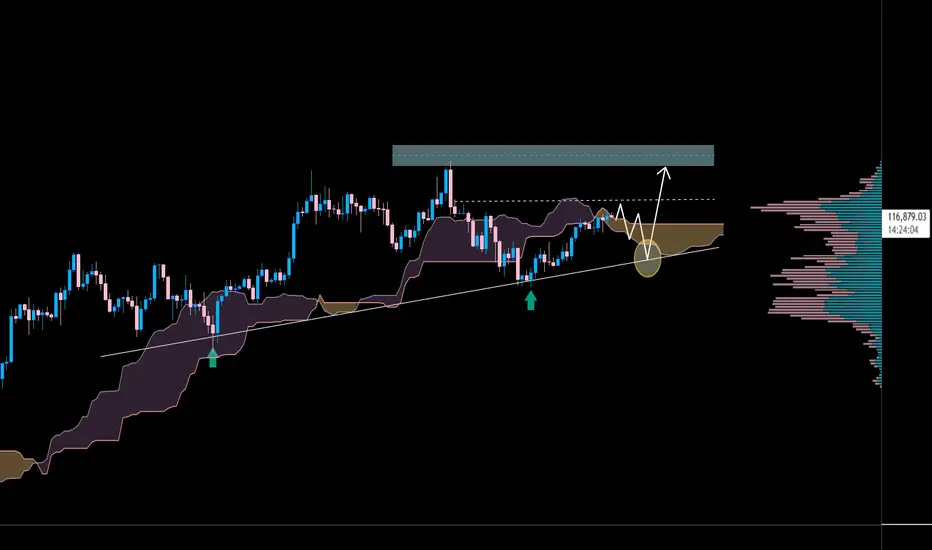
BTCUSDT is trading on a strong upward trendline , with support levels at 110,500 and a high target of 123,700. The chart shows a breakout from an important resistance zone, with the price also positioned above the Ichimoku cloud , reinforcing the bullish trend.
Capital inflows into Bitcoin ETFs and the Fed’s decision to cut interest rates have created a favorable environment for Bitcoin , making the possibility of reaching new highs even stronger.
With favorable technical signals and macroeconomic factors , BTCUSDT is likely to continue its strong upward movement. However, always check support levels to manage risk effectively.
Wishing you successful trading!
Silver’s Bullish Cycle: Zones to Buy, Levels to Aim ! Silver is running one of its strongest bullish phases in recent years, having broken through key ranges and now holding around the mid-43s with momentum still intact. The structure shows that 42.7 is the immediate support staying above this level keeps short-term bulls in control. Once pressure mounts, the wider zone between 40 and 41 is where the market is Trend to react with macro catalysts, whether it’s Fed commentary, shifts in the dollar, or changes in yields. This zone is less about weakness and more about price discovery, often a place where institutional demand re-enters. A deeper correction cannot be ruled out, and the 37 region stands out as the medium-term load-up zone, where longer-term players will rebuild exposure. On the upside, silver has scope to stretch toward 44.9, and once momentum extends further, the 47.8 handle comes into play. From a macro perspective, the trend is supported by a weakening dollar, softer yields, and the Fed’s slow shift toward deeper rate cuts, while silver’s dual role both as a safe-haven and an industrial metal tied to the energy transition gives the rally added structural strength. Taken together, the bias remains firmly higher, with dips into support zones offering opportunities rather than threats. Trade safe!
Key Levels to Watch:
Immediate support: 42.7
Reaction zone: 40.0 – 41.0
Medium-term load up zone: 37.0
Upside targets: 44.9 and 47.8

Gold’s Medium-Term Play: From Momentum Peaks to Reload Zones!!Gold’s rally has been relentless, breaking out of ranges and pressing higher into the 3750s. That strength reflects the macro backdrop where the Fed is walking a fine line: inflation is sticky, growth signals are uneven, and market expectations are already pricing a deeper rate-cut cycle. Yields have softened, the dollar has lost some shine, and capital continues to flow into safe-haven trades. All of this leaves gold well supported in the medium term, though the path forward will not be a straight line.
Target Zone (3827–3840):
The immediate stretch for bulls sits higher around 3827–3840. This is where the rally could stall as momentum traders lock in profits. A clean break and hold above this zone would open the door to new all-time highs, but the market could just as easily treat it as a ceiling before pulling back.
Hidden Bounce Zone (3720–3680):
Sitting just under the current price is a pocket that often acts as a liquidity trap. Markets can bounce sharply from here or slice through with equal speed. For active trades this zone will give the first clue whether momentum is running out of steam.
High-volume Zone (3630):
This level is the backbone of the current structure. Holding above it keeps the broader trend intact. A decisive break below, however, signals that the correction phase has started and the market is hunting for deeper liquidity.
Correction Band (3600–3560):
If gold slips into this range, expect chop and sideways action as weak longs get flushed out and new buyers gradually step in. This zone isn’t where the story ends, but where the market catches its breath.
Medium-Term Reload Zone (3440–3480):
This is the level that matters for swing trades. If a deeper washout comes, this area offers the opportunity to reload positions for the next major leg up. The medium-term backdrop still favors higher prices, with rate cuts, a weaker dollar, and central bank demand forming a strong tailwind.
Macro Picture
Fed Outlook: Committee members are split, but the overall tone is tilting toward easing as growth cracks widen. Powell may sound careful, yet markets are already betting on more cuts ahead.
Dollar and Yields: The dollar index remains pressured while U.S. yields edge lower, creating a supportive base for gold.
Global Flows: Central banks remain steady buyers, and geopolitical tensions continue to underpin safe-haven demand.
In short, gold has room to push into the 3827–3840 zone, but trades should prepare for corrective phases along the way. The hidden bounce pocket and HVZ will decide the near-term path. Should the market wash down into the 3440–3480 reload zone, it should be seen not as weakness, but as a prime setup to load into the medium-term bullish story. Trade safe!

XAU/USD: Sideway or Waiting for a Breakout?Hello traders, gold is currently in a clear sideways phase , moving within a narrow trading range between support at 3,652 USD and resistance at 3,700 USD. The chart shows that gold continues to fluctuate in this area without any signs of a strong breakout.
Although there is no major immediate news impact, the recent Fed rate cut has created a slight bullish bias for gold, as it continues to be viewed as a safe-haven asset in a low-interest-rate environment. This may support gold in holding within the current range, with a slight upside potential if price stays above the 3,652 USD support level.
If gold breaks above the 3,700 USD resistance , the uptrend could continue. However, if it breaks below current support levels , the market may see a correction. We need to monitor market signals closely to determine any trend shift.

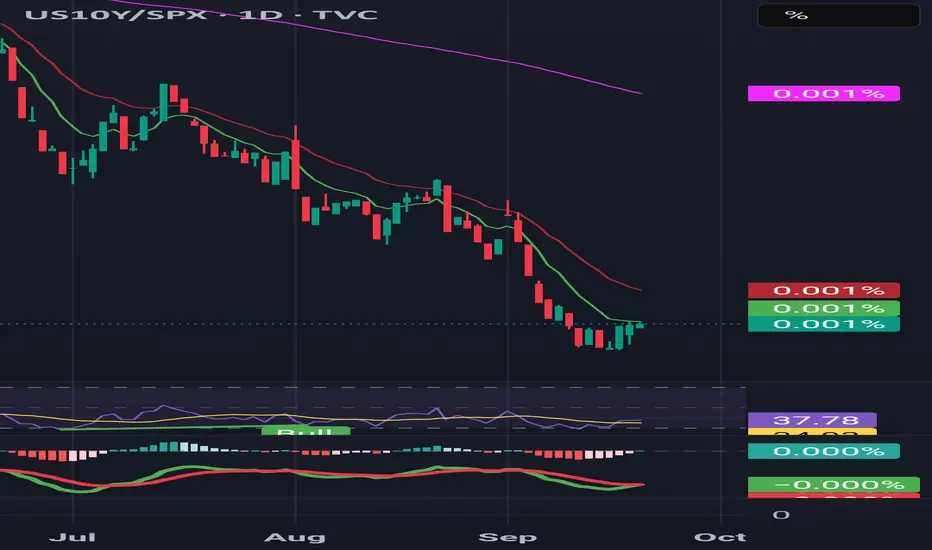
US10Y/SPX RATIO ANALYSIS The US10Y/SPX ratio has been crushed lower but is now trying to form a bottom. RSI is curling up from oversold, and MACD shows a potential bullish turn.
📌 Early signs that bonds may start regaining relative strength versus equities.
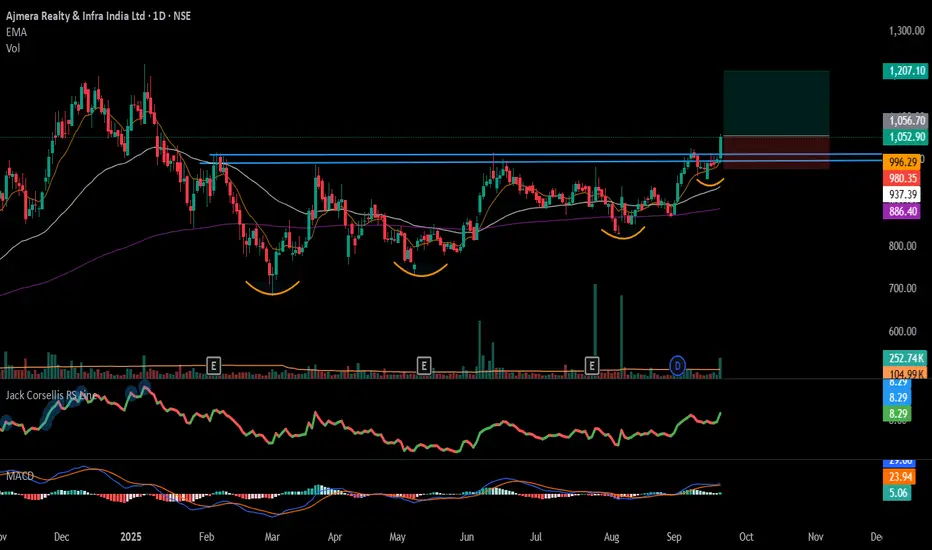
#AJMERA - VCP BreakOut in Daily Time Frame Script: AJMERA
Key highlights: 💡⚡
📈 VCP BreakOut in Daily Time Frame
📈 Volume spike during Breakout
📈 MACD Crossover
📈 Can go for a swing trade
BUY ONLY ABOVE 1055 DCB
⏱️ C.M.P 📑💰- 1052
🟢 Target 🎯🏆 – 15%
⚠️ Stoploss ☠️🚫 – 7.50%
⚠️ Important: Market conditions are Okish, Position size 50% per Trade. Protect Capital Always
⚠️ Important: Always Exit the trade before any Event.
⚠️ Important: Always maintain your Risk:Reward Ratio as 1:2, with this RR, you only need a 33% win rate to Breakeven.
✅Like and follow to never miss a new idea!✅
Disclaimer: I am not SEBI Registered Advisor. My posts are purely for training and educational purposes.
Eat🍜 Sleep😴 TradingView📈 Repeat 🔁
Happy learning with MMT. Cheers!🥂
XAUUSD: Sideway Trading Opportunity Before Further Decline?Hello, fellow traders! Today, we will analyze XAUUSD and identify a great trading opportunity in the sideway trend before gold could potentially continue its downward adjustment.
Yesterday, although the Fed cut interest rates to 4.25% as expected (4.25% compared to 4.50% previously) , the cut did not exceed expectations, reducing the outlook for further policy easing. The USD may no longer weaken , putting downward pressure on gold.
In addition, the unemployment claims data came in lower than forecast (231K vs. 241K) , indicating a strong labor market, which will support the USD. When the USD strengthens, gold typically faces downward pressure, meaning gold prices could fall further if the USD continues to strengthen.
Gold is facing strong resistance at 3,700 , showing signs of a decline. The 3,660 zone is a key rebound level, and if support at 3,600 is not broken, gold could trade sideways before continuing the downward trend. Low trading volume and flow of funds suggest that the sideway trend could continue in the short term.
Don’t forget, our trading strategy needs to be flexible, seizing opportunities, and never missing any market changes.

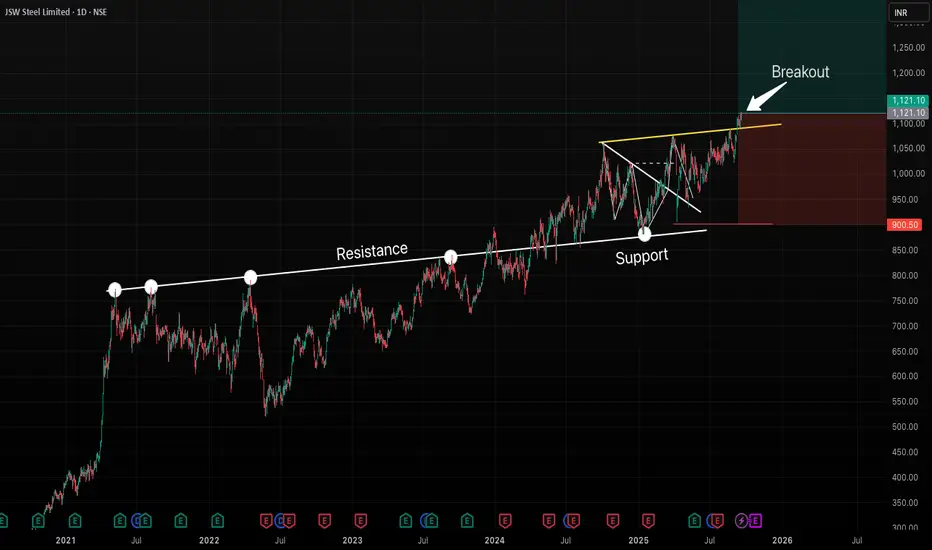
JSWSTEEL - Major Breakout After Long ConsolidationFrom May 2021 to April 2024, JSW Steel consistently faced resistance from the same trendline, rejecting multiple times.
In April 2024, price finally broke out above this resistance zone. After the breakout, the stock came down for a pullback and perfectly respected the same line, which has now flipped into support.
During this pullback, a minor downtrend was visible, but that too has been broken to the upside, showing a clear shift in momentum.
Now, the stock has given a strong breakout again (as shown in the chart). This indicates that the consolidation phase is over and it's going to give a very good rally in coming weeks/months.
Conclusion:
This looks like a good buying opportunity, both for swing trading and long-term investment, as the price action suggests strength and continuation on the upside.
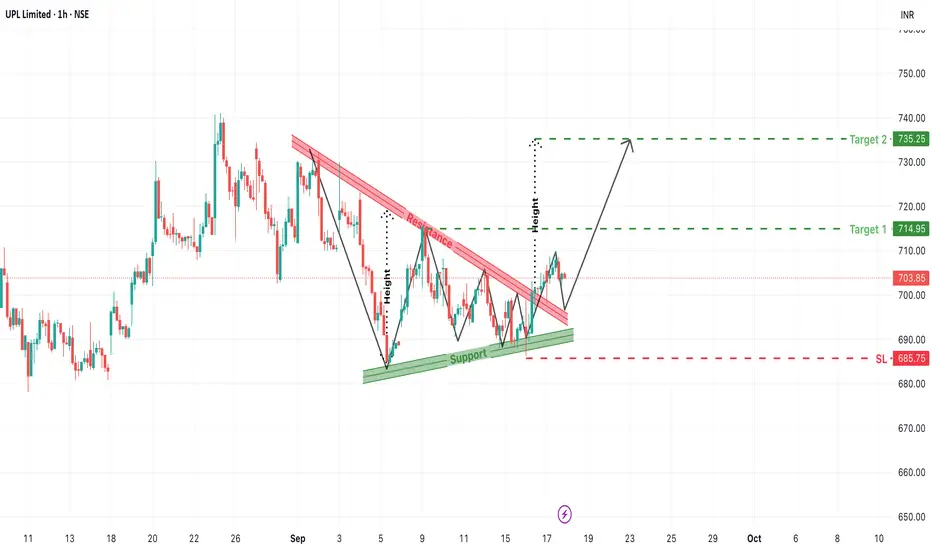
UPL Breakout from Falling Wedge: Bullish Continuation Ahead?The chart for UPL Limited (1-Hour, NSE) presents a promising bullish breakout scenario, emerging from a well-defined falling wedge (descending channel). Traders and investors watching for breakout opportunities will want to monitor this move closely as the price breaks above resistance with potential to test higher levels.
1. Chart Pattern Formation: Falling Wedge with Bullish Implication
Over the past several trading sessions, UPL consolidated inside a downward sloping wedge pattern characterized by:
- Lower highs and lower lows, creating a narrowing channel.
- The support trendline consistently held the price near 685–690 levels.
- The resistance zone, marked with a red trendline, was tested multiple times before finally breaking out.
- This kind of pattern often precedes a trend reversal or continuation to the upside, especially when it forms after a prior bullish move.
2. Breakout Confirmation: Clean Move Above Resistance
- Price has broken out of the descending resistance, closing above ₹703+.
- This breakout came with a retest of the support and is now showing signs of resuming upward momentum.
- The price structure now signals the end of the downtrend inside the wedge and potential bullish continuation.
3. Target Projections Using Pattern Height
The measured height of the wedge pattern provides us with two price targets:
- Target 1: ₹714.95
The first logical resistance and Fibonacci extension zone.
- Target 2: ₹735.25
Based on full height projection of the wedge breakout.
These targets are calculated from the breakout level and are aligned with historical price action levels.
4. Stop Loss and Risk Management
- Suggested Stop Loss (SL): ₹685.75
Just below the support zone and wedge structure to avoid false breakouts.
- Entry Zone:
Around current levels of ₹703–704 or on dips near ₹700–701 if retest occurs.
- Risk-Reward Ratio:
Around 1:2.5 for T2, offering good upside with controlled risk.
5. Key Technical Takeaways
- Pattern: Falling Wedge (Bullish Reversal/Continuation)
- Breakout Zone: ₹703+
- Support Zone: ₹685–688
- Momentum Bias: Bullish (as long as price holds above support)
- Risk Zone: Below ₹685
- Reward Zone: ₹715 to ₹735
Conclusion: UPL Gearing Up for a Short-Term Rally
UPL has triggered a classic technical breakout from a falling wedge, backed by a retest and bounce from support. As long as price sustains above ₹685, bulls may drive the stock toward the upper targets of ₹715 and ₹735. The chart offers a low-risk, high-reward setup ideal for short-term swing traders.
Indian Hotels Company stuck in a triangle?Currently, what appears to be a triangle unfolding in Indian Hotels, we may see a fall for a final wave e and then a bounce to make new highs.

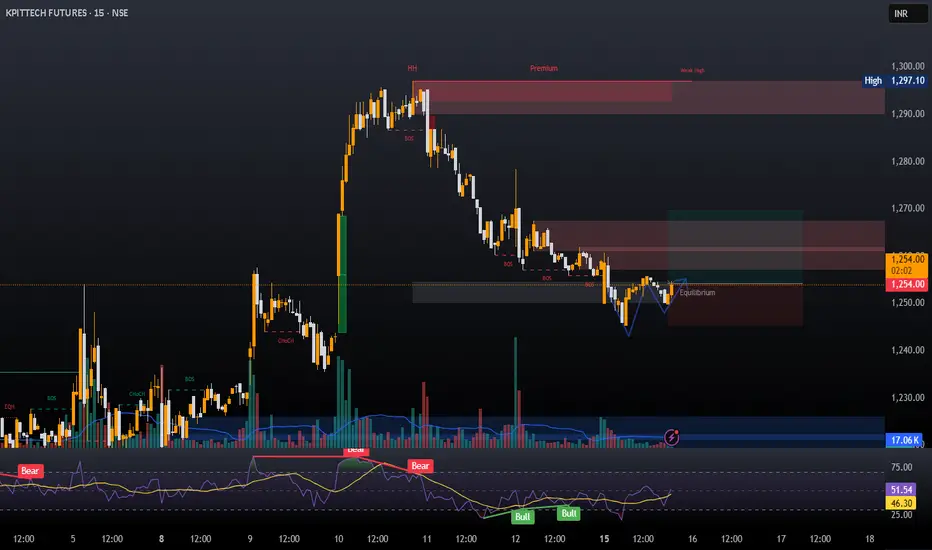
LONG IN KPITTECHA long trade can be taken in KPIT TECH. After a bullish run last week Kpit tech showed some profit booking but couldn't break the low of the candle from where it started its bullish reversal. Now it has formed a double bottom and hence a swing trade on the buy side can be taken.
Follow for more such analysis.
Entry- 1250-1254
Support- 1245-1242
Target- 1270, 1275, 1290
Disclaimer- This is just for educational purposes.
Jai Shree Ram
Hindware - Keep On WatchCMP 200 on 22.04.25
The stock price has dropped more than 60% since August 2023. This time, it has been consolidating in a narrow range for the last two months.
If it gives a move upside after this consolidation, we may see the price of 245,345 or even more.
One should buy wisely in the range of 200-180, keeping the stop loss levels in mind. If it sustains below 175, the setup will show weakness.
Keep the position size according to the risk management.
All these illustrations are only for learning and sharing purposes, not a buy or sell recommendation in any way. It is only for paper trading.
All the best.

Gold Breaks Out: Rising Buying Power Amid USD WeaknessMarket Context:
The higher-than-expected Unemployment Claims data (263K vs 235K) has weakened the USD, providing favorable conditions for gold to rise. The University of Michigan Consumer Sentiment and Inflation Expectations remain stable, but they do not significantly impact gold’s trend.
XAUUSD is showing a strong upward trend, with gold trading within a solid ascending channel. The support at 3,615.000 USD has been tested and confirmed, providing a stable foundation for further gains. After breaking the 3,650.000 USD resistance, gold has the potential to continue its breakout towards 3,700.000 USD, supported by strong buying sentiment and technical indicators backing the bullish trend.
We continue to see strong investor preference for gold as the USD weakens, especially amid expectations of economic stability.

XAUUSD: Breaking Through ResistanceXAUUSD is currently trading within a clear uptrend channel, with strong support at 3,620. The 1-hour chart shows that gold has bounced strongly from this support level, confirming that the uptrend remains intact. With support from EMA 34 and EMA 89, XAUUSD is likely to continue its upward momentum and target higher levels.
The current uptrend channel shows the price is moving within a clearly defined range, with higher lows consecutively forming. The next resistance is at 3,680, and if gold breaks through this level, it could extend its rise toward higher targets. The 3,620 level remains a crucial support, and as long as the price stays above this level, the chances of further increases are high.
Impact of News
With the forecasted PPI dropping from 0.9% to 0.3%, this could reduce inflation expectations and weaken the USD, providing favorable conditions for gold to continue rising.

Zyduslife - Near Breakout LevelsCMP 1013.85 on 07.09.25
All important levels are mentioned on the chart.
For a year, the level of 1030 has been acting as a resistance zone.
The price has formed a Cup & handle pattern. Presently nearing the level of breakout.
If it sustains above 1030, it will gain strength.
If it sustains below 980-970, the setup will weaken, and the exit plan should be exercised.
Possible targets are 1120/1170+.
All these illustrations are only for educational and sharing purposes. It should not be considered as a buy or sell recommendation.
All the best.

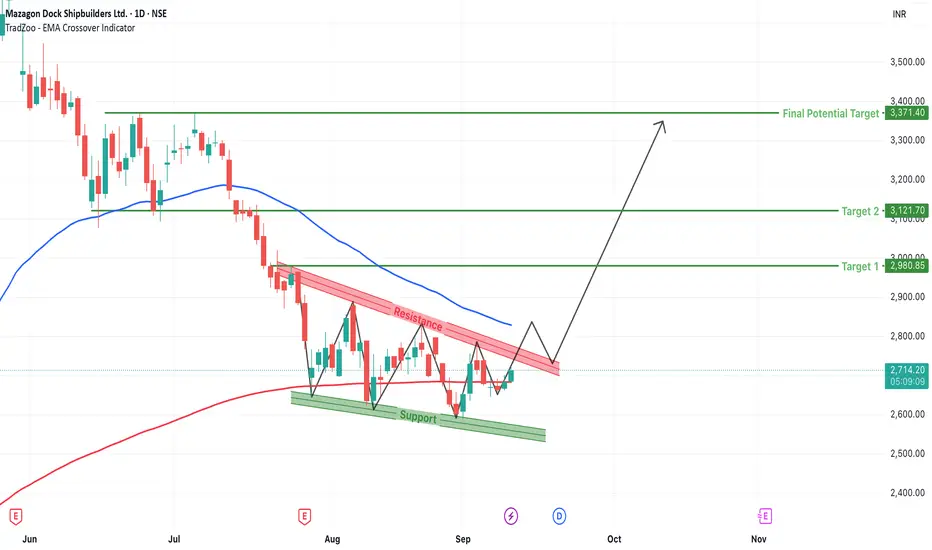
Mazagon Dock (MAZDOCK) Breakout Watch: Falling Wedge FormationMazagon Dock Shipbuilders Ltd., one of India’s premier shipbuilding companies, has recently shown signs of a technical breakout after months of downtrend. The stock had been consolidating within a falling wedge structure—a well-known bullish reversal pattern—and is now approaching a critical breakout zone that traders should closely watch.
Let’s analyze the technical setup in detail.
1. Formation of the Falling Wedge Pattern
The chart clearly highlights a falling wedge, which is formed by drawing two converging trendlines: one descending across the highs (resistance) and the other descending across the lows (support). The falling wedge is typically a bullish reversal pattern, especially when it forms after a prolonged downtrend—as is the case here.
From mid-June to early September, MAZDOCK trended lower, respecting the wedge boundaries. However, instead of a complete breakdown, price started finding support near the ₹2,500–2,600 zone, forming higher lows within the wedge—a subtle early sign of a reversal brewing beneath the surface.
2. Key Resistance and EMA Confluence
The immediate overhead resistance is defined by the upper boundary of the wedge, which is also in confluence with the 200-period EMA, currently placed around ₹2,830. This makes the ₹2,820–₹2,840 zone a crucial breakout level.
Once price convincingly breaks and closes above this level with volume confirmation, it could trigger a fresh upside rally. The current price action around ₹2,720 (+1.34%) on the breakout candle indicates building momentum.
3. Projected Targets After Breakout
Upon successful breakout, the measured move (based on wedge height) gives us three major targets:
Target 1: ₹2,980
This level is close to the psychological ₹3,000 mark and would be the first hurdle where partial profit booking may be considered.
Target 2: ₹3,121
A further extension of the breakout move. This level marks previous minor resistance and could act as a midpoint of the rally.
Final Potential Target: ₹3,371
This target is based on the maximum height of the wedge added to the breakout zone and also aligns with a historical resistance zone. A rally to this level would indicate complete bullish validation of the pattern.
4. Trade Setup for Traders
This breakout provides a favorable risk-reward opportunity for swing and positional traders. Here's a sample trade plan:
- Entry: On breakout and close above ₹2,830 (above wedge and EMA)
- Retest Entry: On pullback to ₹2,790–₹2,810 with confirmation candle
- Stop-Loss: Below ₹2,650 (invalidates the breakout structure)
- Targets: ₹2,980 / ₹3,121 / ₹3,371
- Risk-to-Reward Ratio: Approximately 1:2.5 to 1:3.5
5. Risk Management and Trader Tips
While this setup looks promising, wait for confirmation before jumping into the trade. Many false breakouts can occur, especially around key EMAs. Also, keep an eye on volume: a genuine breakout should be accompanied by higher-than-average volume.
Other tips:
Scale-in your position rather than going full size at entry.
Keep trailing your stop-loss as the price moves in your favor.
Monitor broader market indices for sentiment cues (Nifty, Bank Nifty).
6. Conclusion: A Reversal Candidate Worth Watching
Mazagon Dock has not only respected technical levels within the wedge but is also showing strength around a key resistance–EMA confluence zone. This kind of setup, supported by a classic pattern like the falling wedge, adds more credibility to the potential move.
With clear targets and a defined stop-loss zone, the current price structure offers a high-probability reversal setup. Patience is key—let the breakout confirm itself.
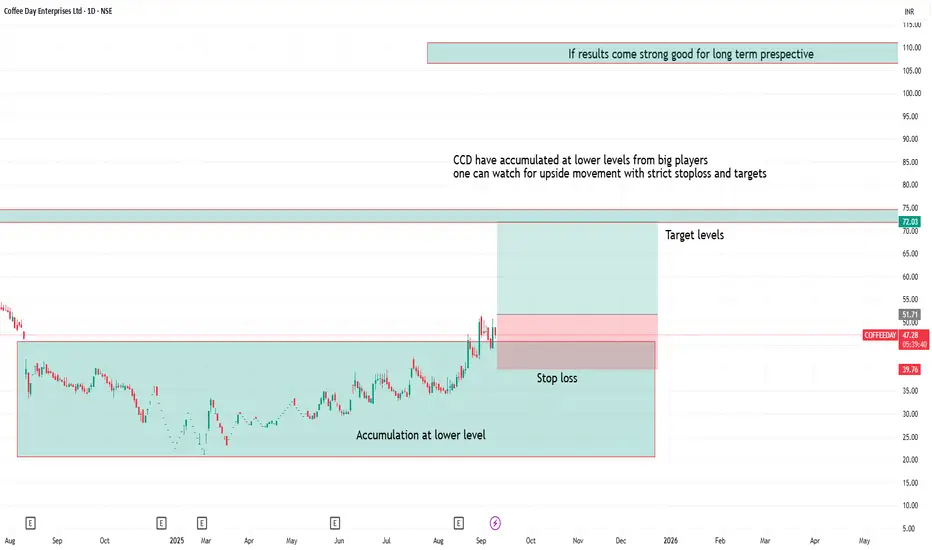
CCD showing accumulation 1. CCD is showing accumulation at lower levels with big players
2. If result comes strong then stock can give good returns in long term
3. one can observe for upside movement with strict stoploss and targets
SOMI 1H LONG Set upCurrent Price: Around 1.5764 USDT, trading slightly bearish (-4.51%).
• Setup:
• A long trade setup is marked with risk/reward box (green zone above, red zone below).
• Entry Zone: Around 1.56 – 1.58 USDT (current price).
• Stop-Loss (SL): Around 1.55 – 1.42 USDT (marked red levels).
• Target (TP): Around 2.50 USDT (green box top).
• Key Levels:
• Resistance 1: 1.80
• Resistance 2: 1.89 – 1.90 (previous high)
• Major Target: 2.50
• Support Zone: 1.55 – 1.42
• Indicators:
• Moving averages (short-term) are shown, price is consolidating around them.
• Volume is relatively higher before consolidation, suggesting accumulation.
📌 Summary:
This chart shows a bullish setup with a long entry around the current consolidation zone (1.56–1.58). If price holds above 1.55, potential upside target is 2.50. But if it breaks below 1.55, downside risk extends to 1.42.

Hemi 4H Bullish Play • Pair: HEMI/USDT (Perpetual Futures)
• Timeframe: 4H (4-hour chart)
• Current Price: Around 0.03724 USDT
• Price Movement:
• The price is consolidating just below a resistance zone at 0.0402 – 0.0403.
• A recent bullish push attempted to break this level but got rejected.
• The support zone is near 0.0369 – 0.0370.
• Chart Setup:
• A long position trade is set up with entry around 0.0372 USDT.
• Stop Loss: Around 0.0369 USDT (tight SL just below support).
• Target (TP): Extends upward to nearly 0.085 USDT (suggesting a high reward-to-risk ratio).
• Indicators:
• Moving averages (yellow, red, blue lines) are starting to slope upward, suggesting bullish momentum.
• Volume spikes show active trading interest around the breakout attempts.
• Observation:
• If the price breaks and sustains above 0.0403, strong bullish momentum could follow.
• If rejected again, it may retest 0.0369 – 0.0370 support.

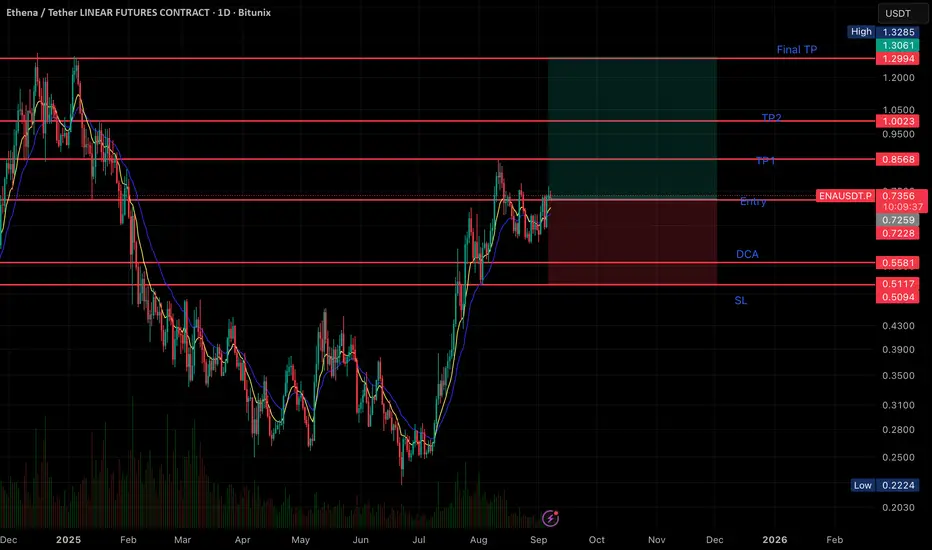
ENA Long Set Up swing or spot only🔹 Chart Setup
• Current Price: 0.7341 USDT
• Trend: Price has been recovering strongly after a bottom in June and is consolidating around the entry zone.
🔹 Key Levels
• Entry Zone: ~0.7341 USDT (current price is at entry).
• DCA (Dollar-Cost Average) Levels:
• 0.7229
• 0.6580
• 0.6082
• 0.5581
• 0.5117
• 0.5094
• Stop-Loss (SL): ~0.5094 USDT (below key support).
🔹 Take Profit (TP) Targets
• TP1: 0.8568
• TP2: 1.0023
• Final TP: 1.2994 – 1.3061
🔹 Trade Idea
• The setup is bullish, aiming for continuation of the uptrend.
• Risk management is built with multiple DCA support levels and a stop-loss under strong support.
• Reward-to-risk ratio looks favorable if price holds above entry and moves toward the TP zones.
DIA Long SetupSetup Overview
• Pair: DIA/USDT Perpetual Swap
• Timeframe: 2H
• Current Price: ~0.754
• Chart Type: Candlestick with moving averages
Key Observations
1. Support Levels
• 0.714 → Strong support zone (recent bounce point).
• 0.671 – 0.660 → Major support cluster.
• 0.647 → Recent swing low (strong bottom support).
2. Resistance Levels
• 0.795 → First resistance.
• 0.837 → Next resistance above.
• 0.870 – 0.871 → Target resistance zone (aligned with green TP zone).
3. Current Price Action
• Price has bounced from the 0.714 support and is trading above EMAs, showing short-term bullish momentum.
• The move suggests a potential push toward higher resistances if momentum continues.
4. Trade Setup
• Entry: Around 0.754 (current price).
• Stop-Loss (SL): Below 0.714 support (around 0.71).
• Take-Profit (TP): 0.795 → 0.837 → 0.870.
5. Risk–Reward
• The risk is defined below 0.714, while the upside potential stretches toward 0.87.
• This gives a favorable risk-to-reward setup if bullish continuation holds.
✅ Bias: Short-term bullish as long as price stays above 0.714.

XAUUSD – Gold Stalls as USD Regains StrengthThe ISM Services PMI was reported at 50.9, higher than the previous 50.1 and still above the 50 threshold – indicating that the U.S. services sector remains in expansion. This is a sign that the U.S. economy is still resilient, and the USD immediately benefited. With a stronger dollar, it’s natural for gold to come under corrective pressure.
On the 8H chart, after a sharp rally, XAUUSD was capped at the 3,579 USD resistance . From there, price showed a reversal signal and started to retreat. The nearest support lies around 3,465 USD, and if this level is broken, the probability of a deeper decline increases significantly – especially as the fundamentals continue to favor the greenback.
In the short term , I favor a bearish scenario: sell while price stays below 3,579, targeting 3,465. Only a clear close above 3,579 would bring the bullish outlook back, but for now, gold looks set for a correction.
