Syngene International Ltd not looks good below 439Below 439 target 212.55
Weak Q3 Results (Jan 2026): The company reported a sharp decline in profits, with margins squeezed due to biologics destocking. This disappointed investors and triggered a sell-off.
Revenue Guidance Miss: Analysts had expected ~15% revenue growth for FY26, but Syngene guided only for single-digit growth, leading to cuts in EBITDA expectations.
Brokerage Downgrades: Major firms like Jefferies and Goldman Sachs reduced their target prices, citing margin pressures and slower growth outlook.
Bearish Market Sentiment: The stock hit multiple 52-week lows in late January 2026, with open interest in derivatives surging — a sign of strong bearish positioning by traders.
Longterm

NDLVENTURE | Long-term Investment IdeaStock Name: NDLVENTURE
📊 Breakout Context: Weekly trendline breakout confirmed with strong volume today, adding conviction.
TRADE PLAN
💰 Buy near CMP: 100
🎯 Target: 180 (+80.0%)
🛑 Stop Loss: 84 (-16.0%)
⚖️ Risk/Reward Ratio: ~1 : 5.0
🔑 Key Notes
📌 Strong volume breakout suggests genuine momentum; monitor for retests.
📍 Healthy retest zone: 95–100 (as long as price holds above stop loss).
🔒 Trail stop loss upward as price advances to secure gains.

Buy in deep Opportunity SCIShipping Corporation of India Ltd presents a compelling mid-term buy opportunity near the critical 204 support, reinforced by a double bottom pattern on the daily chart. As a government-owned PSU in the booming shipping sector, it benefits from rising global trade volumes and India's maritime growth, trading at a fair P/E of ~12 amid recent corrections.
The chart confirms a double bottom at ~204, with bullish divergence in RSI/MACD oscillators signaling exhaustion of sellers. Key support holds at 200-204 (200-SMA nearby), while resistance eyes 215-220; a break above 211 could target 230-250 in 4-8 weeks. Oversold RSI (<20) and rising volume on lows support reversal potential.
SCI maintains robust ~30% OPM consistently, driven by fleet modernization and demand in crude tankers/container segments amid global trade recovery. At ₹205 (P/E 12.2x, P/B 1.16x), valuation corrects to fair levels vs. sector averages; dividend yield ~3% adds appeal. Govt backing ensures stability in expanding markets like LNG and offshore services.
Deep correction (-45% from all time highs) aligns with sector rotation; entry 200-205 with SL as per risk capacity, targeting 250 and more upside.
Better to take view for buy and hold for long term

Long investment candidate taking a major support.Trading at a PE under 25 , revenue focus from Europe, the company has posted has reported solid revenue and profit growth in recent quarters. $BALU can be a multibagger in a few months.

Whirlpool possible double bottom reversal zoneA possible potential revrsal zone for Whirlpool , half bat structure is in formation waiting for a double bottom reversal and the stock is also trading at an important support zone . Once half bat point B is breached a very fast move can be expected in stock. Do your own research before investing. This is not a buy or sell advice.

#ADANIENT – Massive Head & Shoulders Breakdown Loading?ADANIENT is completing a major weekly H&S pattern 👤, with price sliding toward the neckline.
It’s now sitting on the critical support zone: 1966–2078 ⚠️
A WCB below this zone can trigger a 50%+ fall, potentially revisiting the previous lows below 1000 📉 💣
Trend stays weak unless it reclaims 2614 on WCB. Stay alert! 👀
#ADANIENT #HeadnShouldersPattern #ChartPattern #PriceAction
📌 #Disclaimer: This analysis is shared for educational purposes only. It is not a buy/sell recommendation. Please do your own research before making any trading decisions.

#KAYNES Hits Short-Term Support — Bigger Levels Ahead!📉 🚨
KAYNES is trading inside a falling channel and just tested the bottom of the yellow channel , triggering a short-term bounce 🔄
But this isn’t a long-term support zone — no bottom fishing here!
Price can still slide toward 3113–3249 or even 2158–2362 , where true bottoming signals may appear 👀
Resistances: 5318–5476 / 4457–4650
Supports: 3726–3825 / 3113–3249 / 2158–2362
Stay cautious and wait for real reversal signs, not the CMP bounce ⚠️
#KAYNES #NSE #BSE #PriceAction #TechnicalAnalysis #TrendAnalysis #LongTerm
📌 #Disclaimer: This analysis is shared for educational purposes only. It is not a buy/sell recommendation. Please do your own research before making any trading decisions.

Engineers India Price Analysis for Dec 2025 to Mar 2026Stock has shown support in 166-175 region during Mar - Apr 2025 period. It went on to reach a high of 250 by mid-july 2025.
It is likely to take support as the uptrend trendline and support area are likely to converge again anytime during the period Dec 2025 to Mar 2026. As shown in the chart.
Entry, SL and 3 likely Targets are projected on the charts.
Please check with your financial adviser before investing.
Happy Investing!

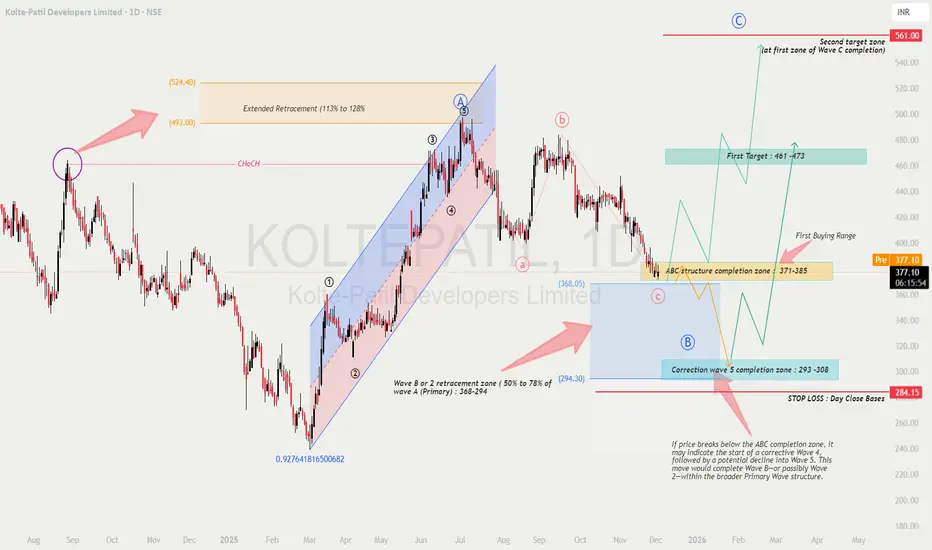
KOLTEPATIL - Wave Analysis
Educational breakdown based solely on chart structure
🔍 1. Chart Findings & Market Structure
The chart shows a clear Elliott Wave progression, where the previous impulse (Primary Wave A) topped near ₹493–524, followed by a corrective ABC decline.
✔ Key Observations
Primary Wave A formed an impulsive rally inside a rising channel.
The price later broke structure (CHoCH) indicating loss of momentum.
Current price (₹377) is trading inside the ABC structure completion zone of ₹371–385, a critical decision area.
A deeper correction toward ₹293–308 remains possible if Wave C extends.
🎓 2. Educational Points (Why These Levels Matter)
📘 A. Extended Retracement Zone: 113–128%
The chart marks ₹493–524 as the extended retracement area, which often acts as:
A wave A termination area
Strong reversal zone
Liquidity grab region
This supports the idea that the major impulse from March–July is complete.
📘 B. Wave B / Wave 2 Retracement
A natural correction for Wave B or Wave 2 typically pulls back 50–78% of the previous impulse.
This gives the ₹368–294 broad range as the acceptable retracement.
📘 C. Completing Wave C (Corrective ABC)
Wave C generally equals Wave A or 1.272–1.618 extension of Wave A.
The chart’s projection supports a potential completion:
First zone: ₹371–385 (current test)
Final zone: ₹293–308 (if extended C-wave unfolds)
📉 3. Current Price Action Insight
Price is currently hovering near the ABC structure completion zone (₹371–385).
No strong bullish reversal candle is visible yet—indicating buyers are waiting for confirmation.
Price remains in a downward corrective structure, but nearing exhaustion.
This phase is ideal for planning, not rushing.
🔮 4. Future Prediction Based on Wave Theory
Two scenarios emerge:
🟦 Scenario 1: ABC Correction Completes at Current Levels (₹371–385)
If the current demand zone holds:
Price forms a wave B bottom and begins Primary Wave C upward.
Expected targets:
🎯 First Target: ₹461–473
🎯 Final Target: ₹561 (Primary Wave C completion zone)
🟥 Scenario 2: ABC Correction Extends to ₹293–308
If ₹371–385 fails:
Market enters the correction wave 5 completion zone (₹293–308).
From this demand block, a stronger bullish reversal is expected.
Long-term bullish structure remains intact if it stays above ₹284 (stop level).
🛒 5. Buying Strategy (Educated Approach)
🟩 FIRST BUYING RANGE: ₹371–385 (Conservative Entry)
Enter only if:
Strong bullish candle (engulfing / pin bar / OB reclaim)
RSI bullish divergence
Price closes above structure high (minor CHoCH)
🟦 SECOND BUYING RANGE: ₹293–308 (High-Value Entry)
A deeper correction provides:
Lower risk
Maximum R:R
Stronger probability of reversal
Use this zone if the first one fails.
⚖ 6. Risk–Reward Analysis
If entering at ₹371–385
Stop-Loss: Below ₹284 (daily close basis)
Upside Potential: Up to ₹561
Reward : Risk Ratio: Approx 3.5–4.2 R
If entering at ₹293–308
Stop-Loss: Below ₹284
Upside Potential: Up to ₹473–561
Reward : Risk Ratio: Approx 5–7 R (excellent)
🔐 7. Confirmation Strategies for Better Entries
Use any two or more of the following:
✔ 1. Market Structure Shift
Wait for a CHoCH above the last swing high inside the zone.
✔ 2. Volume Expansion
Rising green volume during rebound increases reliability.
✔ 3. Bullish Divergence (RSI or MACD)
Signals weakening sellers.
✔ 4. Break & Retest Method
Let price break a minor resistance
Enter on retest to confirm strength
✔ 5. Demand Zone Reaction
Look for:
Long tail candles
Absorption wicks
Order block reclaim
These indicate smart money interest.
🧠 8. Summary & View
The stock is in the final leg of a correction and is approaching highly reactive Fibonacci zones.
Structure favors a bullish wave (Primary Wave C) in the coming months if key support holds.
📌 First confirmation: Bounce from ₹371–385
📌 Strongest bullish case: Reversal from ₹293–308
📌 Invalidation: Close below ₹284
The long setup has strong wave logic, clean levels, and attractive R:R.
⚠️ Disclaimer
This analysis is for educational purposes only and reflects wave-structure interpretation based solely on the provided chart.
I am not a SEBI-registered analyst.
Please conduct your own research or consult your financial advisor before trading or investing.
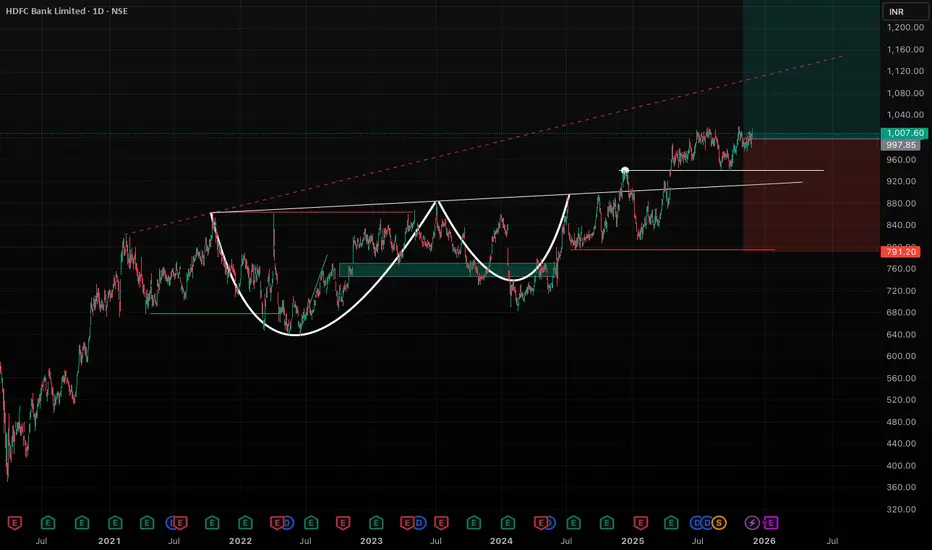
HDFC Bank: Massive Multi-Year Cup-and-Handle BreakoutHDFC Bank is showing a very bullish multi-year Cup-and-Handle breakout. Price has finally broken above the long-term horizontal resistance zone and is now retesting it as support. This stock is also in majority of mutual fund's top holdings, so this makes it a safer bet.
KAZIA THERAPEUTICS LTD SPONSORED ADRKZIA made double bottom with divergence with good volume and breakout at $4.45 with first target of $22.5, if and second target of $41.7 and with can expect strong resistance at $41.7 and reverse might happen. If KZIA did breakout at this level we can expect rally till $79.
Analysis is made on weekly time fame for long term view
It is just my chart analysis upto best of my knowledge. As it is share market anything happen because market effects on many things happen in the world.
Thank you

#UNIVPHOTO: Reversal Alert at Falling Channel Midline!CMP: 286
UnivPhoto found support ✅ & bounced strongly off the mid-line of the falling channel (245–266 zone), forming a textbook Morning Star on the weekly chart — a classic bullish reversal! ⭐️🔥
Now testing key resistance 310–337 + downtrend line. A breakout could fuel a rally to 484 → 747/818 → 988 (ATH) 🚀🚀
Could this be the end of the multi-year downtrend? Watch closely! 👀✨
#UNIVPHOTO #MorningStar #CandleStickPattern #PriceAction #LongTerm #Investing
📌 #Disclaimer: This analysis is shared for educational purposes only. It is not a buy/sell recommendation. Please do your own research before making any trading decisions.

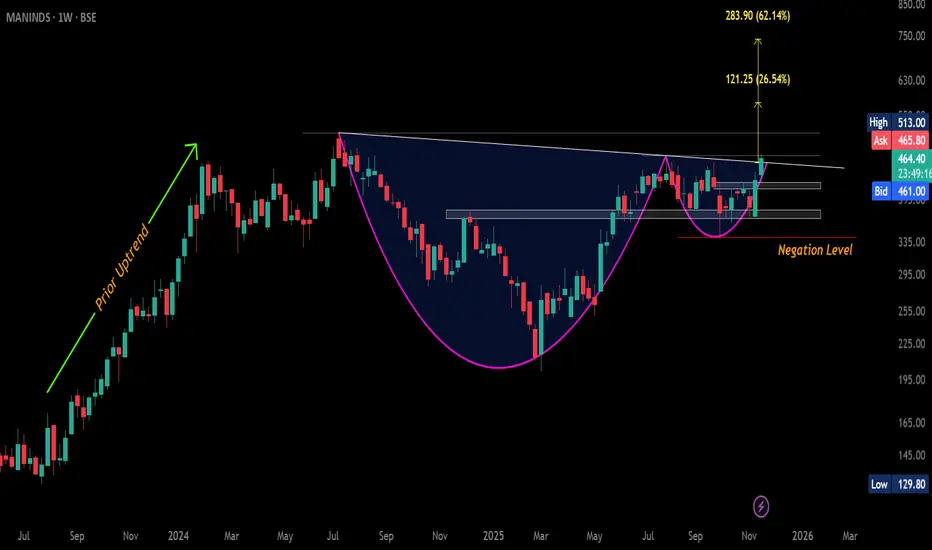
#MANINDS: Big Weekly Breakout Loading!CMP: 464.40
A large weekly cup-and-handle is taking shape, with a strong bullish candle signaling a breakout attempt.
🛡 Supports: 437 / 523 – 413 / 380 – 367
🚧 Resistances: 469 / 513 (ATH)
⚡️ Breakout Trigger: WCB above 469
🎯 Pattern Targets: 578 / 740+ (~26% & ~62% from CMP)
⛔ Negation: WCB below 340.90
#ManInds #CupAndHandle #ChartPattern #PriceAction #Breakout #LongTerm
📌 #Disclaimer: This analysis is shared for educational purposes only. It is not a buy/sell recommendation. Please do your own research before making any trading decisions.
#INDUSTOWER – Bullish Pennant on Monthly Chart#IndusTower | CMP: 402.20
A strong vertical rally built the pole , and price is now compressing inside a tight bullish pennant right below a multi-year resistance zone. Consolidation is nearly complete — big move loading .
🛡 Supports: 339–335 / 313–309 (Major Zone)
🚧 Resistances: 430 / 460 / 500 (ATH)
Dips toward 335 can be considered.
🎯 Pennant Breakout Targets (Pole Projection):
• 560
• 730+ (~ 78% from CMP)
A breakout above 500 could trigger the next explosive leg up.
🚀 High-probability bullish continuation setup. 🔥
#IndusTower #BullishPennant #PriceAction #ChartPattern #SwingTrading #LongTerm
📌 #Disclaimer: This analysis is shared for educational purposes only. It is not a buy/sell recommendation. Please do your own research before making any trading decisions.

#ANGELONE: Big Swing Setup Inside Falling Channel#AngelOne | CMP: 2,793.40
Trading inside a falling channel , after a successful retest of the 1949–2022 breakout zone .
Dips toward 2,341 can be considered.
🛡 Supports: 2133–2101 / 2022–1949 (Major Zone)
🚧 Resistances: 3285 / 3503 / 3896 (ATH)
🎯 Falling Channel Target post Breakout: ~4,900 (+77% from CMP)
As long as 1,949 holds , structure stays bullish .
Massive swing opportunity forming. 🔥
#AngelOne #FallingChannel #ChartPattern #CandlestickPattern #PriceAction #SwingTrading
📌 #Disclaimer: This analysis is shared for educational purposes only. It is not a buy/sell recommendation. Please do your own research before making any trading decisions.

#GRMOVER: Rounding Bottom Breakout in Play!🚨 Monthly chart shows a classic rounding bottom breakout brewing!
Clear break above 498 MCB with strong momentum is needed to confirm the bullish continuation.
CMP: 481.40
🚧 Immediate Resistance: 498
🛡 Key Supports: 434 / 366 - 338 / 289 - 264
🎯 Targets: 935. Beyond that, sky’s the limit!
⚠️ Stay above the negation level to keep the bullish run intact.
#GRMOVER #RoundingBottom #ChartPatterns #PriceAction #LongTerm #Investing
📌 #Disclaimer: This analysis is shared for educational purposes only. It is not a buy/sell recommendation. Please do your own research before making any trading decisions.

Astral on the Verge: Technical Breakout & Investment Zones MappeAstral Limited : CMP: 1557.30: After studying its monthly chart structure and weekly Elliott Wave formations. Recent price action suggests a potential breakout setup, offering opportunities for both aggressive traders and patient investors.
Entry for Aggressive Traders:
• Aggressive traders can look for a breakout above the recent swing high near 1,579, as marked on both the monthly and weekly charts. This level has already shown strong momentum, with a notable price jump of +7.39% in the recent candle.
• Targets: 1630, 1725, 1795, 1935, 2200. Use trailing stop-loss: 1500, 1625, 1710, 1790, 1900 as you move up. Manage risk and adjust stop-loss as per levels.
Conservative Entry for Investors
• Investor Entry: Investors may enter on reasonable dips towards 1,440–1,460 support zone, as this range aligns with previous resistance turned support and is less volatile. Alternatively, entry after confirmation of the breakout above 1,579 with sustained volume is also suitable.
• Targets: Investors: Enter between 1,440–1,460. Targets: 1,935 and 2,200 for the medium term.
These represent major Fibonacci retracement zones and historical resistance levels, suggesting strong probability of acting as future price objectives. Investors can use a wider stop near 1,230 based on weekly chart support.
📌 Thanks a ton for checking out my idea! Hope it sparked some value for you.
🙏 Follow for more insights
👍 Boost if you found it helpful
✍️ Drop a comment with your thoughts below!

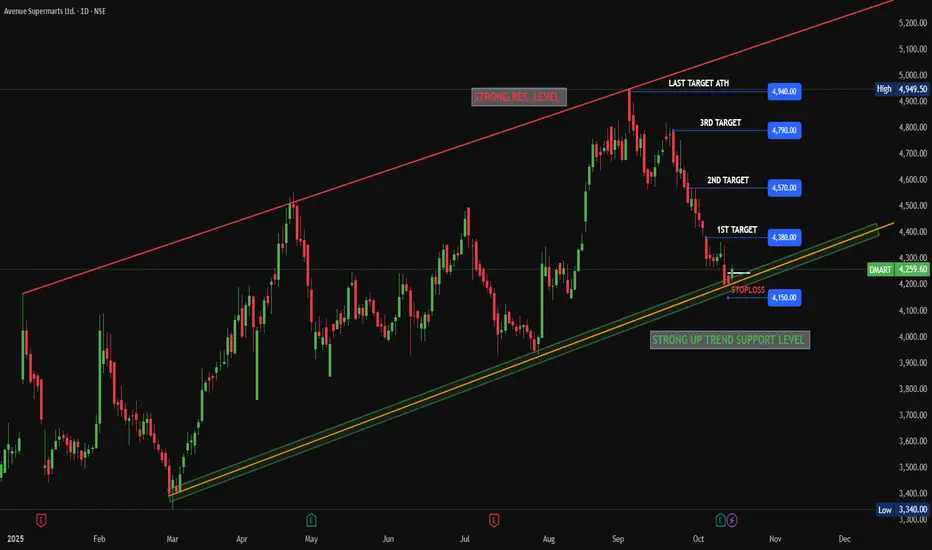
DMART LONGDMART (Avenue Supermarts) has reached a strong trend support level. Additionally, in the daily timeframe, the current candle closed at the previous day's candle level.
Therefore, we can go long in DMART for a swing trade. Fundamentally, the quarterly results are already out, so there is no immediate issue regarding upcoming events.
Go long on DMART, but make sure to manage your trade quantity, risk, and reward based on your risk appetite. This is for educational purposes only and does not guarantee returns.
#TGVSL | Rounding Bottom on Monthly📊 CMP: 120
⚙️ Setup: Second Rounding Bottom forming - eyeing breakout above 182 (ATH)
🛡 Supports: 115 / 92–88
🚧 Resistances: 126 / 142 / 166 / 182
❌ Invalidation: Below 70 (MCB)
If 182 breaks with volume - next leg could mirror the 2021 move! 🚀
🎯 Pattern Target: 182 / 285+ (+59% from ATH breakout / +140% from CMP)
#TGVSL #PriceAction #RoundingBottom #LongTerm
📌 Disclaimer: This analysis is shared for educational purposes only. It is not a buy/sell recommendation. Please do your own research before making any trading decisions.

PAYTM LONG TERM INVESTING IDEAPAYTM on weekly chart has now stopped falling further and now consolidating on the lower levels.
Current price level is good to enter and we can add further at around 450 level.
Stop loss can be put around 400 or trail using 20/50 EMA.
This is a LONG term and a bit risky bet but if you have faith in paytm's fundamentals these are really good levels ;)

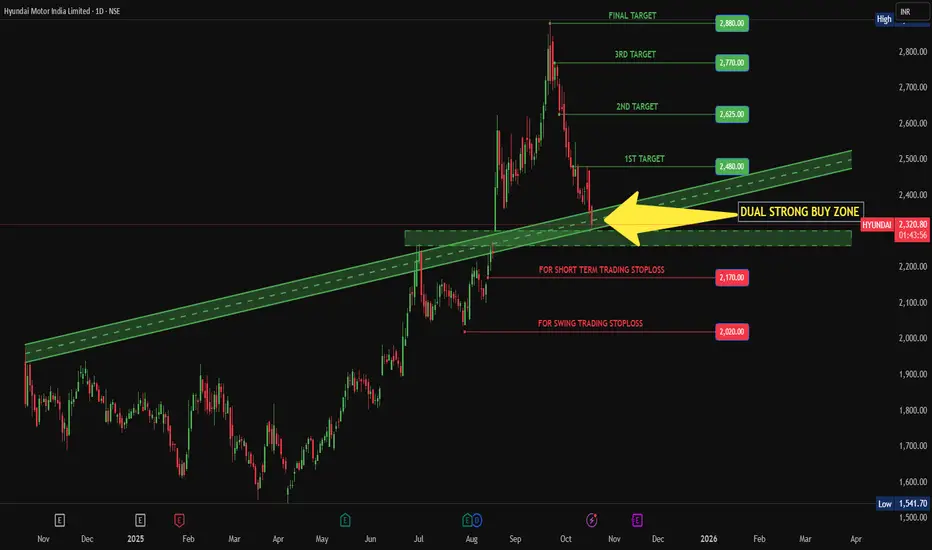
HYUNDAI IN STRONG BUY ZONEHyundai Motors India reach at dual strong buy zone area to consider as a long trade, use your skill as well knowledge to enter in a trade not guaranteed return. Do your own research than make a trade. But technically and fundamentally Hyundai is in good spot to consider as a long trade.
Long Term Buy #GMRCurrent market Price: ₹153.35
Key Technical Analysis Points
"Major Breakout Achievement"
The stock has successfully broken out of a 16-year resistance level around ₹101.73, which had been a significant barrier since the 2009 highs.
Previous ATH : ₹111.17
- Target 1: ₹125.86
- Target 2: ₹153.35
Key support : ₹101.73 (former resistance, now support)
**Long-term Pattern**: The chart shows a classic long-term consolidation pattern from 2009-2023, followed by a strong breakout and retracement that successfully held above the breakout level.
Conservative Trader can Initiate buy above ₹101.73 Breakout.
The stock experienced significant highs around 2009-2010, followed by a prolonged bear market and consolidation phase lasting over a decade. The recent breakout suggests a potential new bull cycle for the airport infrastructure company.

#MuhuratPick | #Kalamandir: Inverse Head & Shoulders in Play✨ #MuhuratPick 🪔
Celebrate this Diwali with a stock that could bring you festive returns!
CMP: 175
🔽 Supports: 163 - 164 / 152
🔼 Resistances: 193 - 202 / 241
❌ Invalidation Level: 149.50 (Weekly Close Below)
✴️ Breakout Point: Weekly close above the neckline (Pink dotted line)
🎯 Pattern Target: 290+ (+66% from CMP)
📈 All-Time High: 312
🚀 Can Go Big in the Long-Term
#InverseHeadAndShoulders | #ChartPatterns | #DiwaliPick | #Investing | #MuhuratTrading | #LongTerm | #PriceAction
📌 Disclaimer: This analysis is shared for educational purposes only. It is not a buy/sell recommendation. Please do your own research before making any trading decisions.
