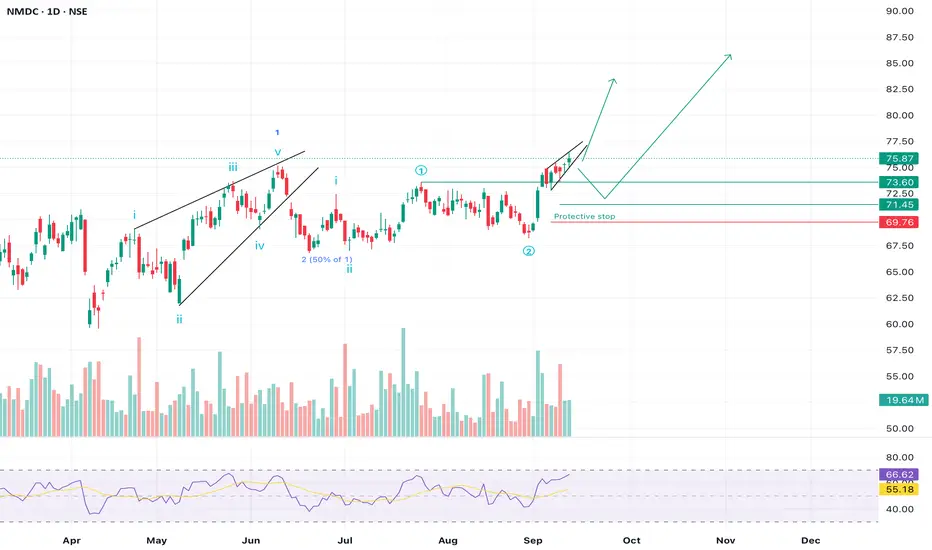
NMDC setting the stage for RALLYNMDC looks to be setting up for a potential impulsive rally after completing a corrective wave. The structure suggests strength, with protective levels clearly defined.
🧩 Elliott Wave Structure
• We can see a completed 5-wave move up earlier this year (Wave 1).
• That was followed by a healthy correction (Wave 2), which retraced close to 50% of Wave 1 — a textbook retracement zone.
• Now, price action is forming a new Wave 3 setup, which tends to be the strongest move in Elliott Wave cycles.
📈 Key Levels to Watch
• Current Price: ₹75.87
• Immediate Support: ₹73.60 – ₹73.37 zone
• Protective Stop: ₹71.45 (below recent swing low, Wave 2 invalidation area)
• Upside Path: If price sustains above ₹76, we may see a quick move towards ₹80–82 first, and eventually ₹85+ in the coming weeks.
🔍 Technical Indicators
✅ RSI is rising and trading around 66, showing bullish momentum but still shy of overbought levels.
✅ Moving averages are sloping upward, supporting the bullish bias.
✅ Volume spikes on green candles indicate strong participation from buyers.
📊 Possible Scenarios
1. Bullish Continuation: A breakout above ₹76 could trigger momentum buying, leading to higher targets quickly.
2. Pullback Before Rally: Price may retest the ₹73–74 zone before resuming the uptrend — a healthy retest would make the rally stronger.
Protective stop is marked near ₹71.45. If price falls below this, it may indicate that the wave structure has failed, and deeper correction could follow.
⸻
Disclaimer:
This analysis is for educational purposes only and not investment advice. Please consult a SEBI-registered financial advisor before making any trading or investing decisions.
Longterm
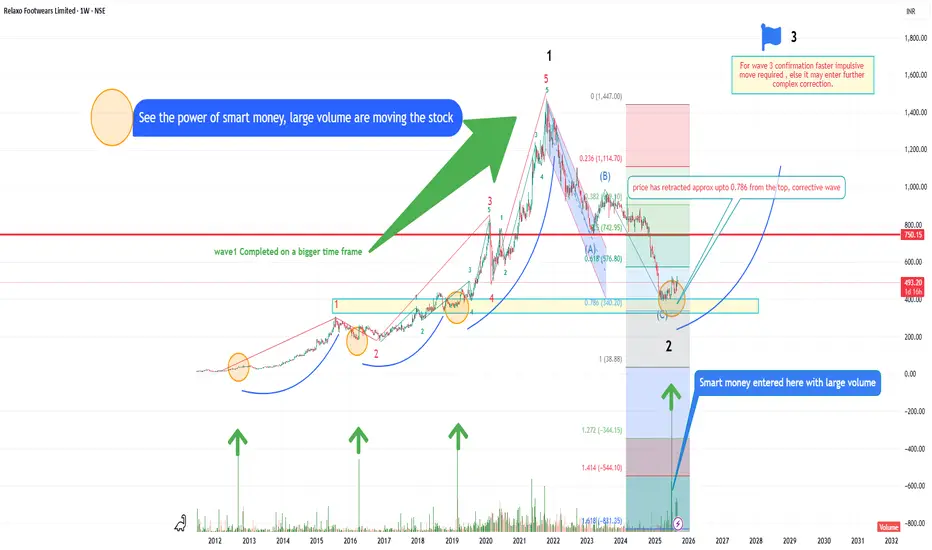
RELAXO SMART MONEY ENTERED UPMOVE EXPECTEDRELAXO SMART MONEY ENTERED UPMOVE EXPECTED
In this one can clearly See the power of smart money, large volume are moving the stock at every point from past
Wave1 Completed on a bigger time frame
Wave 2 Corrective wave retraced approx 0.786 from the top
For Wave 3 confirmation faster impulsive move required , else it may enter further complex correction.
Let's see how it goes this time .
Elliott wave Rocks
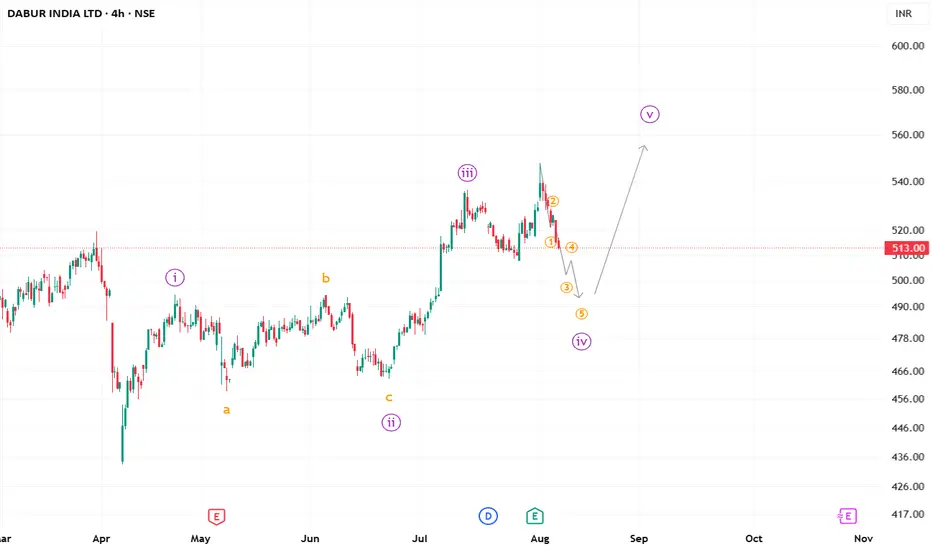
#Dabur ending correction soon?Dabur can be a good pick if you are looking for some medium-term investment in sometime, as the ongoing correction looks to be in the last stage of it impulse.
We may then possible see it soaring higher.
P.S. Always trade on price confirmation.
**This is an educational market outlook, not investment advice. Please consult a SEBI-registered advisor before taking any investment decisions.**
JSW-INFRA : Powering India’s Port Revolution – A Deep Dive into NSE:JSWINFRA
JSW Infrastructure Ltd.
🧾 Company Overview
Role: JSW Infrastructure is India's second-largest commercial port operator (after Adani Ports), and forms a core part of the JSW Group.
Operations: The company manages and operates major ports across both the east and west coastlines of India.
Revenue Streams: Primarily driven by port operations (handling bulk, breakbulk, containerized cargo), as well as integrated logistics services.
📊 FY24 Financial Snapshot
Revenue ₹3,200+Cr
EBITDA Margin 55–60%
Net Profit ₹750+Cr
Debt to Equity ~0.6x
ROCE ~15%
ROE ~13%
Positive aspects:
Asset Turnover Strong
Double-digit revenue CAGR (>20%) over the past three years.
High EBITDA margins consistent with best-in-class infra businesses.
Well-diversified cargo and customer profile, with increasing non-JSW business.
Stable long-term contracts & beneficiary of India’s logistics and trade reforms.
Risks / Weaknesses:
~70% revenue is from group companies, though diversification is underway.
Aggressive capex plans elevate financial risk.
Susceptible to regulatory, tariff, and environmental compliance changes.
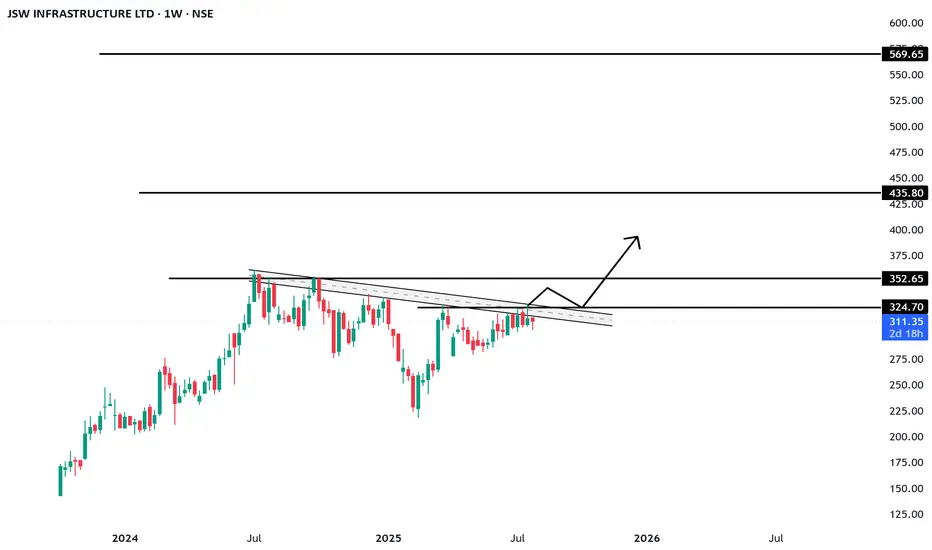
📈 Technical Analysis (July 2025)
• Share Price: Trading in the ₹260–₹280 range. IPO was at ₹119 (Sep 2023); strong price appreciation since listing.
• Trend: Intact uptrend; recently consolidated between ₹240–₹260.
• Support/Resistance: Key support at ₹230–₹235; resistance at ₹285–₹300.
• Moving Averages: Stock remains above both its 50-EMA and 200-EMA — a structurally bullish indicator.
• Momentum:
o RSI: 60–65 (bullish, but approaching overbought)
o MACD: Fresh bullish crossover; volume shows accumulation near breakout.
• Outlook: Breakout above ₹285 could trigger medium-term upside toward ₹320–₹340. Buy-on-dips is favored, with strong accumulation likely in the ₹230–₹240 zone.
🚀 Growth Prospects & Strategic Moves
• Capacity Expansion: Plans to nearly double port capacity by FY30 (from ~160 MTPA to ~300 MTPA).
• Cargo Diversification: Targeting major reduction of group dependency (from ~70% to ~50%) by growing third-party cargo traffic.
• New Projects: Investment pipeline includes both greenfield and brownfield projects in Odisha, Maharashtra, and other states.
• Integrated Logistics: Deeper backward integration into rail connectivity and warehousing to capture higher value from logistics value chain.
• Macro Tailwinds
o Major government initiatives (e.g., Sagarmala) catalyzing sector growth.
o India’s trade/exports rising; strong outlook for cargo and container volumes.
o Shifts in supply chains to coastal shipping and blended logistics.
o Demand uptrend in containerization and warehousing services.
⚠️ Key Risks & Limitations
• High Capex Cycle: Expansion could elevate debt and financial leverage.
• Macro Sensitivity: Lower industrial/output growth would hit cargo volumes.
• Regulatory Overhang: Tariff and ESG regulations present chronic uncertainty.
• Group Concentration: Third-party cargo growth remains an execution challenge.
• Rivalry: Competitive intensity from Adani, DP World, and others is ramping up.
📌 Conclusion & Investment Verdict
Parameter Verdict
Fundamentals Strong, superior margins, efficient operations
Valuation Fair to premium (due to uptrend and growth)
Technical Trend Bullish, ready for potential breakout
Growth Outlook High (supported by sector tailwinds)
Risk Profile Moderate (driven by capex & regulatory factors)
For long-term investors:
JSW Infra presents a compelling case for portfolio inclusion, offering robust growth visibility, sectoral leadership, and operating excellence. Accumulation is best near ₹230–₹240 on dips.
Short-term view:
Stocks in strong uptrends may see minor corrections but are well-placed for fresh breakouts above ₹285, targeting ₹320–₹340.
The stock is ideal for investors seeking infrastructure-sector exposure with high growth potential, but one must remain mindful of execution and regulatory risks.
==============================
==============================
⚠️ Disclaimer:
This analysis is for educational and informational purposes only.
We are not SEBI-registered analysts or advisors.
This is our personal view based on available data and market trends.
Please consult your SEBI-registered investment advisor before making any investment or trading decisions.
You are solely responsible for any financial decisions you make based on this content.
========================
Trade Secrets By Pratik
========================
Update idea
Add note
Trade_Secrets_By_Pratik
Also on:
Disclaimer
The information and publications are not meant to be, and do not constitute, financial, investment, trading, or other types of advice or recommendations supplied or endorsed by TradingView. Read more in the Terms of Use.
English (India)
Select market data provided by ICE Data services.
Select reference data provided by FactSet. Copyright © 2025 FactSet Research Systems Inc.
© 2025 TradingView, Inc.
More than a product
Supercharts
Screeners
Stocks
ETFs
Bonds
Crypto coins
CEX pairs
DEX pairs
Pine
Heatmaps
Stocks
ETFs
Crypto
Calendars
Economic
Earnings
Dividends
More products
Yield Curves
Options
News Flow
Pine Script®
Apps
Mobile
Desktop
Tools & subscriptions
Features
Pricing
Market data
Trading
Overview
Brokers
Special offers
CME Group futures
Eurex futures
US stocks bundle
About company
Who we are
Athletes
Blog
Careers
Media kit
Merch
TradingView store
Tarot cards for traders
The C63 TradeTime
Policies & security
Terms of Use
Disclaimer
Privacy Policy
Cookies Policy
Accessibility Statement
Security tips
Bug Bounty program
Status page
Community
Social network
Wall of Love
Refer a friend
House Rules
Moderators
Ideas
Trading
Education
Editors' picks
Pine Script
Indicators & strategies
Wizards
Freelancers
Business solutions
Widgets
Charting libraries
Lightweight Charts™
Advanced Charts
Trading Platform
Growth opportunities
Advertising
Brokerage integration
Partner program
Education program
Look First
HDFC BANK LTD
NSE•Real-time•Market closed
Edit Idea
Minimize
Close
JSW INFRA : Powering India’s Port Revolution – A Deep Dive into
NSE:JSWINFRA
JSW Infrastructure Ltd.
🧾 Company Overview
Role: JSW Infrastructure is India's second-largest commercial port operator (after Adani Ports), and forms a core part of the JSW Group.
Operations: The company manages and operates major ports across both the east and west coastlines of India.
Revenue Streams: Primarily driven by port operations (handling bulk, breakbulk, containerized cargo), as well as integrated logistics services.
📊 FY24 Financial Snapshot
Revenue ₹3,200+Cr
EBITDA Margin 55–60%
Net Profit ₹750+Cr
Debt to Equity ~0.6x
ROCE ~15%
ROE ~13%
Positive aspects:
Asset Turnover Strong
Double-digit revenue CAGR (>20%) over the past three years.
High EBITDA margins consistent with best-in-class infra businesses.
Well-diversified cargo and customer profile, with increasing non-JSW business.
Stable long-term contracts & beneficiary of India’s logistics and trade reforms.
Risks / Weaknesses:
~70% revenue is from group companies, though diversification is underway.
Aggressive capex plans elevate financial risk.
Susceptible to regulatory, tariff, and environmental compliance changes.
📈 Technical Analysis (July 2025)
• Share Price: Trading in the ₹260–₹280 range. IPO was at ₹119 (Sep 2023); strong price appreciation since listing.
• Trend: Intact uptrend; recently consolidated between ₹240–₹260.
• Support/Resistance: Key support at ₹230–₹235; resistance at ₹285–₹300.
• Moving Averages: Stock remains above both its 50-EMA and 200-EMA — a structurally bullish indicator.
• Momentum:
o RSI: 60–65 (bullish, but approaching overbought)
o MACD: Fresh bullish crossover; volume shows accumulation near breakout.
• Outlook: Breakout above ₹285 could trigger medium-term upside toward ₹320–₹340. Buy-on-dips is favored, with strong accumulation likely in the ₹230–₹240 zone.
🚀 Growth Prospects & Strategic Moves
• Capacity Expansion: Plans to nearly double port capacity by FY30 (from ~160 MTPA to ~300 MTPA).
• Cargo Diversification: Targeting major reduction of group dependency (from ~70% to ~50%) by growing third-party cargo traffic.
• New Projects: Investment pipeline includes both greenfield and brownfield projects in Odisha, Maharashtra, and other states.
• Integrated Logistics: Deeper backward integration into rail connectivity and warehousing to capture higher value from logistics value chain.
• Macro Tailwinds
o Major government initiatives (e.g., Sagarmala) catalyzing sector growth.
o India’s trade/exports rising; strong outlook for cargo and container volumes.
o Shifts in supply chains to coastal shipping and blended logistics.
o Demand uptrend in containerization and warehousing services.
⚠️ Key Risks & Limitations
• High Capex Cycle: Expansion could elevate debt and financial leverage.
• Macro Sensitivity: Lower industrial/output growth would hit cargo volumes.
• Regulatory Overhang: Tariff and ESG regulations present chronic uncertainty.
• Group Concentration: Third-party cargo growth remains an execution challenge.
• Rivalry: Competitive intensity from Adani, DP World, and others is ramping up.
📌 Conclusion & Investment Verdict
Parameter Verdict
Fundamentals Strong, superior margins, efficient operations
Valuation Fair to premium (due to uptrend and growth)
Technical Trend Bullish, ready for potential breakout
Growth Outlook High (supported by sector tailwinds)
Risk Profile Moderate (driven by capex & regulatory factors)
For long-term investors:
JSW Infra presents a compelling case for portfolio inclusion, offering robust growth visibility, sectoral leadership, and operating excellence. Accumulation is best near ₹230–₹240 on dips.
Short-term view:
Stocks in strong uptrends may see minor corrections but are well-placed for fresh breakouts above ₹285, targeting ₹320–₹340.
The stock is ideal for investors seeking infrastructure-sector exposure with high growth potential, but one must remain mindful of execution and regulatory risks.
==============================
==============================
⚠️ Disclaimer:
This analysis is for educational and informational purposes only.
We are not SEBI-registered analysts or advisors.
This is our personal view based on available data and market trends.
Please consult your SEBI-registered investment advisor before making any investment or trading decisions.
You are solely responsible for any financial decisions you make based on this content.
========================
Trade Secrets By Pratik
========================
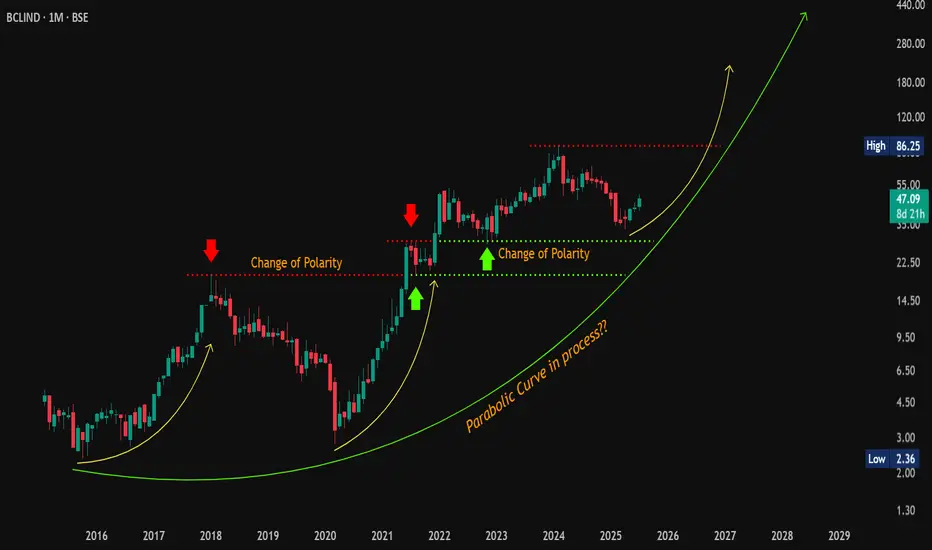
Parabolic Reload? Base 2 Brewing on BCLIND—Will History Repeat?#Update | 🔍 #OnRadar
#BclInd (BCL Industries Ltd.)
📈 Base 2 Brewing—Will History Repeat?
CMP: 47.09
📌 Previous Discussion Recap:
Previously highlighted #BCLIND around 32 with a support zone near 27. The stock made a low of 27.61 and then rallied up to 86.25 (pre-stock split 1:10) — a significant move.
Technical View — Monthly Chart (Educational Purpose Only):
BclInd is showing signs of continuation of the #ParabolicMove . Earlier, it broke out from #Base1 at 19.57 and rallied up to 52.50 — an impressive ~270% move in just 10 months .
Currently, it appears to be forming #Base2 structure.
📌 Confirmation Level: Monthly close above 86.25 (ATH) may validate the continuation of the move.
🧐 Will the parabolic momentum resume?
If the parabolic structure repeats, this could evolve into a strong long-term breakout — worth tracking closely.
⚠️ Disclaimer: This is not a buy/sell recommendation. Please consult your financial advisor before making any investment decisions. This post is purely for educational and observational purposes.
#TechnicalAnalysis | #PriceAction | #ParabolicCurve | #LongTerm
G G Automotive Gears Ltd One-Page Equity ResearchInvestment Thesis – BUY | Target Price ₹300 | Upside ~24%
India’s only listed pure-play traction–gear specialist with 50-year pedigree and >500 OE customers
Rail & Metro orders at record high; Indian Railways raising locomotive build plan by 27% for FY26, driving multi-year volume visibility
Successful diversification into wind-energy, mining & industrial forgings lowers cyclicality and lifts blended margins
Balance-sheet repair complete; net-debt / equity down to 0.53× vs 1.52× in FY23
Snapshot (Standalone)
CommentRevenue (₹ Cr)95.377.336%
EBITDA Margin12.7%10.0%
PAT (₹ Cr)4.431.9497%
EPS (₹)5.322.4544%
ROCE14.9%8.2%
P/E (TTM)26.5×
Market Cap₹ 241 C
Valuation & Target
We apply 32× FY26E EPS (₹9.4) – a 30% discount to peer Elecon (45×) to reflect smaller scale but superior growth trajectory.
Derived Target Price ₹300 (prior ₹241 close), implying 24% upside plus optionality from export traction gears.
Key Catalysts
Indian Railways 100% electrification → higher demand for reduction gearboxes
Metro build-out (20+ cities) – first export order executed FY24 proves capability
Unit-III & IV capacity added FY24 (+30k sq ft) unlocks 35% volume expansion without major capex
Potential government PLI scheme for rail components may grant 6% incentive on sales (not in model).
Risks to Thesis
Lumpy order inflow from Railways could stretch working capital
Alloy-steel price spikes may compress gross margin; 65% raw-material cost is steel
Customer concentration: top-three PSU units >55% of revenue
Small free float → liquidity risk in sharp market Initiate BUY with ₹300 target; accumulate on dips toward ₹220. Recommend watch on quarterly order-book disclosures for traction confirmation.

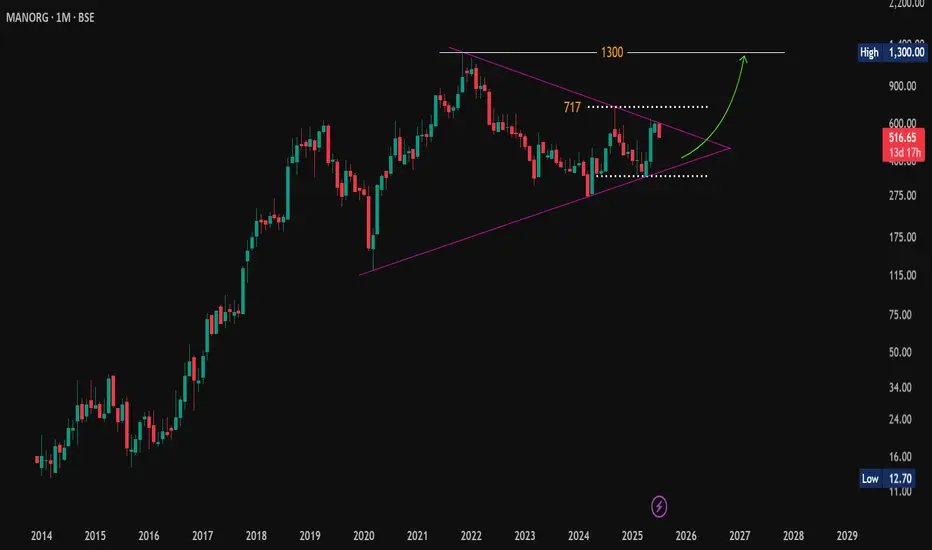
ManOrg: Symmetrical Triangle Tightens – Big Move Ahead?🔎 #OnRadar
#ManOrg (Mangalam Organics Ltd.)
Symmetrical Triangle Tightens – Big Move Ahead?
CMP: 516.65
📈 Technical Outlook (Monthly Chart | For Educational Purpose Only):
#SymmetricalTriangle pattern appears to be forming on the monthly timeframe.
The price has faced repeated resistance near the falling trendline around 629 and is currently showing signs of a possible retracement towards the lower end of the triangle. The key support zone lies between 473–378 .
If this zone holds, price may attempt another move up toward the falling trendline resistance. A monthly close above the trendline could indicate a potential breakout from this long-term structure. If sustained, the stock may gradually head toward its all-time high zone near 1,300 .
⚠️ Disclaimer: This post is shared only for educational purposes. It is not a buy/sell recommendation. Please consult a financial advisor before making any investment decisions.
#TechnicalAnalysis | #SymmetricalTriangle | #ChartPatterns | #PriceAction | #LongTerm
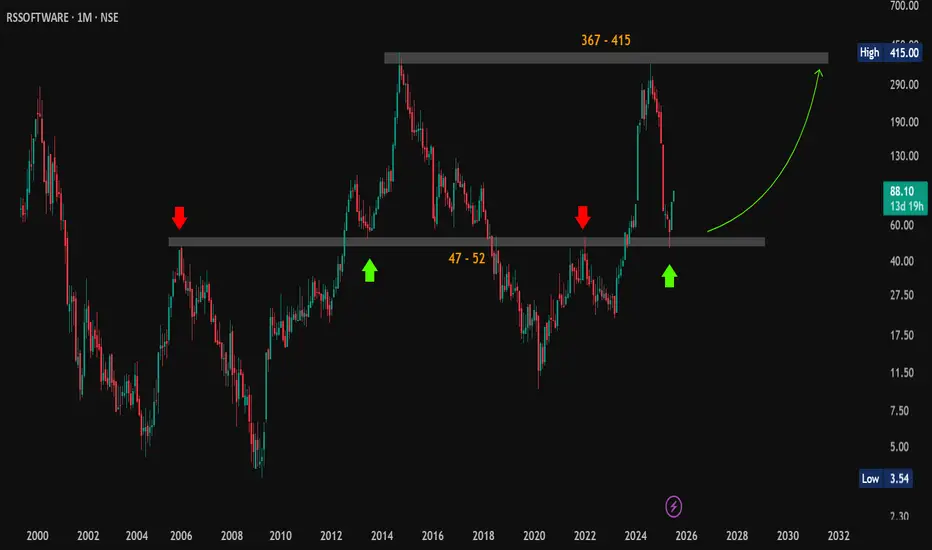
Multi-Year Support Respected – Is the Bottom In for Rssoftware?🔎 #OnRadar
#Rssoftware (R.S. Software India Ltd.)
Multi-Year Support Respected – Is the Bottom In for Rssoftware?
CMP: 88.10
📊 Technical Outlook (Monthly Chart):
The stock corrected sharply from its #DoubleTop zone of 367, hitting a low near 46—right at a key confluence support zone of 47–52. This zone has historically acted as a strong support and resistance area, and once again, price has shown a bounce from this level.
Currently showing upward momentum, the next significant resistance is around 209. Sustained move above this could potentially lead towards retesting the previous #DoubleTop zone of 357–415 over the long term.
📌 Disclaimer: This is a technical observation shared for educational purposes only. It is not a buy/sell recommendation. Please consult a SEBI-registered advisor before making any investment decisions.
#TechnicalAnalysis | #PriceAction | #ChartSetup | #LongTerm
Massive Symmetrical Triangle on Kakatiya Cement – Eyes on 599?🔎 #OnRadar
#Kakatcem (Kakatiya Cement Sugar & Industries Ltd.)
CMP: 166.40
📈 Technical Outlook (Monthly Chart | For Educational Purpose Only):
A #SymmetricalTriangle pattern appears to be forming on the monthly timeframe.
📌 Price took support near the rising trendline (~130) and is now showing signs of recovery. If momentum sustains, the stock may head toward the falling trendline resistance of the triangle.
A monthly close above the falling trendline could indicate a potential breakout from this long-term pattern — which, if successful, may open up room for a move towards its all-time high zone around 599 .
⚠️ Disclaimer: This post is shared only for educational and observational purposes. It is not a buy/sell recommendation. Please consult a financial advisor before making any investment decisions.
#TechnicalAnalysis | #SymmetricalTriangle | #ChartPatterns | #PriceAction | #LongTerm

CARTRADE Observation learning- 1st absorption
look at price, big green candle with wick selling pressure
But price continue hold and absorp sellers pressure.
After given good break outmove sharply up side
Again' same things happen, selling pressure absorption happened in tight range
After now trying to break ATH(all time high) still closing pending.
This trade still not confirmed yet.
Just sharing my observation & leading.

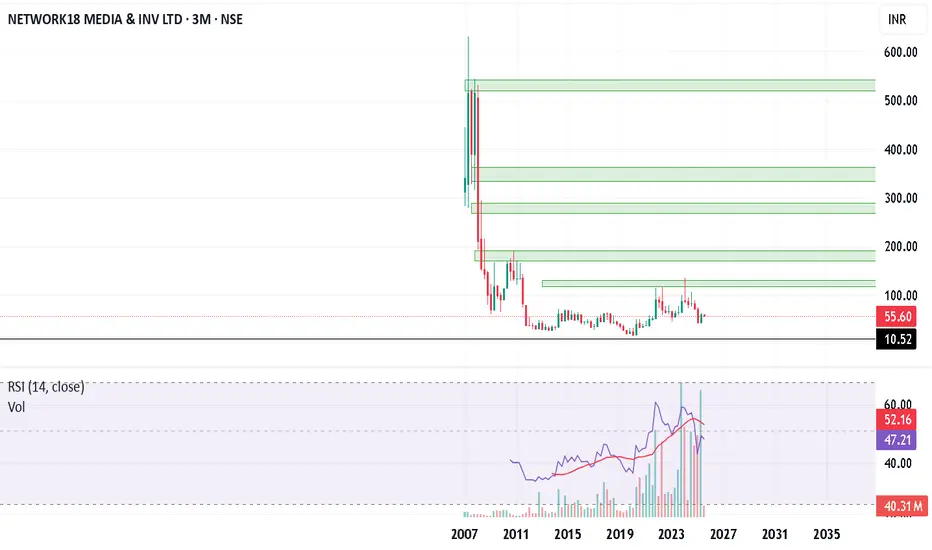
Network18, 3M, Long term Network18 is in long term base formation. With increase in volumes and price momentum, looks good for long term investment.
Bajaj Consumer Care, 3M, longBajaj consumer looks good for investment, recent volumes and price action supports its long position. To reduce risk, add after trendline line breakout on quaterly. Add more at 170 or above 280.

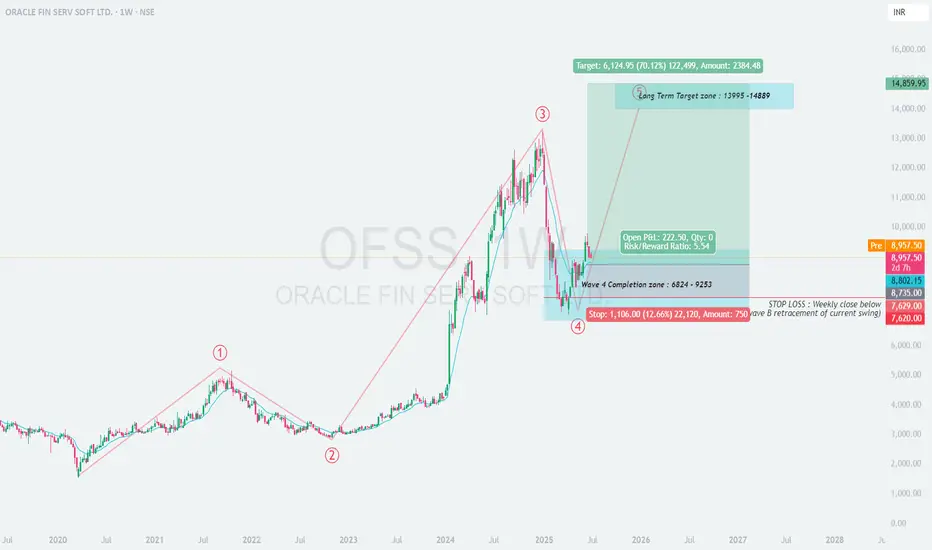
OFSS : Turning Back?📊 Technical Analysis: OFSS – Weekly Chart
🌀 Elliott Wave Count
The chart shows a classic impulsive 5-wave Elliott structure.
Currently, Wave 4 seems to have completed in the zone of ₹6824–₹9253.
The current price action indicates the beginning of Wave 5, targeting significant upside.
🟦 Wave 4 Completion Zone: ₹6824–₹9253
Strong buying interest observed in this zone.
Multiple bullish candles from the support band indicate trend resumption.
Wave structure suggests upside momentum may now pick up.
🟩 Long-Term Target Zone: ₹13,995 – ₹14,889
Based on the projected Wave 5 extension, the upside potential is nearly +70% from current levels.
Ideal for long-term investors and positional traders.
📝 Trade Setup
✅ Entry:
Current Market Price (CMP) ~ ₹8,957
🎯 Targets:
T1: ₹13,995
T2: ₹14,889
❌ Stop Loss:
Weekly close below ₹7,629 (Wave B retracement & structure invalidation)
📈 Risk-Reward Ratio: ~5.54
🔒 Risk per share: ₹1,106
🚀 Potential Gain per share: ₹6,124
🧠 Trade Logic
Strong Elliott wave structure favors Wave 5 continuation.
Risk is well-defined and acceptable for the expected return.
Ideal case of “buying into the start of an impulsive wave”.
📌 Summary:
OFSS has completed its Wave 4 corrective phase and is now positioned for a strong Wave 5 rally. Long-term investors may consider accumulating near current levels for a target of ₹14,800+, maintaining a strict SL below ₹7,620 on a weekly close basis.
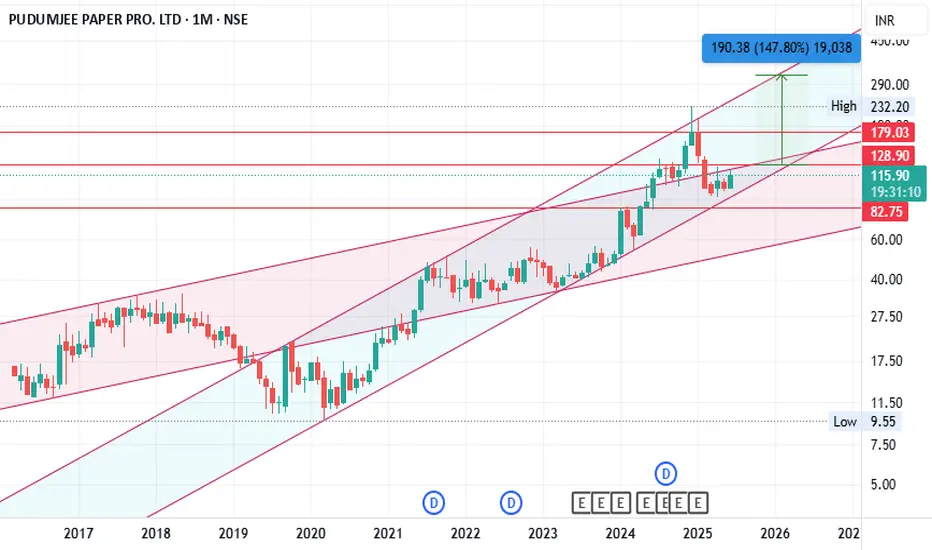
Pudumjee paper- A paper rocket to fly 100% minimum in long term1. A decisive breakout above 130 is needed and it should sustain above it atleast for 1 month.
2. First target – 180
3. Second target – 100% minimum from current price depending upon the time it takes to break the current parallel channel and the 180 resistance.
Note: This is for educational purpose only and not a trade recommendation.
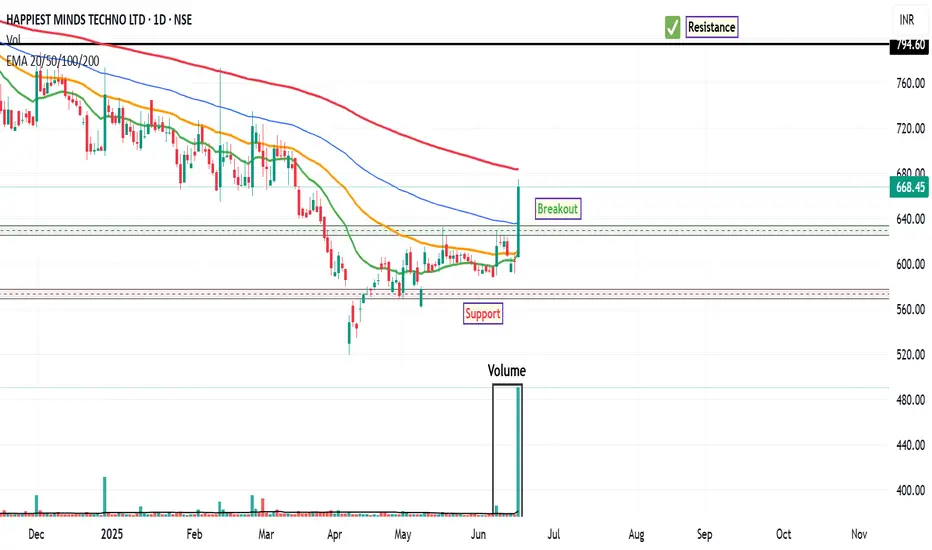
HAPPSTMND: Analysing the Bullish BreakoutHappiest Minds Technologies ( HAPPSTMND ) has recently exhibited a significant shift in market dynamics, marking a potential end to its prolonged downtrend that commenced in July 2024 . In a recent trading session, the stock registered an impressive 11% gain in single trading session signaling a resurgence of buyer interest.
This notable price appreciation was accompanied by a substantial surge in trading volume, with approximately 25M shares changing hands. This volume figure represents nearly 15 times the 20 MA volume, indicating a robust influx of buying conviction and significant market participation behind the upward move. Such a volumetric anomaly often provides strong confirmation for price breakouts or reversals.
From a momentum perspective, the technical indicators are also aligning to support a more constructive outlook. The MACD indicator on the weekly timeframe executed a bullish crossover several weeks ago, a development that typically precedes or accompanies long-term upward trends. Furthermore, the RSI has now advanced to the 54 level . While not yet in overbought territory, this move above the 50-mark suggests increasing bullish momentum and a healthy strengthening of the trend. This confluence of weekly MACD signals and improving daily RSI readings points towards a potentially strong long-term bullish movement.
Considering these technical observations, the stock may face a significant long-term resistance level around ₹794 . This level could present a crucial test for the prevailing bullish momentum, where a sustained breakout might pave the way for further upside. Conversely, for risk management purposes, traders may identify a suggested stop-loss zone and a breakout zone as illustrated on the accompanying chart, which would serve as key areas to monitor for potential shifts in price action or to define risk parameters.
Disclaimer: The information provided in this technical analysis is for informational and educational purposes only and should not be construed as financial advice. It is based on observations from historical price and volume data, and commonly used technical indicators. Market conditions can change rapidly, and past performance is not indicative of future results. All trading and investment decisions involve inherent risks, and losses can exceed initial investments. Always conduct your own comprehensive due diligence and consult with a qualified financial advisor before making any investment decisions.
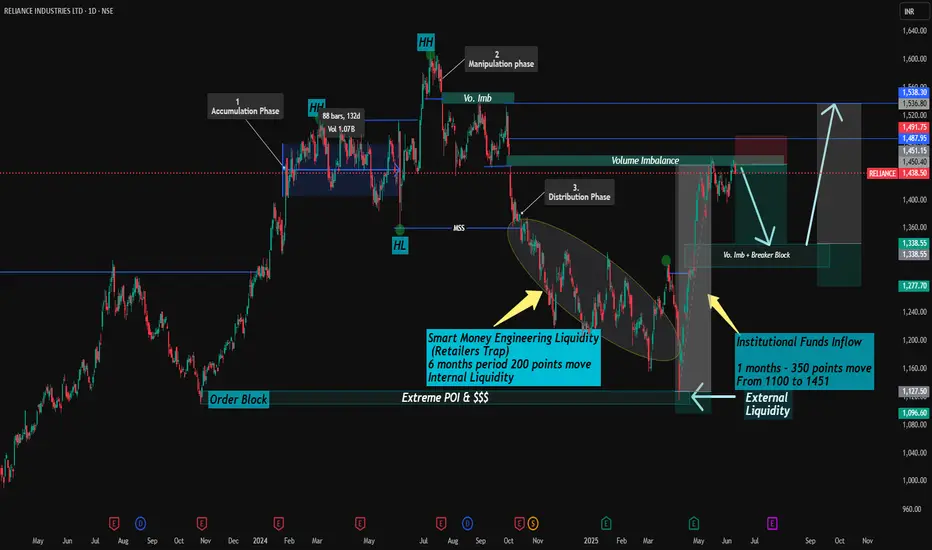
Reliance industries ltd. Deep AnalysisSharing my Analysis on Reliance (RIL). (Only for Education Purpose)
This analysis is based on Higher Time Frame (Daily)
Past Move scenario ----
1. If we see on chart, after 3rd oct. 2024, Price has completed major liquidity sweep below internal lows followed by Market Structure Shift (Marked as MSS) and for that it took 6 months.
2. After that External liquidity sweep been performed near to 1100 levels which is also marked as Extreme POI which triggered an impulse move of 350 points with funds inflow which pushed price to 1451 levels. (Here it just took 1 months only)
Current Move Scenario ----
===upside there we saw volume imbalance + Breaker block where price is making resistance or rejecting upside move.
(Potential Short Term Supply Zone 1450-1488 levels)
Expected Short Term Bias ---
Downside levels --- 1335 (Breaker Block + Discount Zone)
Upside Resistance ---- Cross of Order block range 1496
Expected Long Term Bullish Bias -- Likely after Retracement to downside Vo. Imbalance and + Breaker block
Re-Entry Long Zone - 1335-1350
Upmove expected to 1500 Imbalance levels
above that Final External Liquidity zone to 1560
Steps --- Accumulation ---Expansion ---Re accumulation, targeting External Liquidity.
Everything mentioned on chart itself.
{Above Views are only for Education purpose and do not consider it as any Advisory. Consult your Financial Advisor before investments in any securities.}
YOur Views or Comments are Welcomed.
ETHOSLTDETHOSLTD has given breakout after so long and after many attempt. It may face bit resistance near 3050 level but once it crosses it may take a new ride. It has a potential to go up to 3500 and above that it may enter in to uncharted area. If I talk about fundamental event then on 12 june it will be split by 1:1. So after split we may see volume bounce as well which may lead to start a momentum rally. Now if I talk about long term chart ie weekly/monthly then on both format it is showing very good strength. I won't be surprised even if it trades above 4400 levels. My view will be changed if it goes below 2650.

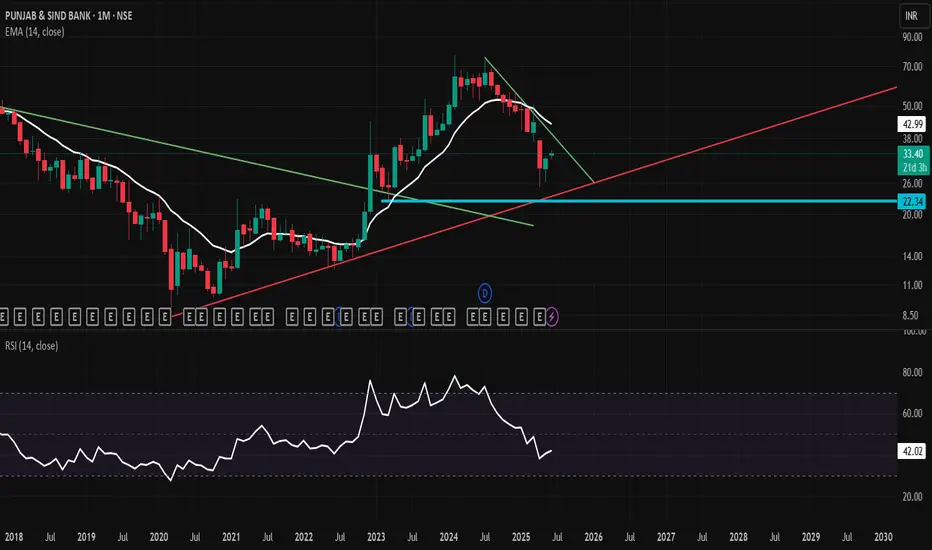
Is PSB The Right Bank To Invest Into?During the first half of 2024, NSE:PSB hit its peak levels near Rs. 80 and afterwards, it started falling down. However, when seen on the weekly chart, it was an expected down move and can be classified as a clean retracement. On April 1, 2025, marking the start of this financial year, the bank retraced to 78.6% fib level. It was also the same time when RSI hit 30 level on the weekly chart. Since then, it has been going up again.
The current situation is that the bank is already up from Rs. 25 to Rs. 33. However, it is today the price has crossed the 50 EMA on the daily chart. The RSI is also below 70, which shows a potential for up moves, which is further supported by the resistance line, which seems to be at Rs. 37 based on the current trajectory of the price movement. This is a 10%+ upside at minimum.
The Price to book is roughly 1.7x, which is not bad for a bank however, the Price to earnings is about 22, which is a bit concerning.
The bank is profitable for the last 4 years and has made about Rs. 1000 crores in the last 12 months, But it doesn't seems to be enough to justify the current valuation. However, the Plant/Property/Equipment of Rs. 1800 crores, which when revalued on current market estimates, might do the trick.
Overall, this trade is a bit late. The best time was two months ago. Currently, the risk:reward on the daily timeframe is not ideal; however it might be acceptable on a longer weekly time-frame, which might be suitable for investment purposes.
I am buying some shares for 1-2 year investment and keeping enough cash in reserves to average at Rs. 25 and then at Rs. 22.
~ Trading Idea by Dr. Sagar Bansal via @jyotibansalanalysis
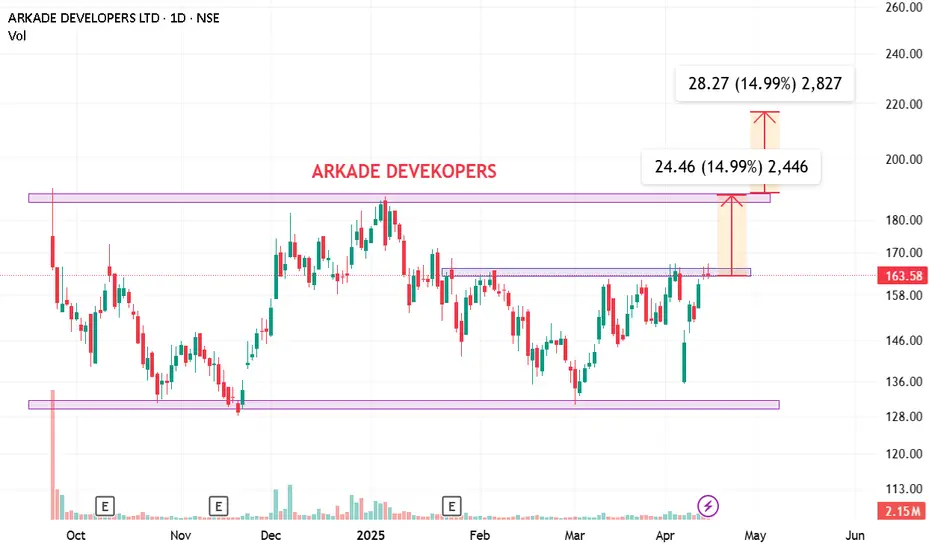
Arkade Developers IPO breakoutAfter ipo promoter promised in concall about 10000cr revenue till 2029 in next 5 years. so aprox considering 27% pat margin they will deliver 2700cr profit. which is current networth of company. very stong fundamental plus technical bet
in this market fall promoter bought very huge quantity of shares, which also shows that they bealive in their commitment and actions forward. track
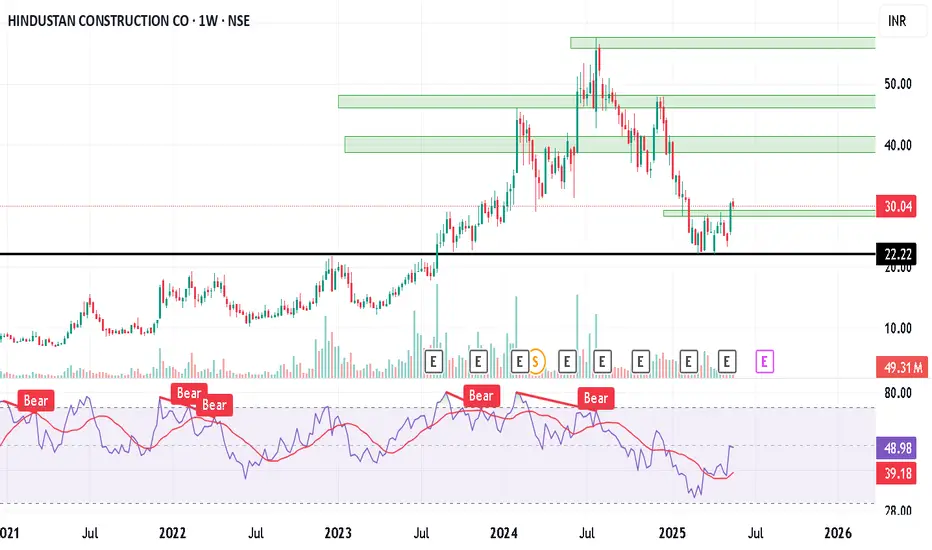
HCC, long, weekly chart, long termHCC, chart looks good for long side after base breakout, potential targets 39, 45, 55.
Credit rating downgrade and weak US economic data weaken the USD🔔🔔🔔 Gold news:
➡️The US dollar is attempting to stabilize following a previous decline, driven by a resurgence of the "Sell America" narrative, which triggered a broad sell-off in US assets across global financial markets. On Friday, Moody's downgraded the US sovereign credit rating by one notch from the pristine "Aaa" to "Aa1", undermining the "US brand."
➡️ Investors remain wary of the country's long-term fiscal outlook. According to Reuters, analysts have warned that Trump's sweeping tax cut proposals could add an additional $3 to $5 trillion to the nation's $36.2 trillion debt over the next decade. In response, risk-off flows dominated on Monday, boosting demand for the traditional safe-haven gold.
Personal opinion:
➡️ Gold prices remain in the 3190 – 3250 range and await the results of potential US trade agreements with India, South Korea and Japan.
➡️ Analysis based on resistance - support levels and EMA combined with trend lines to come up with suitable strategies
Personal Plan:
🔆Price Zone Setup:
👉Buy Gold 3189 - 3192
❌SL: 3185 | ✅TP: 3196 - 3200 – 3205
👉Sell Gold 3203 - 3206
❌SL: 3199 | ✅TP: 3210 - 3215 – 3220
FM wishes you a successful trading day 💰💰💰

Mrpl entry level 1st entry level
113 to 115 entry level
107 stop loss
193 target 3 to 4 month holding time
214 target 5 to 6 month holding time
2nd entry level
151 above 1day closing
152 entry level
147 stop loss
193

CITY UNION BANK - Buy above 188₹BUY BUY BUY CUB - Dont miss opportunity if 188₹ levels are broken
Ascending triangles tend to be bullish as they indicate the continuation of an upward trend. In some cases, they may point to the reversal of a downtrend. A descending triangle is bearish. That's because it points to the continuation of a downtrend or the reversal of an uptrend.
