BUY NATIONAL ALLUMINIUMNational Aluminum gives all time high breakout and than retest the level which become strong support and stoploss for a trade, so long on national aluminum or hold as a trade as well long term investment with strict stoploss. Do your own research this is only for education purpose not any buy or sell recommendations. i am not expert in market because market is the king. Enjoy the Ride.
Longterminvesting

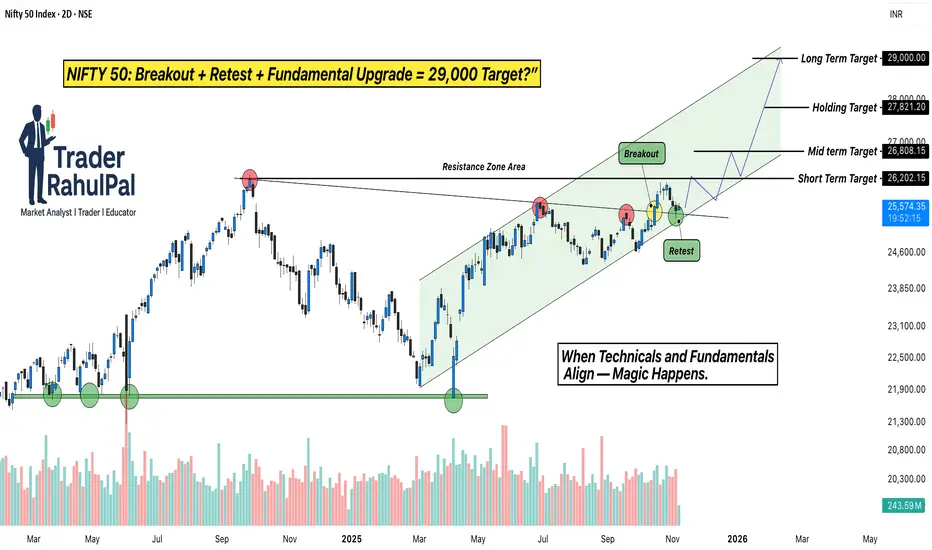
NIFTY Breakout + Goldman Sachs Upgrade = 29,000 Target?Hello Traders!
Today’s analysis is on NIFTY 50 Index, which has recently given a strong Breakout and Retest setup after months of consolidation. The index broke out from its Resistance Zone , retested the breakout area perfectly, and is now holding firmly inside a rising Trend Channel .
This move is not just technical, it’s being backed by major institutional optimism. According to a recent Goldman Sachs report , India’s stock market has been upgraded to “Overweight”, with NIFTY 50 projected to reach 29,000 by 2026 .
Why this setup is special?
Perfect breakout and retest structure with strong volume confirmation.
Channel trend remains intact, showing controlled accumulation at higher levels.
Institutional support from Goldman Sachs aligns with the technical breakout, adding conviction to the rally.
Levels to Track:
NIFTY is holding above the breakout zone near 25,000 , with immediate support seen at 24,600 . As long as the index sustains above this level, the short-term upside remains open toward 26,800 , followed by the next leg around 29,000 , matching Goldman Sachs’ longterm projection.
Rahul’s Tip:
When technicals and fundamentals align, the results are often explosive. A clean retest like this, supported by global institutional confidence, can lead to a powerful trend extension. Traders who position early usually ride the strongest part of the move.
(Analysis By @TraderRahulPal | More analysis & educational content on my profile. If this helped you, don’t forget to like and follow for regular updates.)
Disclaimer:
This analysis is for educational purposes only and should not be taken as financial advice. Please do your own research or consult your financial advisor before investing.
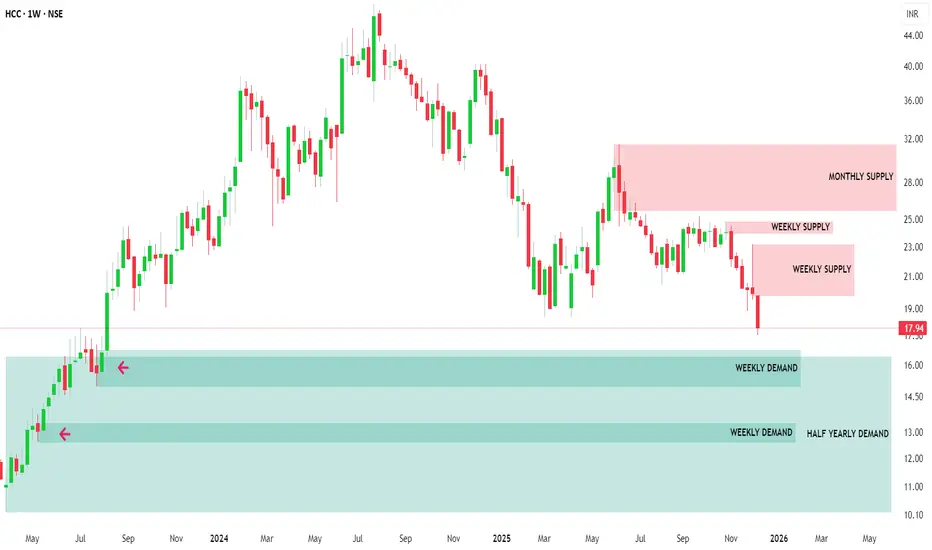
MTF Demand Confluence: High-RR Reversal SetupMulti Timeframe Supply & Demand Analysis
🕰️Yearly Timeframe
On the Yearly timeframe, price has already broken above a major supply zone, signaling strong higher‑timeframe bullish intent and possible long‑term accumulation by institutional players. Just above this breakout, price tapped into a previously tested yearly supply zone, from where it faced rejection and started to rotate lower, confirming active overhead supply.
This structure shows a classic “Break–into–higher supply” reaction, where long‑timeframe trend strength is present, but price is temporarily capped by remaining sell orders in the upper zone. A clean, sustained break above this upper yearly supply could unlock a fresh leg of long‑term upside.
📆 Half-Yearly Timeframe
On the Half-Yearly timeframe, price is currently approaching a strong demand zone — a critical level where significant buying pressure was previously observed. This prior bullish activity proved powerful enough to break through a previous Half-Yearly supply zone, clearly signaling the presence of institutional demand or major accumulation at this area. 💪
This HYTF demand confluence adds further conviction to the overall bullish structure, as it validates sustained buyer interest capable of overcoming historical supply barriers.
📉 Monthly Timeframe
On the Monthly Timeframe, price first reacted downward from a Monthly Demand Zone (MDZ) that coincided with a Half‑Yearly Supply Zone (HYSZ), creating a strong confluence area where sellers stepped in aggressively. As price moved away, the nearest Supply Zone (SZ) was respected again, extending the selling leg and confirming short‑term bearish order‑flow.
Currently, price is approaching Monthly Demand Zone that overlaps with a Half‑Yearly Demand Zone (HYDZ), forming a powerful HTF demand confluence with high probability of bullish reversal. If buyers manage to defend this HYDZ–MDZ cluster, it can act as a strong platform for a new upside swing.
If selling pressure remains elevated and this primary MDZ fails, there is one more MDZ sitting near the bottom of the structure, which can serve as a secondary demand pocket where price may still reverse to the upside. Both these stacked demand zones offer attractive areas to watch for confirmation‑based long setups.
Weekly Timeframe Focus (Reversal Zones)
On the Weekly timeframe, there are four clearly defined reversal zones where price has a high probability of reacting due to visible supply‑demand imbalances and prior impulsive moves. These levels align well with the higher‑timeframe zones, making them high‑quality decision points.
Monitoring these four zones for clean price action signals such as strong rejection wicks, engulfing candles, or structure breaks can help time entries with precision while keeping risk tightly controlled. This multi‑timeframe stacking significantly increases the reliability of any confirmed reversal from these areas.
Conclusion: Long‑Term Investment View
Given the strong confluence of demand zones across Yearly, Half-Yearly, and lower timeframes, plus multiple well‑defined reversal levels on the Weekly chart, this stock is positioned for a potentially strong bullish reversal from current or slightly lower zones. Notably, after the reaction from this higher timeframe demand zone, there are no significant supply hurdles visible on higher timeframes, clearing the path for sustained upside momentum and substantially increasing the chances of higher returns.
From a long‑term investment perspective, the structure suggests a favorable reward‑to‑risk profile and scope for strong performance if price holds above the mapped HTF demand. If demand is confirmed and price starts building a higher‑low structure from these zones, this can evolve into a high‑conviction long‑term swing or investment candidate, supported by institutional‑grade demand footprints and multi‑timeframe alignment.
The Most Important Bitcoin Level of This Cycle — Don’t Miss It.Bitcoin is once again testing its multi-year rising support trendline, the same zone that has triggered every major rally since 2020. Price has repeatedly formed higher lows, showing that long-term buyers are still defending this structure.
What makes this zone special is the confluence:
A macro rising support trendline that has held for nearly 4 years.
A fresh institutional demand zone between 88k–92k.
Volume spike indicating renewed accumulation.
Rejection from macro rising resistance , resetting liquidity below.
This type of setup usually appears before expansion moves. As long as BTC holds above this macro support, the market continues to favor upside targets:
1st Target: 106,770 (conservative)
2nd Target: 124,250 (mid-term)
3rd Target: 135,800+ (macro breakout zone)
But here’s the key point:
A clean breakdown below the structure would delay the bullish cycle, until then, dips into the demand zone remain high-probability accumulation opportunities for long-term traders.
History rarely repeats perfectly…
but it often rhymes, and BTC is back at the same place where big moves begin.
Analysis By @TraderRahulPal | More analysis & educational content on my profile.
Disclaimer:
This analysis is for educational purposes only and is not financial advice. Markets can change quickly always manage risk, do your own research, and trade according to your plan.

Why People Don’t Believe in Compounding Until It’s Too Late?Hello Traders!
Compounding is the most powerful wealth-building force in finance, and yet, most people ignore it.
Not because it doesn’t work, but because it works slowly in the beginning and too fast later.
By the time people realize how powerful compounding really is, they’ve already lost years they can never get back.
Let’s break down why this happens and what you can learn from it.
1. Compounding Looks Boring in the Beginning
In the first few years, compounding feels slow, almost invisible.
You invest, wait, and see very small growth, so people lose interest.
But compounding is like planting a tree: nothing happens for a long time… then everything happens at once.
Early years test your patience. Later years reward it.
2. People Want Fast Results, Not Slow Success
Most traders and investors chase quick profits, because excitement feels better than discipline.
Compounding requires consistency, which feels “boring” compared to high-risk trades.
This impatience makes people break the process before results can appear.
Compounding is slow at first, but permanent later.
3. The Growth Is Invisible Until It Explodes
Compounding does almost nothing for years, then suddenly grows exponentially.
By the time people understand how powerful it is, they’re already 10–15 years behind.
This is why older investors say, “I wish I started earlier.”
The curve is flat… until it goes vertical.
4. Lack of Discipline Breaks the Magic
Skipping contributions here and there reduces future growth dramatically.
Touching invested money destroys compounding momentum.
Consistency, not intelligence, creates compounding returns.
You don’t need to be brilliant. You need to be consistent.
5. People Underestimate Time More Than Money
You can always earn more money, but you can’t earn more time.
The earlier you start, the stronger compounding becomes.
A 25-year-old investing small amounts beats a 40-year-old investing large amounts.
Time is the real multiplier.
Rahul’s Tip:
Compounding doesn’t reward the smartest or richest.
It rewards the most patient.
If you start early, stay consistent, and let time do the heavy lifting, your future wealth becomes unavoidable.
Conclusion:
People don’t believe in compounding because it doesn’t give instant gratification.
But the moment they understand how powerful exponential growth truly is, it’s usually too late.
Start early. Stay patient. Let years, not emotions, build your wealth.
If this post shifted your mindset about long-term investing, like it, comment your thoughts, and follow for more clarity-focused finance lessons!
Havells at multi TF support 1. Price is at monthly 50 EMA, could prove to be a good supply point.
2. In weekly, Price at 200 SMA. Also, the RSI is at support level of 40.
3. Daily RSI showing bullish divergence & Price is at support trendline.
All these supports from multiple timeframes could constitute a reversal for long-tern in Havells. Trade is risk-reward favorable. SL to planned as per own analysis.
P. S. - Not a SEBI registered analyst & definitely not a buy recommendation. Please do your due diligence before planning to buy.

How to Identify Multibagger Stocks Using Fundamentals?Hello Traders!
Many people look for multibagger stocks, but only a few understand how to find them. A real multibagger comes from a strong business, not luck. Here are simple fundamentals that help you identify a stock with long-term growth potential.
1. Look for Steady Revenue Growth
A multibagger company grows its sales every year.
Check at least 5 years of consistent growth.
If sales keep increasing, the business is moving in the right direction.
2. Look for Rising Profits and Better Margins
Profit should grow faster than sales.
Higher margins show the company is becoming stronger.
A profitable company can grow without stress.
3. Choose Low-Debt Companies
High debt is a danger sign.
A company with low or zero debt is more stable.
Low debt means less risk during tough times.
4. Check If the Company Has a Strong Advantage
A multibagger usually has something special compared to others.
This can be brand power, technology, low cost, or unique products.
A strong advantage helps the company stay ahead.
5. Study the Management
Good leaders build strong companies.
Look at their track record and decisions.
Honest and stable management is a positive sign.
6. Make Sure the Industry Has Growth
Even a good company cannot grow in a dead industry.
Choose businesses in fast-growing sectors.
Industry growth supports stock growth.
7. Enter at a Fair Price
Even the best company is risky if bought too high.
Compare the valuation with industry averages.
A good business at a fair price becomes a powerful long-term winner.
8. Check Promoter Holding
High promoter holding shows confidence.
Avoid companies where promoters have pledged shares.
When promoters believe in the company, it’s a strong signal.
9. Watch Return Ratios (ROE, ROCE)
A good multibagger maintains ROE and ROCE above 15 percent.
High return ratios mean the company uses money wisely.
These ratios should be steady or rising.
10. Think Long Term
Multibaggers take time to grow.
Focus on the business, not daily price moves.
Long-term thinking builds real wealth.
Rahul’s Tip:
Multibaggers are found through simple research, not hype. Look for strong fundamentals, good management, and fair value. Then hold with patience.
Conclusion:
Finding a multibagger is all about understanding the business. Choose companies that grow steadily, stay financially strong, and have a clear future. With patience and discipline, wealth will follow.
FLUENCE ENERGYFLUENCE ENERGY MADE DOUBLE BOTTOM with DIVERGENCE in monthly chart and also in process of forming CUP & HANDLE FORMATION, and it is at resistence level at $24, if it breaksout resistance at $24 we can expect to reach $30 & $44.
Chart analysis done on best of my knowledge, it may reach or may not reach targets :-)

Warren Buffett Core Rules for Building Wealth!Hello Traders!
Warren Buffett is known as the “Oracle of Omaha” not because he picks magical stocks, but because he follows timeless principles that build wealth slowly and safely.
His rules are simple, but powerful, and every trader or investor can learn from them.
1. Rule No. 1: Never Lose Money
Buffett’s first rule is all about capital protection.
Before entering any investment, ask one question: “What is my real downside here?”
Building wealth starts with protecting what you already have.
2. Rule No. 2: Never Forget Rule No. 1
Most people break this rule because emotions take over.
They underestimate risk and overestimate their confidence.
A smart investor never lets their guard down.
3. Invest Only in What You Understand
Buffett only invests in businesses he clearly understands.
If you don’t understand how a company makes money, you shouldn’t invest in it.
Confusion always adds risk.
4. Be Fearful When Others Are Greedy, and Greedy When Others Are Fearful
When the crowd is celebrating, assets are usually overpriced.
When the market is in panic, opportunities quietly appear.
A contrarian mindset creates long-term winners.
5. Focus on Long-Term, Not Short-Term Noise
Short-term ups and downs are temporary.
Long-term business growth is what builds real wealth.
Buffett thinks in decades, not months.
6. Buy Great Businesses at a Fair Price
Don’t chase cheap stocks, chase quality.
A great business may look expensive today, but it can reward you for years.
Price is what you pay; value is what you get.
7. Do Not Rely on Market Predictions
Buffett ignores forecasts, experts, and predictions.
He studies the business, not opinions.
You don’t need to predict the market, you need to understand what you own.
8. Build an “Inner Scorecard”
Your decisions should follow your own principles, not public opinion.
Integrity and independence are at the core of Buffett’s philosophy.
Winning long-term requires your own standards.
9. Keep Emotions Out of Money Decisions
Emotional investing leads to guaranteed mistakes.
Patience, discipline, and consistency create long-term winners.
A calm mind makes better decisions.
10. Your Best Investment Is in Yourself
The strongest returns come from your skills, knowledge, and mindset.
Books, learning, and personal development give lifelong compounding.
A smarter you creates better financial choices.
Rahul’s Tip:
Wealth-building is not complicated, staying disciplined is.
Once you start thinking long-term, the market automatically starts rewarding you.
Conclusion:
Buffett’s rules are not just investing rules, they are life rules.
Protect your capital, stay patient, stay disciplined, and invest in becoming better every day.
Wealth grows slowly… until the day it grows suddenly.
If this post helped you understand Buffett’s principles better, like it, share your thoughts in comments, and follow for more timeless wisdom!
DALMIA BHARATHello & welcome to this analysis
Technical Outlook:
In the monthly time frame its completing the formation of a Cup & Handle breakout suggesting upside levels for medium term 2800 - 3500, for long term 3800 - 5000
Accumulation can be done in the range of 1900 (on downside) 2300 (on the upside).
The view would be invalid if it goes below 1700
Fundamental Outlook
Cost and operational efficiency focus
Recognized as one of the lowest-cost cement producers in India, thanks to measures such as increased use of blended cement, alternative fuels, optimization of lead distances
As of FY25, DBL reported a net debt to EBITDA ratio of ~0.3×, indicating a relatively comfortable leverage position for now.
Growth ambition/scale expansion
The company has achieved an installed capacity milestone of ~49.5 Mtpa (million tones per annum) of cement in FY25. It has set a long-term target of 110-130 Mtpa by ~FY31.
Regional presence & market opportunity
DBL has a strong footprint in the East & South of India, which are seen as growth regions. For example, the FY25 press release emphasized expansion in the East.
Where could margin gains realistically come from?
Better pricing / improved net realizations (higher NSR/ton).
Cost reductions: fuel/coal optimization, higher renewables share, freight savings and logistics efficiency.
Product mix shift to premium / blended cement with higher realizations.
Scale / utilization improvements (spreading fixed cost)
All the best

Low Volatility, Big Opportunity? What VIX Says About Nifty.Good Afternoon!
Since market is red allover there nothing to do about it. Did some analyses with India Vix index how it gauge us with nifty 50.
How It Works :
1.When the VIX is low (as now), it means traders believe the market will stay stable prices won’t jump wildly soon. In such periods, big sudden crashes or rallies are less likely
But Analyzing nifty when Vix is between 8 to 12 generally it starts moving towards bull phase as per past example on chart.
2.When India VIX spikes sharply (say, above 18-25 or more), it means people are scared and bracing for large moves—like during COVID-19 or major elections.
Which is seen in chart from Sept'21 to Feb'22 till June'22 in Nifty when Vix was ranging between 15 to 33
Currently it ranging between 8 to 12 range which as per past may indicate a fresh leg in nifty.
But Again saying Price is King!

How to Build a Crypto Portfolio for Long-Term Wealth?Hello Traders!
The crypto market can look exciting, fast profits, new coins every week, and hype everywhere.
But those who build long-term wealth in crypto don’t chase trends; they build structured portfolios with strategy.
Let’s understand how to create a crypto portfolio that can grow steadily over time, not just in bull runs.
1. Decide Your Investment Horizon
Before buying anything, decide your goal, 3 years, 5 years, or 10 years.
Longer horizons allow you to ride out volatility and benefit from compounding.
If you’re thinking short term, you’re speculating, not investing.
2. Allocate Wisely – The 60/30/10 Rule
60%: Blue-chip cryptos like Bitcoin (BTC) and Ethereum (ETH) , the foundation of your portfolio.
30%: Promising large/mid-cap projects (Layer-1s, AI, DeFi leaders).
10%: High-risk, high-reward small-cap or emerging tokens.
This keeps your portfolio stable while still giving growth exposure.
3. Diversify Across Categories
Don’t just hold coins, diversify across crypto sectors:
~Layer-1 platforms (ETH, SOL, AVAX)
~DeFi (AAVE, UNI)
~Infrastructure (LINK, ARB)
~AI/Metaverse (INJ, RNDR, MATIC)
This ensures that if one sector underperforms, others balance your returns.
4. Use SIP or DCA Method
Instead of buying everything at once, invest gradually through Systematic Investment Plans (SIP) or Dollar Cost Averaging (DCA) .
This helps you accumulate more during dips and reduces emotional stress during corrections.
5. Secure and Rebalance Regularly
Use hardware wallets for long-term storage. Don’t keep large amounts on exchanges.
Review your portfolio every 3–6 months and rebalance to maintain original allocation.
Trim profits from overperforming assets and add to undervalued ones.
Rahul’s Tip:
Crypto investing is not about catching every rally, it’s about staying long enough to see technology grow and adoption rise. Patience is your biggest alpha.
Conclusion:
A strong crypto portfolio is like a business, diversified, secure, and managed with discipline.
If you build it smartly, it can become a powerful wealth creator over time.
If this post helped you plan your crypto journey, like it, drop your thoughts in comments, and follow for more practical investment insights!
Index Funds vs ETFs – Which is Better for Retail Investors?Hello Traders!
When it comes to passive investing, two options always come up, Index Funds and ETFs (Exchange Traded Funds) .
Both track an index like Nifty or Sensex, but the way they work is different.
Let’s break them down so you know which one suits you better.
1. What are Index Funds?
Index funds are mutual funds that replicate a market index like Nifty 50.
You can invest directly through SIP or lump sum, just like other mutual funds.
They don’t trade on the stock exchange; instead, you buy/sell via the fund house.
NAV is calculated once a day, you get units at that day’s NAV.
2. What are ETFs?
ETFs also track an index like Nifty or BankNifty, but they trade like stocks on the exchange.
You need a demat account to buy/sell ETFs.
You can trade them intraday, just like shares.
Price changes throughout the day as they trade live in the market.
3. Key Differences You Must Know
Liquidity: ETFs depend on exchange volumes. Index funds are more stable since you transact with the AMC.
Ease of Use: Index funds are simpler for beginners (no demat needed). ETFs suit traders who want flexibility.
Costs: ETFs usually have lower expense ratios, but you pay brokerage. Index funds may have slightly higher costs but no brokerage.
Investment Style: Index funds are great for long-term SIPs. ETFs are better for those who want intraday liquidity or tactical entries.
Rahul’s Tip:
If you’re just starting and prefer SIPs without worrying about trading, go for index funds.
If you’re comfortable with demat and want real-time flexibility, ETFs give you more control.
Conclusion:
Index funds and ETFs both are powerful tools for retail investors.
The “better” choice depends on your style, simple and steady with index funds, or flexible and active with ETFs.
This educational idea By @TraderRahulPal (TradingView Moderator) | More analysis & educational content on my profile
If this post made the difference clear for you, like it, drop your choice in comments, and follow for more simple investing insights!
What is Buyback & Why Companies Do It?Hello Traders!
Every now and then, you’ll hear the news, “XYZ company announces share buyback.”
But what exactly is a buyback, and why do companies spend so much money to purchase their own shares? Let’s break it down in simple terms.
1. What is a Buyback?
A buyback (also called share repurchase) happens when a company buys its own shares from the stock market.
This reduces the number of shares available in the market, which can increase the value of the remaining shares.
2. Why Do Companies Do Buybacks?
To Increase Shareholder Value: With fewer shares in circulation, earnings per share (EPS) goes up, often supporting a higher stock price.
Utilize Excess Cash: Instead of keeping large cash reserves idle, companies return value to shareholders by buying back shares.
Signal of Confidence: A buyback is often seen as management’s confidence that the stock is undervalued.
Better Than Dividends (Sometimes): Unlike dividends, buybacks can be more tax-efficient for both the company and investors.
3. Does Buyback Always Mean Positive?
Not necessarily, Sometimes companies use buybacks to artificially boost EPS without real growth. If the business fundamentals are weak, a buyback is just a short-term push and doesn’t solve deeper issues.
Rahul’s Tip:
Don’t buy a stock just because of a buyback announcement. Always check if the company has strong fundamentals, healthy cash flows, and a genuine reason behind the buyback.
Conclusion:
A buyback is a powerful tool, but only when backed by strong business performance.
It can reward long-term shareholders and show management’s faith in the company.
But as smart investors, we should look beyond the headline and judge the real financial health.
By @TraderRahulPal (TradingView Moderator) | More analysis & educational content on my profile!
If this post made buybacks clear for you, like it, share your view in comments, and follow for more simple investing insights!
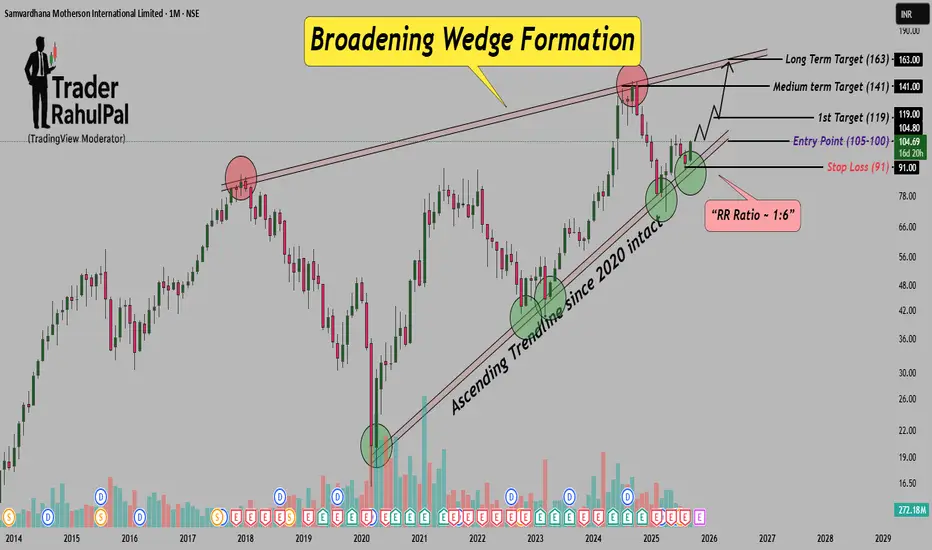
Motherson forming Broadening Wedge, Trendline support since 2020Hello Traders! Samvardhana Motherson – Broadening Wedge Breakout with Ascending Trendline Support
I hope you all are doing good in life and in your trading journey as well. Today I have brought a stock which is showing a dhamaka setup on the monthly chart – Samvardhana Motherson International . The stock is trading inside a Broadening Wedge Formation and respecting a strong ascending trendline since 2020 . Recently, it again bounced from the support zone near ₹91, which clearly shows demand and buyers’ confidence at lower levels.
The ideal entry zone lies between ₹100–₹105 with a protective Stop Loss at ₹91 . On the upside, the first hurdle is at ₹119, and once that is crossed, the stock may head towards medium-term target of ₹141 and long-term target of ₹163 . Rising volumes also indicate accumulation, and a sustained breakout above ₹119 could trigger a fresh multi-month rally.
Disclaimer: This analysis is for educational purposes only and should not be taken as financial advice. Please do your own research or consult your financial advisor before investing.
Analysis By @TraderRahulPal (TradingView Moderator) | More analysis & educational content on my profile
👉 If you found this helpful, don’t forget to like and follow for regular updates.
What is ADR/GDR – How Indian Companies Get Foreign Investors!Hello Traders!
You may have heard terms like ADR and GDR when companies talk about raising money abroad. These instruments allow Indian companies to get international investors without directly listing on foreign stock exchanges. Let’s understand them in simple words.
What is an ADR?
ADR stands for American Depository Receipt .
It is a certificate issued by a US bank that represents shares of a foreign company (like an Indian company). These ADRs trade on US stock exchanges just like normal US stocks.
Example: Infosys and Wipro have ADRs listed in the US.
Advantage: US investors can buy Indian companies without dealing with Indian exchanges.
What is a GDR?
GDR stands for Global Depository Receipt .
It works the same way as ADR, but instead of being limited to the US, GDRs are listed on global exchanges like London or Luxembourg.
Example: Many Indian companies raise funds through GDRs in Europe.
Advantage: Gives access to a larger pool of foreign investors.
Why Do Companies Issue ADR/GDR?
Access to Foreign Capital: Helps Indian companies raise funds from global investors.
Better Visibility: Being listed abroad increases global recognition of the company.
Diversified Investor Base: Attracts institutional investors who may not invest directly in Indian markets.
Liquidity: Allows more trading activity and easier buying/selling internationally.
Rahul’s Tip:
ADR/GDR listings are a sign that a company wants to expand globally and attract foreign capital. But as an investor, always check if the company is fundamentally strong before getting influenced by the “global listing” tag.
Conclusion:
ADR and GDR are simple tools that connect Indian companies with foreign investors.
While ADRs are limited to the US, GDRs open doors to global markets.
For long-term investors, these instruments show how Indian companies are scaling globally.
If this post made ADR/GDR clear for you, like it, share your thoughts in comments, and follow for more market education in simple language!
Flexi Cap Funds vs Multi Cap Funds – What’s the Difference?Hello Traders!
When it comes to equity mutual funds, many investors get confused between Flexi Cap and Multi Cap funds. Both invest across large, mid, and small-cap stocks, but there’s a key difference in how they are managed. Let’s break it down in simple words.
What are Multi Cap Funds?
Multi Cap Funds are required by SEBI rules to invest a minimum of 25% each in large-cap, mid-cap, and small-cap stocks.
This means:
They are compulsory diversified .
Even if small caps are risky at the moment, the fund manager must still hold at least 25% exposure.
Good for investors who want fixed diversification across all categories.
What are Flexi Cap Funds?
Flexi Cap Funds, as the name suggests, have full flexibility. The fund manager can invest in large, mid, or small-cap in any proportion, depending on market conditions.
This means:
No fixed rule for allocation.
The fund manager can go 70% large-cap in volatile times or shift more to small/mid-caps when opportunities are strong.
Good for investors who trust the fund manager’s judgment.
Key Differences You Should Know
Flexibility: Multi Cap = fixed allocation, Flexi Cap = flexible allocation.
Risk Level: Multi Cap has balanced risk due to compulsory exposure. Flexi Cap risk depends on manager’s calls.
Return Potential: Flexi Cap may deliver better returns in the hands of a skilled manager, but also comes with higher dependency on their decisions.
Investor Type: Multi Cap suits investors wanting rule-based diversification. Flexi Cap suits investors comfortable with dynamic allocation.
Rahul’s Tip:
If you want steady exposure across all market caps, Multi Cap funds are safer. But if you believe in the fund manager’s ability and want more flexibility, Flexi Cap funds can give you better opportunities.
Conclusion:
Both categories have their place in a portfolio. The choice depends on your risk appetite and trust in active fund management.
Remember, what matters most is not just category, but consistent performance and fund manager track record.
If this post cleared your confusion, like it, share your view in the comments, and follow for more simple investing insights!
Fundamentals Don’t Make You Rich Fast They Make You Rich ForeverHello Traders!
Most new investors want quick returns. They search for shortcuts, tips, and hot stocks to double their money overnight. But the reality is, wealth built on shortcuts usually disappears just as fast.
Fundamentals may feel boring because they don’t promise overnight success. But in the long run, they are the only reason you can create wealth that lasts. Let’s break this down.
1. Fundamentals Build Strong Foundations
A stock backed by consistent earnings, low debt, and strong management may not give you 50% returns in a week.
But over 5–10 years, such companies quietly multiply your money with stability.
2. Quick Gains Fade, Fundamental Gains Stay
A stock bought on hype can double quickly, but the same hype can collapse just as fast.
On the other hand, companies with strong fundamentals recover even after market crashes, because the business itself is valuable.
3. Time Works With Fundamentals
The longer you stay invested in a fundamentally strong company, the more compounding works in your favor.
Markets reward patience, fundamentals give you the confidence to hold.
Rahul’s Tip:
Don’t confuse speed with success.
The goal is not to get rich fast, but to stay rich forever. Fundamentals may be slow, but they are steady, and steady wins in wealth creation.
Conclusion:
Fast money comes and goes, but fundamental investing creates permanent wealth.
If you want to stop chasing quick profits and build a portfolio that lasts, start focusing on the strength of the business, not the speed of price moves.
If this post gave you clarity, like it, share your thoughts in the comments, and follow for more simple and practical investing wisdom!
What Smart Money is Doing When You’re Panicking?Hello Traders!
If you’ve been in the market long enough, you’ve seen this happen: the market suddenly drops, red candles everywhere, and social media explodes with fear. Retail investors start selling in panic, desperate to protect whatever is left.
But here’s the truth, when retail is panicking, smart money is calmly preparing to profit . Let’s understand exactly how.
1. Smart Money Buys When Retail Sells
Retail investors often believe that falling prices mean danger. For smart money, falling prices mean discounts . When everyone rushes to exit, prices get pushed far below their true value. That’s the exact moment institutions step in quietly to accumulate quality stocks.
Example: During COVID-19 crash, while retail was rushing to sell at 8,000 Nifty levels, institutions were loading up. Two years later, Nifty doubled. Retail sold in fear, smart money doubled their wealth.
The lesson? When you sell in panic, someone else is buying, and that “someone” is usually smarter than you.
2. They Focus on Value, Not Headlines
Retail reacts to news, WhatsApp forwards, and TV anchors shouting “Market crash!” Smart money reacts to fundamentals . They don’t care if Nifty fell 300 points today, they’re looking at earnings, cash flow, debt levels, and long-term trends.
For them, a temporary correction doesn’t change the long-term story of a strong company. They wait for such moments because panic-driven prices give them a margin of safety.
So while retail sells HDFC Bank in fear of a 5% fall, smart money sees it as an opportunity to accumulate a fundamentally strong business.
3. They Manage Risk, Not Emotions
The biggest difference between smart and retail money is not knowledge, it’s discipline. Retail enters big positions without planning, and when price falls, emotions take over. That’s why they panic-sell.
Smart money, on the other hand, sizes their positions correctly, uses hedges, and accepts that volatility is normal. They don’t panic when markets fall because they already prepared for it. For them, volatility is a feature, not a bug.
Rahul’s Tip:
Whenever you feel the urge to panic-sell, pause and ask yourself:
“Who is on the other side of my trade?”
If you are selling in fear, someone with deeper research and bigger pockets is buying with confidence. Don’t make it easy for them. Train yourself to think like the smart money, calm, patient, and disciplined.
Conclusion:
Markets will always move in cycles of fear and greed. Most retail investors buy when everything looks safe and sell when fear is highest. Smart money does the exact opposite, and that’s why they consistently outperform.
If you want to change your results, you need to change your behavior. Don’t let panic dictate your decisions. Think like the institutions: focus on fundamentals, manage risk, and stay calm when others lose control.
If this post helped you see the difference between smart and retail money, like it, drop your thoughts in the comments, and follow for more real-world trading psychology insights!
Why Most Retail Investors Buy at the Top and Sell at the Bottom!Hello Traders!
Most retail investors often struggle with timing the market. They end up buying when prices are high and panic-selling when markets fall. Let’s break down why this happens and how you can avoid it.
The Psychology Behind the Mistake
Fear of Missing Out (FOMO): When stocks rally, people feel they might miss the opportunity. This pushes them to buy at high levels.
Panic and Fear: During corrections or crashes, emotions take over. Instead of holding, many sell in fear of further losses.
Herd Mentality: Most investors follow the crowd. If everyone is buying, they buy. If everyone is selling, they sell too.
How to Avoid This Trap
Have a Clear Plan: Define your entry and exit strategy before investing. Don’t act on impulse.
Focus on Fundamentals: Long-term value creation comes from fundamentals, not short-term price moves.
Use SIP or Staggered Buying: Instead of putting all your money at once, invest gradually to avoid catching tops.
Control Emotions: Discipline and patience are your biggest strengths as an investor.
Rahul’s Tip:
Smart investing is not about predicting the exact top or bottom. It’s about consistency, discipline, and managing risk. If you can keep emotions out of your decision-making, you’ll already be ahead of most retail investors.
Conclusion
Buying at the top and selling at the bottom is not a market problem, it’s a mindset problem. Once you fix the psychology, your investment journey becomes much smoother.
If this helped, like/follow/comment.
3 Signs a Smallcap Can Become a Multibagger!Hello Traders!
Smallcap stocks are like hidden treasure chests in the stock market, most people ignore them until they explode in value.
But how do you separate future multibaggers from risky bets?
Here are 3 signs that can help you spot the potential winners early.
1. Strong & Consistent Revenue Growth
A company that’s steadily increasing its sales is building a strong foundation.
In smallcaps, consistent revenue growth shows the business is gaining market share and customer trust.
Look for companies that can grow even in slower economic conditions.
2. Low or Zero Debt
Debt can crush small companies during tough times.
A low-debt or debt-free balance sheet means the company can focus on growth instead of paying interest.
It also makes them more attractive to institutional investors.
3. Expanding Profit Margins
If a company can improve its margins while growing sales, it means they’re becoming more efficient.
Better margins often lead to higher profits, which can push the stock price up significantly.
Rahul’s Tip:
Smallcaps can be multibaggers, but they can also be wealth destroyers if chosen poorly.
Always check management quality, industry potential, and whether the company is transparent with its investors.
Conclusion:
Finding the next multibagger isn’t about luck, it’s about spotting strong fundamentals early.
When you find a smallcap with growing sales, low debt, and improving margins, you might just be looking at your next big winner.
If this post gave you ideas, like it, share your views in the comments, and follow for more stock market insights you can actually use!
Free Cash Flow – The Most Ignored Metric That Can Save You!Hello Traders!
When most people look at a company’s financials, they stop at profits.
But smart investors know that profits on paper don’t always mean cash in hand.
That’s where Free Cash Flow (FCF) comes in, the metric that reveals the real financial strength of a business.
What is Free Cash Flow?
Free Cash Flow is the money a company has left after paying all operating expenses and making necessary investments in its business.
It’s the cash available to pay dividends, buy back shares, reduce debt, or reinvest for growth.
Why It Matters More Than Reported Profits
Cash is King:
A company might report high profits but still struggle if it doesn’t have actual cash flow.
FCF shows if the business can fund itself without borrowing.
Signals Financial Health:
Consistently positive FCF means the company generates enough money to grow and reward shareholders.
Negative FCF for many years can be a red flag unless it’s due to planned growth investments.
Protects During Tough Times:
Companies with strong FCF can survive economic slowdowns without cutting essential spending or taking on expensive debt.
How to Check It
You can find FCF in the company’s cash flow statement:
FCF = Operating Cash Flow – Capital Expenditures
Rahul’s Tip:
Don’t just chase high profits.
Always check if the company is actually generating cash, because without cash, growth and survival both become impossible.
Conclusion:
Free Cash Flow might be the most ignored metric in investing, but it’s also one of the most powerful.
It tells you if a company can stand on its own feet, grow sustainably, and protect your investment in tough markets.
If you found this useful, like the post, share your view in the comments, and follow for more practical investing tips!
Free Cash Flow – The Most Ignored Metric That Can Save You!Hello Traders!
When most people look at a company’s financials, they stop at profits.
But smart investors know that profits on paper don’t always mean cash in hand.
That’s where Free Cash Flow (FCF) comes in, the metric that reveals the real financial strength of a business.
What is Free Cash Flow?
Free Cash Flow is the money a company has left after paying all operating expenses and making necessary investments in its business.
It’s the cash available to pay dividends, buy back shares, reduce debt, or reinvest for growth.
Why It Matters More Than Reported Profits
Cash is King:
A company might report high profits but still struggle if it doesn’t have actual cash flow.
FCF shows if the business can fund itself without borrowing.
Signals Financial Health:
Consistently positive FCF means the company generates enough money to grow and reward shareholders.
Negative FCF for many years can be a red flag unless it’s due to planned growth investments.
Protects During Tough Times:
Companies with strong FCF can survive economic slowdowns without cutting essential spending or taking on expensive debt.
How to Check It
You can find FCF in the company’s cash flow statement:
FCF = Operating Cash Flow, Capital Expenditures
Rahul’s Tip:
Don’t just chase high profits.
Always check if the company is actually generating cash, because without cash, growth and survival both become impossible.
Conclusion:
Free Cash Flow might be the most ignored metric in investing, but it’s also one of the most powerful.
It tells you if a company can stand on its own feet, grow sustainably, and protect your investment in tough markets.
If you found this useful, like the post, share your view in the comments, and follow for more practical investing tips!