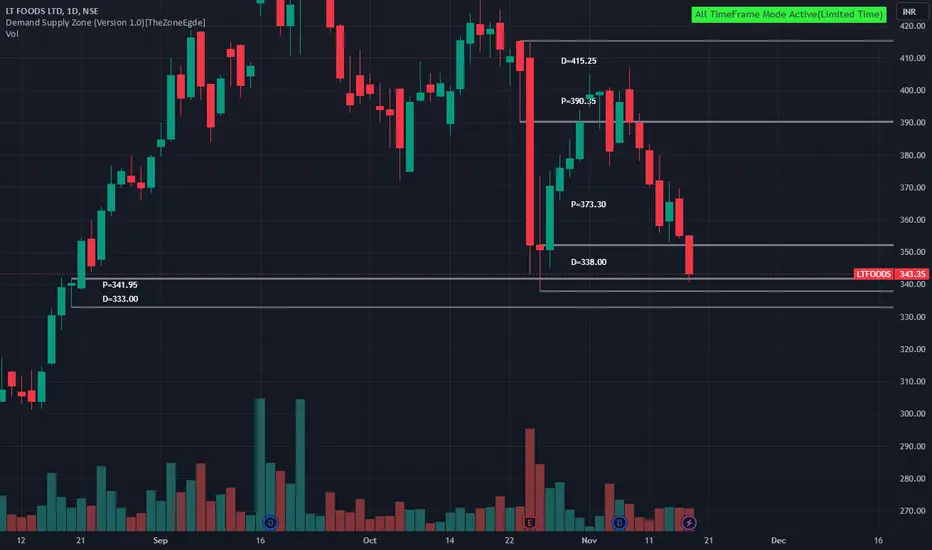
LTFOODS Trading Within Tested Demand ZoneLTFOODS is currently trading at ₹343.35, positioned within its tested demand zone between ₹341.95 and ₹333, identified on 21st August 2024. This zone has previously demonstrated support, suggesting continued buying interest around these levels. Investors may look for potential accumulation in this range, anticipating a bounce from this established support area.
Disclaimer: This analysis is for informational purposes only and should not be considered as financial advice. Please conduct your own research or consult a financial advisor before making any investment or trading decisions.
Ltfoods
upmove in LTFOODSnice base setup. cup-handle formation also found. upside 20% possible on the basis of technicals

Amazing Swing trading idea on Multi time frame for 22 MarchI make educational content videos for swing / positional trading

LTFOODS - Breakout and retest in weekly timeframeLTFOODS - Breakout and retest completed on a weekly timeframe. The stock has been in an upward trend and has excellent fundamentals. There is an immediate upside of 20% potential.

L.T. FOODS - 64% RETURNS!!!BUY - DAAWAT/ L.T. FOODS LTD
CMP - Rs. 110
Target - 1: Rs. 130
Target - 2: Rs. 160
Target - 3: Rs. 180
.
.
Technicals - Bullish Flag BO
.
This is just a view by an expert analyst, please invest at your own risk.
.
Follow me for more!

LT FOOD 160 ?Llt food is trading above 95 which is all time high of this particular stock and this script form a highly bullish pattern above all time high - morning star pattern. as per ab=cd pattern this share can easily come to 160 in next 02 month
thanks
ishu prajapati

Uptrend on the wayChart -> LT Food Daily
Higher high breaks previous higher high. And uptrend is on the way.
CMP: 114
Good Range: 110 to 114
Target: 122, 127, 136
SL: 106 Daily Close
Disclaimer: This is for educational purposes only, not any recommendations to buy or sell. As I am not SEBI registered, please consult your financial advisor before taking any action.

DAAWAT (LT FOODS LIMITED) - Double Digit Stock + Volume Breakout📊 Script: DAAWAT (LT FOODS LIMITED)
📊 Nifty50 Stock: NO
📊 Sectoral Index: NIFTY 500 / NIFTY MICROCAP 250
📊 Sector: Fast Moving Consumer Goods
📊 Industry: Food Products
Key highlights: 💡⚡
📈 Script is giving breakout of upper band of Bollinger band (BB).
📈 Crossover in MACD .
📈 Double Moving Averages crossover.
📈 It is double digit stock with huge volume then previous trading session that is volume breakout.
📈 Right now RSI is around 66.
📈 One can go for Swing Trade.
⏱️ C.M.P 📑💰- 98.75
🟢 Target 🎯🏆 - 114
⚠️ Stoploss ☠️🚫 - 91
⚠️ Important: Always maintain your Risk & Reward Ratio.
✅Like and follow to never miss a new idea!✅
Disclaimer: I am not SEBI Registered Advisor. My posts are purely for training and educational purposes.
Eat🍜 Sleep😴 TradingView📈 Repeat🔁
Happy learning with trading. Cheers!🥂

Rounding bottom on LT FoodsChart -> LT Foods Weekly
A rounding bottom from 2018 to 2022 has been completed and the stock has given an all-time high breakout with volume supports from last several weeks.
CMP: 114
Good range: Around 100
Targets: 136, 170
SL: 89.5 Weekly close
Disclaimer: This is for educational purposes only, not any recommendations to buy or sell. As I am not SEBI registered, please consult your financial advisor before taking any action.


DAAWAT LT FOOD - SWING TRADE IDEADAAWAT LT FOOD - SWING TRADE IDEA
1. Now In the small uptrend pattern resistance.
2. If it opens tomorrow above 95, It will get a good uptrend up to 105.
3. Quick 10 points... for the swing traders...
4. Need 2 support for the stock to break the all-time high, i) Indicies Market needs to support ii) Open and close above 105 will leed the stock to next level.
Note:
1. I’m not a SEBI Registered advisor, my research is personal and for educational purposes only.
2. Always check with your financial advisor and take the trade as per your risk/reward ratio.
3. Follow me for more patterns and like, and share so that we feel it is helpful to many and share more patterns...

LT Foods Ltd (DAAWAT) - 30.05.2022 LT Foods Ltd (DAAWAT) - 30.05.2022
The stock is trading @ 81.30 levels
There is a DARK CLOUD COVER in Daily Chart
The prices are below EMA
My buy entry target will be 76.50 - 78.00 levels
Resistance @ 87.80
RSI 53 in Weekly Charts
Watch out for the price action

DAAWT - Cup and Handle formationDAAWAT a leading rice brand in chain of stores is forming a cup and handle pattern, right now in a good accumulation zone. watch for breakout and fresh highs

Channel Breakout in DAAWATIn a daily time frame it break the strong resistance and stock can go till 110. All time high also 110. So stock may pause in that level therefore wait what kind of candle is forming in that range. So first target is 110. Stop loss below 80. Fundamentally company looks good. Do your own analysis before investment.


Daawat view for the next week.Daawat has taken from its monthly support levels of 62-64.
The stock is in good accumulation zone near the levels of 65.
On daily time frame the stock has closed above the resistance level of 74.3
It can give move up to 80 in the next week.

DAAWAT very short term tradeEven though the triangle patter is not as tight as expected. The price might reach this target.

LT FOODS DAILY CHART ANALYSIS AS ON 26.12.2021LT FOODS as per daily chart analysis stock above 79.45 for a target 81.45 level and resistance at 82.45 level. Nifty monthly chart forming indecisive doji , weekly chart forming bullish candle and daily chart forming a bearish candle shows this week may continue to be bearish being year end and monthly expiry in next 5 sessions.Investors may continue to book profits.Avoid fresh long positions. Nifty Support is placed at 16890 / 16837 / 16785 / 16693. Resistance is placed at 17152 / 17214 / 17378.

LT FOODS - DAAWAT - Breakout1. Formed 2 Rounding patterns
2. After that stock rallied for 40%.
3. Price retraced to previous breakout zone forming Symmetric triangle.
4. Breakout from triangle pattern
5. Price may retest by retracing to breakout zone ( 68-70) and then resume the rally to Rs.90/-

Daawat waiting for a trend line break - 1DLT foods has announced the results. The stock can probably take support and can give a good breakout soon.

LTFOODS | DAAWAT | 30% upside#LTFoods #Daawat
- Good price action + volume near trendline resistance
- Can expect a pull back b4 taking the leap forward
- 50 EMA can be also used tight SL
- Looks breakout retest on W
#trading #StockMarketindia

L.T. FOODS LTD
Target:- 112
Stoploss:- 64.60
Duration:- 8 to 10 weeks
The stock has already touch the support line and showing a bullish candle, which is an indication of upside move, so we can buy this at market order. Use proper stoploss and maintain discipline throughout the trading period and use trailing stop below all the wave step by step.

DAAWAT levels...16.09.2021 ( D candle)DAAWAT now forming buy harmonic pattern, once its sustained 68 above in some days, it will move on up to 80 in short term
