XAUUSD – PRIORITISE BUYING ON TUESDAY💛 XAUUSD – PRIORITISE BUYING ON TUESDAY 🎯
🌤 Overview
Hello everyone 💬
Gold continues its upward momentum in the first two days of the week, supported by the cash distribution policy for low-income individuals and the reopening moves by the US government under President Trump.
These factors are putting downward pressure on the USD, helping gold prices maintain a short-term upward trend.
💹 Technical Analysis
🟣 Currently, the price is touching the VAH area according to the Volume Profile and showing a slight reaction – however, the support trendline around 4110–4113 remains an ideal buying zone to continue following the trend.
🔹 The 4200–4203 area (Fibonacci Extension 2.618) coincides with the strong resistance of H4, likely to see a short adjustment reaction before continuing to extend to the 43xx area.
🎯 Trading Plan Reference
💖 BUY Scenario (priority trend-following)
Entry: 4110–4113 | SL: 4106
TP: 4132 – 4150 – 4175 – 4200 – 4250
💢 SELL Scenario (short-term reaction)
Entry: 4200–4203 | SL: 4207
TP: 4188 – 4165 – 4148
⚠️ Important Notes
Prioritise buying according to the main upward trend, especially when the price reacts at the H4 trendline.
Sell orders are only for short-term reactions, and profits should be secured early when the first TP is reached.
USD volatility remains a key factor to closely monitor this week.
🌷 Conclusion
The upward trend of gold is still maintained 💛
Be patient and wait for the price to react at the 4110–4113 area to buy according to the trend, and take advantage of pullbacks at resistance to manage orders effectively.
If you find this useful, don't forget to 💛 like – 💬 comment – 🔔 follow LanaM2 for daily gold insights ✨
M-forex

BTC/USDT Timeframe (4-hour)BTC/USDT Timeframe (4-hour)
Current price: ≈ $105,845
My drawn:
A descending trendline (showing previous resistance)
Ichimoku Cloud, and
Two target points marked with green arrows.
---
🔍 Chart Interpretation
From my image:
Price has broken above the descending trendline.
It’s also moving into/above the Ichimoku Cloud, a sign of a potential trend reversal.
My first target appears around $113,000 – $114,000, which aligns with the upper boundary of the drawn arrow.
The second target (higher arrow) points near $117,000 – $118,000, representing the extended bullish target zone.
---
🎯 Possible Targets Based on my Chart
1. Target 1: $113,000 – $114,000
(Short-term resistance / first profit zone)
2. Target 2: $117,000 – $118,000
(Next key resistance / full breakout target)
---
⚠ Risk Note
Watch for retests near $104,000 – $105,000 (the breakout zone).
If BTC closes back below the trendline or Ichimoku cloud, bullish momentum weakens.

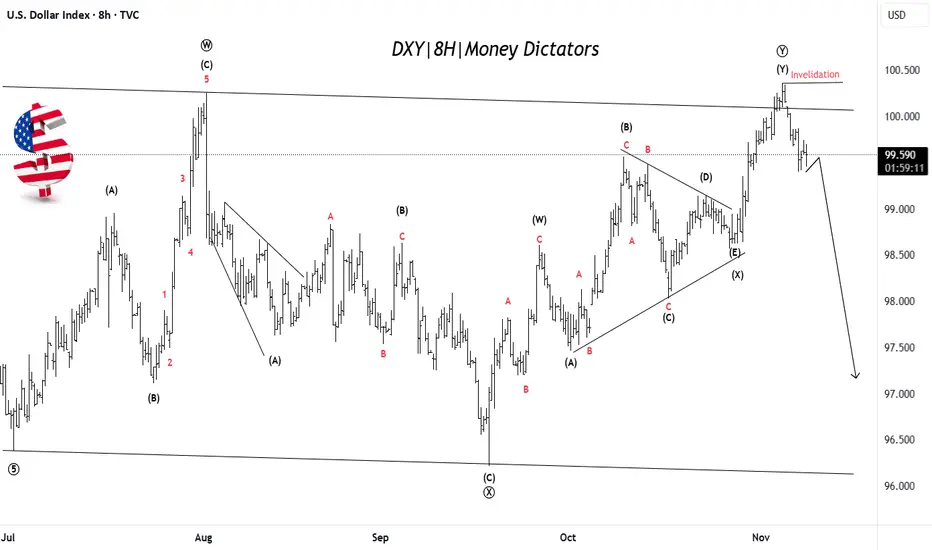
US Dollar Weakness Likely After Final Push UpDXY has completed a complex corrective W–X–Y pattern, with the final leg (Y) recently topping near the 100.50 zone. Price has failed to break above the invalidation level, suggesting the uptrend is losing strength. This signals that the dollar may have finished its corrective phase and could now start a fresh bearish wave targeting lower zones near 97–98. The overall structure indicates that momentum is shifting from bullish to bearish. In simple terms: rally is likely over → downside move toward new lows expected next.
Stay tuned!
@Money_Dictators
Thank you :)
LiamTrading – XAUUSD | Early Week Bullish Scenario...LiamTrading – XAUUSD | Early Week Bullish Scenario: Successful Box Breakout, Watch for Retest at 4056 & Deep Buy at 3998–4000
The price has just broken out of the accumulation box and accelerated as per the weekend scenario. Bullish inclination for the day, with a near-term target of 4080 → 4110; the 4110–4112 zone is a suitable psychological resistance for scalping. Prioritise buying at the 4056 retest or deep buying at 3998–4000 when the price sweeps liquidity and then rebounds.
The US Senate takes further procedural steps to end the shutdown. Expectation of systemic risk cooling → pressure on USD decreases, supporting gold in the short term.
The process still has a few steps, fluctuations around news hours might be volatile → adhere to technicals, manage risks tightly.
Technical Analysis (H1/H2) – Volume Profile • Trendline • S/R • Fibonacci
Structure & Trendline: Box breakout upwards, trend-following capital dominates. Short-term uptrend when the price holds above 4056 (retest point of breakout zone).
Support/Resistance (S/R):
Support: 4056 (retest), 4025–4038 (FVG liquidity fill), 3998–4000 (Buy Zone Liquidity).
Resistance: 4110–4112 (psychological + short-term supply cluster), 4160–4165 (Fibo extension).
Fibonacci Extension:
1.618 coincides with 4110–4112 → likely reaction/scalp sell.
2.272 targets ~4160 → extended target/final profit exit.
Today's Trading Scenario
Continuation Buy (priority)
Entry: 4056–4060 (retest of breakout zone)
SL: 4048
TP: 4080 → 4110 → 4160
Management: Move SL to breakeven at +1R; partial close at 4080/4110.
Deep Liquidity Buy (cautious volume)
Entry: 3998–4000
SL: 3992
TP: 4020 → 4045 → 4080 → 4110
Note: Enter only with clear rejection candle (long lower wick, M1–M15 reversal) or after FVG fill and rebound.
Scalp Sell at Psychological Resistance (counter-trend)
Entry: 4110–4112
SL: 4118
TP: 4100 → 4080 → 4065
Note: Abandon trade if H1 closes strongly above 4112 or if the uptrend is too strong (breakout with volume).
Invalidation & Notes
Short-term bullish bias invalidated if H1 closes below 4048 → may test deeper at 4025–4038 or 3998–4000.
Avoid entering trades close to news hours about the US government reopening process.
Risk per trade: 0.5–1%, adhere to discipline of moving SL at +1R.
If you find this useful, comment on the price levels you're watching and hit Follow on LiamTrading to receive daily updates.

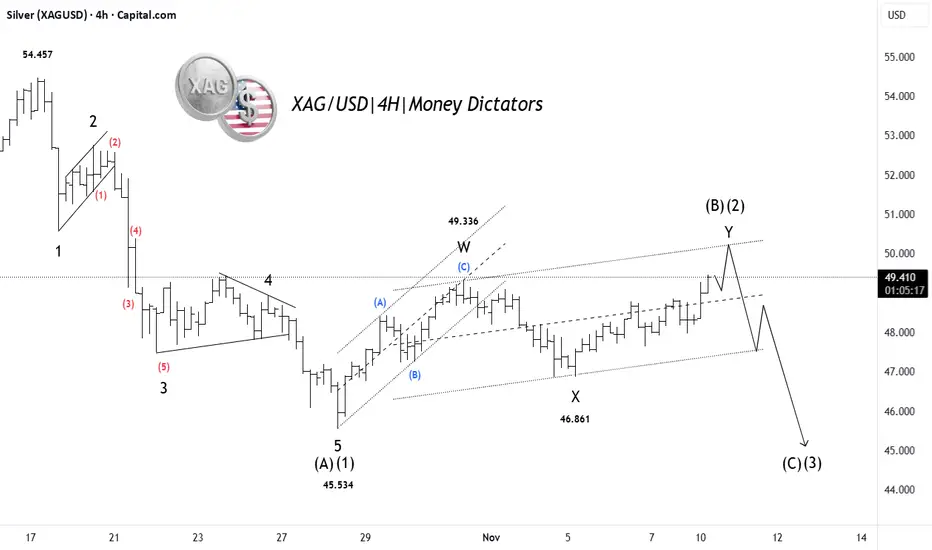
Silver Correction Ending: Major Drop AheadSilver (XAG/USD) has completed a 5-wave decline, marking the end of Wave (A)/(1) near the 45.53 level. Since then, price has been retracing upward in a complex W–X–Y corrective structure, which appears to be forming the final leg of Wave (B)/(2). The rise is losing strength near the upper channel, hinting that bulls may soon exhaust. Once Wave (B)/(2) finishes, the next big move is expected to be a strong bearish Wave (C)/(3) decline targeting lower zones near or below 45. In simple terms: last leg of correction nearly done → next big drop ahead.
Stay tuned!
@Money_Dictators
Thank you :)
GBPJPYAs you can see price is clearly in an downtrend. Nice push to the downside, and nice recovery back up. And with 4 points being made ( H,L,HL,LL) downtrend is confirmed. I marked 4H supply that aligns with 202.000 handle.
While on the 4H is a downtrend, on daily timeframe, price is in a bullish leg and now coming up from filling the imbalance. Now if I was paying attention I could get into buys at the bottom and trap the market. However that was not the case.
That can cause price to go higher and break through our supply. But that is why we wait for confirmation on smaller timeframes before entering the trade.
Remember, no confiration - no entry.

This is a GBP/JPY (4H) setup This is a GBP/JPY (4H) setup — a bearish structure with two target points clearly marked below the current price.
🧭 Chart Breakdown:
The price has broken below the ascending trendline and the Ichimoku Cloud, showing bearish momentum.
The first target point is at a nearby support level, and the second is a deeper extension move.
🎯 Targets:
First target: around 174.60 – 174.70 zone
Second target: around 172.90 – 173.00 zone
🔍 Summary:
Trend: Bearish below 176.50
Targets:
TP1 → 174.60
TP2 → 172.90
Invalidation: Break back above 176.80 (re-entry into the cloud/trendline)

ETH/USDT (4H) chartETH/USDT (4H) chart:
The price is currently trading near a support zone (around $3,250–3,300).
The chart shows a potential bullish setup with two marked target points above.
The Ichimoku Cloud suggests resistance around mid-levels before a full reversal.
Here’s the breakdown 👇
🔹 Key Levels:
Support zone: $3,250 – $3,300
First target (inside the cloud): around $3,700 – $3,750
Second target (top / resistance zone): around $4,150 – $4,200
🔹 Summary:
If ETH holds the current support and breaks above the cloud:
Target 1: ≈ $3,700
Target 2: ≈ $4,200
Invalidation: below $3,200 (support breakdown)

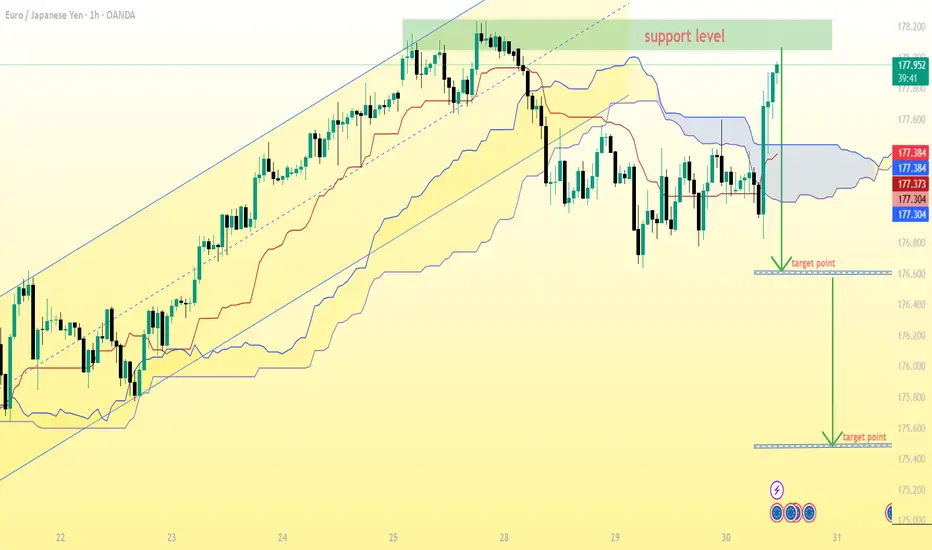
EUR/JPY (1H) chartEUR/JPY (1H) chart, here’s what can be interpreted based on my annotations and price action:
Support level (green zone): around 178.00 – 178.20
Current price: 177.88
Breakdown below cloud: already happened previously, price retested resistance (support turned resistance) and dropped again.
My also drawn two target points below — one short-term and one deeper move.
---
🎯 Target Analysis
From my markings and price structure:
First target (short-term): around 176.40 – 176.50
→ This aligns with my first green arrow and matches a previous minor swing low.
Second target (main target): around 175.20 – 175.30
→ This is the lower arrow, which aligns with the bottom of my previous structure (major support zone).
---
📊 Trade Idea Summary
If my looking at a short setup (since price rejected the resistance zone):
Sell Entry: below 177.70 (confirmation of rejection)
Target 1: 176.40
Target 2: 175.20
Stop-loss: above 178.20 – 178.30 (just above resistance zone)
---
⚖ Risk/Reward (approximate)
If entering at 177.70:
SL: 178.30 (≈ 60 pips risk)
TP1: 176.40 (≈ 130 pips reward)
TP2: 175.20 (≈ 250 pips reward)
➡ R:R = 1:2 to 1:4
---
✅ Conclusion:
My first target is 176.40, and my main target is 175.20.
This setup looks valid if price stays below the 178.00 resistance and cloud confirms bearish momentum.
AUD/JPY 4H chartAUD/JPY 4H chart:
The price was in an upward channel, then broke down sharply below both the Ichimoku cloud and the support trendline.
There’s a clearly marked resistance zone around 100.2–100.6, which the price rejected strongly.
The chart shows a target line drawn downward from the breakout area.
Based on the image, the target point appears to be around the 97.80–98.00 zone.
🔍 Summary:
Resistance: 100.2–100.6
Current price: ≈ 99.21
Bearish breakdown target: 97.8–98.0
Bias: Bearish continuation while below 99.6

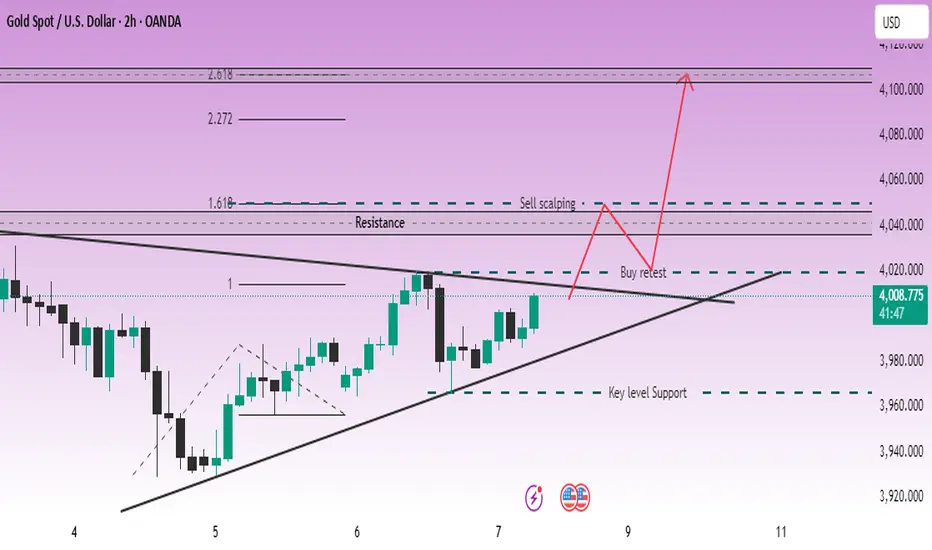
LiamTrading – Gold compressed at the triangle peak; watch for...LiamTrading – Gold compressed at the triangle peak; watch for a break at 4020 (H2)
After a week of accumulation, the price is pressing against the triangle peak between the descending trendline (from late October) and the ascending trendline (from 5/11). The advantage will clearly lean towards an increase if 4020 is broken and held.
Technical Analysis (prioritise H2, Volume Profile – Trendline – S/R – Fibonacci)
Trendline & Structure
The descending trendline is blocking recovery waves; the ascending trendline supports adjustment waves.
Closing the H2 candle above the confluence area ~4020 will confirm a clear upward movement.
Support / Resistance (S/R)
Main support: 3970–3972 (swing low & “Key level Support”).
Decision zone: 4014–4020 (break–retest zone).
Resistance: 4045 (medium-term), 4050 (supply for scalp orders), upper band 4105–4110.
Volume Profile (recent session / composite)
POC magnet: 4015–4017 → likely profit-taking/fluctuations; staying above POC turns this area into a launchpad.
LVN: around 4020 → beautiful break-and-go; failing to hold often pulls back to 4015/4010.
Fibonacci Extension (H2 swing)
1.618 coincides with 4045–4050 → first upward target.
2.272/2.618 creates a liquidity zone 4095–4110 → area may weaken/strong profit-taking.
Today's Trading Scenarios
Scenario 1 – Buy on breakout direction
Entry: 4020–4022 after closing above trendline + retest holding 4018–4020
SL: 4014
TP: 4045 → 4070 → 4100–4110
Management: Partially close at 4045; move SL to breakeven when reaching +1R. Staying above 4020 means POC 4015–4017 should switch roles to support.
Scenario 1b – Buy on adjustment wave (before breakout, cautious volume)
Entry: 3998–4002 (“400x”) when there is an upward reaction at the ascending trendline
SL: 3988
TP: 4017 → 4045
Note: H2 closes below 3988 → cancel the order.
Scenario 2 – Sell scalp at resistance
Entry: 4048–4052 (confluence Fibo 1.618 + supply zone)
SL: 4056
TP: 4040 → 4030 → 4020
Note: This is counter-trend. Ignore if H2 closes strongly above 4052.
Summary
The upward bias is confirmed when breaking–holding 4020, opening targets 4045 → 4070 → 4100+. Before that signal, trade within the range respecting POC 4015–4017 and ceiling 4045/4050. Risk per order 0.5–1%, move SL to BE when reaching +1R.
(ETH/USD, 3-hour imeframe...(ETH/USD, 3-hour timeframe, Bitstamp):
The chart clearly shows a descending channel with price breaking below the lower boundary, confirming strong bearish momentum.
The Ichimoku Cloud is fully bearish, and price action is below all major cloud levels — confirming continuation to the downside.
My chart already shows a target point marker at the lower projection level.
📉 Target analysis (based on my chart + structure):
Current Price: ≈ $3,511
Immediate Target (TP1): Around $3,400 (shown near the “target point” on my chart)
Next Target (TP2): Around $3,300 — previous horizontal support & channel extension
Extended Target (TP3): Around $3,180 – $3,200, if bearish momentum accelerates
🔒 Stop-loss (for short trades):
Above $3,650 – $3,700 (upper boundary of current consolidation zone / channel midline)
📈 Summary:
Trend: Bearish continuation
TP1: $3,400
TP2: $3,300
TP3: $3,180
SL: $3,650 – $3,700

Real Knowledge of MarketCore Foundational Knowledge
Derivatives Basics: Options are derivative contracts, meaning their value is derived from an underlying asset (stocks, indices, commodities, etc.).
Key Terminology: A trader must be fluent in terms like call options (right to buy), put options (right to sell), strike price, premium, expiration date, intrinsic value, and time value.
Rights vs. Obligations: Understanding that option buyers have the right, but not the obligation, to exercise, while option sellers (writers) have the obligation if exercised, is fundamental to risk assessment.
Leverage: Options offer significant leverage, meaning a small amount of capital can control a large position in the underlying asset, which amplifies both potential profits and losses.

Real value of Market # Entry #Exit #Trail # StoplossThe phrase "Market # Entry #Exit #Trail # Stoploss" refers to the core parameters of a structured trading plan. The "real value" does not imply a single numerical figure, but rather the monetary gain or loss realized from a trade based on how these elements are defined and executed, combined with the discipline to follow them consistently.
Market: The specific financial instrument or market being traded (e.g., a particular stock, currency pair, or commodity).
Entry: The predefined price level or condition at which a trader opens a position. A good entry can offer a favorable risk-to-reward ratio from the start.
Exit: The predefined strategy or points at which a trader closes a position, either to take a profit or to limit a loss. Exits are crucial as they determine the final profit or loss.
Trail: Refers to a trailing stop-loss order, a dynamic risk management tool that automatically adjusts the stop-loss level as the market price moves in the trader's favor. This locks in profits while allowing the trade to continue if the price keeps moving favorably.
Stoploss (SL): A pre-determined price level or percentage below (for a long position) or above (for a short position) the entry price where the position is automatically closed to prevent further losses if the market moves against the trader.

XAG/USD (Silver vs USD) chart on the 2-hour timeframe...XAG/USD (Silver vs USD) chart on the 2-hour timeframe:
Price is moving within a descending channel, still below the Ichimoku cloud, indicating continued bearish pressure.
The recent candle is showing a rejection from the upper band of the channel / cloud resistance area (around 47.9–48.1).
My marked two target points on the chart — both aligning with the lower parts of the descending channel.
🎯 Target Zones (Bearish Outlook)
1. First target: around 46.00 – 46.20
→ This aligns with the mid-channel support and my first “target point” marking.
2. Final target: around 42.00 – 42.30
→ This corresponds to the lower channel boundary and my second, deeper target point on the chart.
🔹 Summary
Bias: Bearish below 48.10
Entry area: 47.8 – 48.0 rejection zone
Targets:
🎯 TP1 = 46.10
🎯 TP2 = 42.20
Invalidation: A sustained close above 48.20 would weaken this bearish structure and could trigger a cloud breakout.

GBP/USD (1-hour) chart...GBP/USD (1-hour) chart:
Price is moving within a descending channel, and currently testing the upper boundary of that channel.
The Ichimoku cloud above the price suggests a bearish bias, as price remains below the cloud.
There’s a projected leg down (green arrow) marked on my chart — pointing toward the lower channel line.
🎯 Likely Target Zone
If the move respects the current channel and the upper rejection holds:
Short-term downside target: around 1.2910–1.2920, aligning with the lower channel trendline and my marked “target point.”
Intermediate resistance: near 1.3040–1.3060 (top of the cloud / channel upper edge).
Summary:
📉 Sell bias below 1.3040
🎯 Target: 1.2910–1.2920
❌ Invalidation: If price breaks above 1.3070 with strong candles (then potential reversal).

XAUUSD – PRIORITISE BUYING, TARGET 4040XAUUSD – PRIORITISE BUYING, TARGET 4040 🎯
🌤 1. Overview
Hello everyone 💬
My perspective on gold today remains to prioritise buying, as there hasn't been a clear deep decline.
The price is currently consolidating in a narrow range, needing more time to build momentum before breaking out.
I will wait to buy back at the OB area – where there is high liquidity, this is a region likely to see strong price reactions.
The best scenario today: the price may sell lightly at FVG, then drop to OB to trigger the buy setup.
💹 2. Technical Analysis (ICT Perspective)
💜 Price Structure: Gold still maintains a short-term uptrend, the main trend hasn't been broken.
💎 Liquidity: Liquidity is concentrated below the 3940 area – potential buying OB.
💫 FVG: The 3975–3980 area is where a slight decline reaction may occur.
⚙️ Order Block (OB): 3938–3945 is a crucial support area, with potential for a strong price rebound from here.
📈 Main Target: 4040 – high liquidity area, coinciding with the large frame FVG.
🎯 3. Reference Trading Scenario
💢 Short SELL (scalping)
Entry: 3980 | SL: 3988
TP: 3972 – 3960 – 3940
💖 Main BUY (priority)
Entry: 3940 | SL: 3932
TP: 3952 – 3968 – 3990 – 4012 – 4035
✨ 4. Important Notes
🔹 Observe price reactions at FVG and OB before taking action.
🔹 If the price exceeds 3988, the decline scenario is temporarily invalidated.
🔹 The main direction remains to buy following the Smart Money trend – only look for short sells with confirmation.
🌷 5. Conclusion & Interaction with LanaM2
Gold is still on the right track of the Smart Money Flow,
patiently wait for the price to reach a favourable area to act 💪
This is not investment advice, just a personal perspective based on the ICT method.
If you find it useful, please 💛 like – 💬 comment – 🔔 follow LanaM2
to stay updated with the latest gold insights every day.

Gold Price Action: Healthy Pullback Within Broader UptrendGold is currently trading within a well-defined range on the daily timeframe, consolidating between 3,910 and 4,025 on a closing basis. Over the past several sessions, we've witnessed multiple attempts by buyers to reclaim the psychological 4,000 level, but sellers have consistently stepped in during intraday rallies, keeping the price action contained within this range.
From my perspective, this consolidation is likely to persist for a while longer. Looking ahead, I anticipate the range could potentially extend between 3,850 and 4,200 over the coming weeks as market participants digest recent moves. It's worth noting that we should prepare for a worst-case scenario where price breaks below 3,850 on a closing basis, especially given that volatility tends to pick up during year end trading.
That said, My view in this current phase as a healthy correction within the broader bull market. My bias remains tilted toward the buy side, and I'm expecting a potential resumption of the uptrend somewhere in the next 1-2 months, possibly around mid-January. The key here is patience with money management allowing this consolidation to play out while staying ready to capitalize on the next directional move. As always, proper risk management is crucial, particularly with year-end volatility on the horizon.

AUD/NZD Nearing Peak: Expect Controlled PullbackAUD/NZD has completed a clean 5-wave impulsive move to the upside, finishing Wave (1)/(A) near the recent peak. From here, the price looks ready to start a deeper correction in the form of Wave (2)/(B), which may pull back toward the lower support zone inside the rising channel. This corrective move could unfold in multiple legs before turning bullish again. Once Wave (2)/(B) completes, the chart expects a strong rally into Wave (3)/(C), aiming for new highs. In simple terms: a healthy pullback first, then a powerful upside continuation.
Stay tuned!
@Money_Dictators
Thank you :)

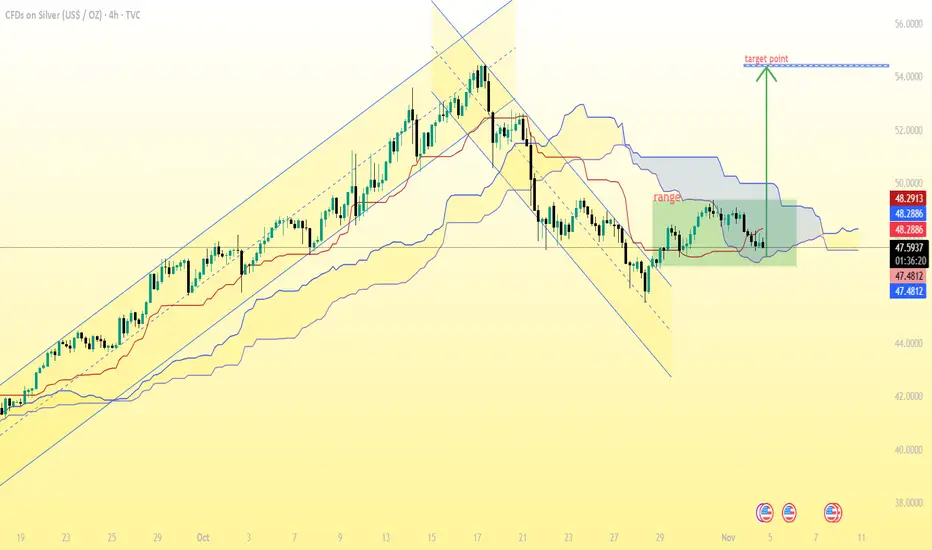
(Silver / USD, 4H timeframe)...(Silver / USD, 4H timeframe):
✅ Analysis Summary:
The price has broken out of a falling channel and is now moving inside a range, just below the Ichimoku cloud.
The projected move (marked on my chart) shows a bullish breakout from the range.
The measured move target from the breakout zone points upward to the $52.15–$52.50 area.
📈 Target Levels:
Immediate resistance: $48.30 – $48.70
Breakout confirmation: Above $49.00
Main bullish target: $52.10 – $52.50
Extended target (if strong momentum): $53.80 – $54.00
📉 Support levels:
$47.50 (near cloud base)
$47.00 (range bottom)
➡ Conclusion:
If Silver sustains above $49.00, the next target is $52.15 – $52.50 as shown in my chart.
If it fails to hold above $47.50, the bullish setup becomes invalid.
L
(EUR/USD, 2-hour timeframe...(EUR/USD, 2-hour timeframe, with Ichimoku Cloud and descending channel):
The price is currently breaking below the lower channel boundary and the Ichimoku Cloud is fully bearish — both strong continuation signals.
The chart shows a projected “Target Point” zone around 1.1415, which seems to be the first target area marked.
If bearish momentum continues below 1.1415, the next extended downside targets can be:
TP1: 1.1415 (already shown on my chart)
TP2: 1.1380 (next support zone from previous swing)
TP3: 1.1350 (major channel base & psychological support)
📉 Summary:
Trend: Bearish
Immediate Target: 1.1415
Next Targets (if breakdown continues): 1.1380 → 1.1350
Stop-loss (for shorts): Above 1.1485–1.1500 (upper channel resistance)

GOLD TRADING INSIGHTS TODAY WITH LUCYGOLD TRADING INSIGHTS TODAY WITH LUCY 💛
Hello everyone 🌸
The gold market (XAUUSD) today is showing many interesting signals as the price continues to test the crucial trendline area. Traders' sentiment is quite cautious at the moment – both buyers and sellers are “squaring off” around the liquidity balance zone.
🔍 Technical Analysis
On the chart, gold is moving within a narrowing triangle price channel – this indicates momentum is accumulating, and when the price breaks in either direction, the subsequent volatility will be very strong ⚡
Currently, the price is reacting around the main trendline, but there is no clear breakout signal yet.
In my personal view, the probability of a decline remains higher, however, further confirmation is needed before entering a trade.
The important point to note is the support area at 3965, which is the key boundary to confirm a clear downtrend.
If the price breaks through this area, the possibility of extending towards the Fibonacci 2.618 area around 3890 is entirely possible.
⚙️ Price Levels to Watch
Currently, the 3990 – 4012 area is short-term resistance, where sellers may reappear.
Meanwhile, the 3965 – 3945 – 3920 areas are the main supports that need close observation.
If the price continues to hold above 3945, the likelihood of a short-term rebound is quite high.
🎯 Today's Trading Scenario
💼 Buy: 3945
⛔ SL: 3938
🎯 TP: 3958 – 3977 – 3992 – 4012
💼 Sell: When the price clearly breaks below support 3965
⛔ SL: Above the breakout area
🎯 Expected TP: extending towards the Fibonacci 2.618 area around 3890
I still prefer to observe the price reaction at the trendline area, and only act when there is clear confirmation — because in a triangle pattern, the patient one will always be the winner 🌙
⚠️ Note & Conclusion
The above analysis reflects only Lucy's personal perspective, based on Trendline – Fibonacci – ICT factors 📊
This is not investment advice.
Please share your views on gold in the comments section 💬
And don't forget to follow Lucy for daily updates on insightful analyses —
where technical analysis merges with market emotions 💫🌸

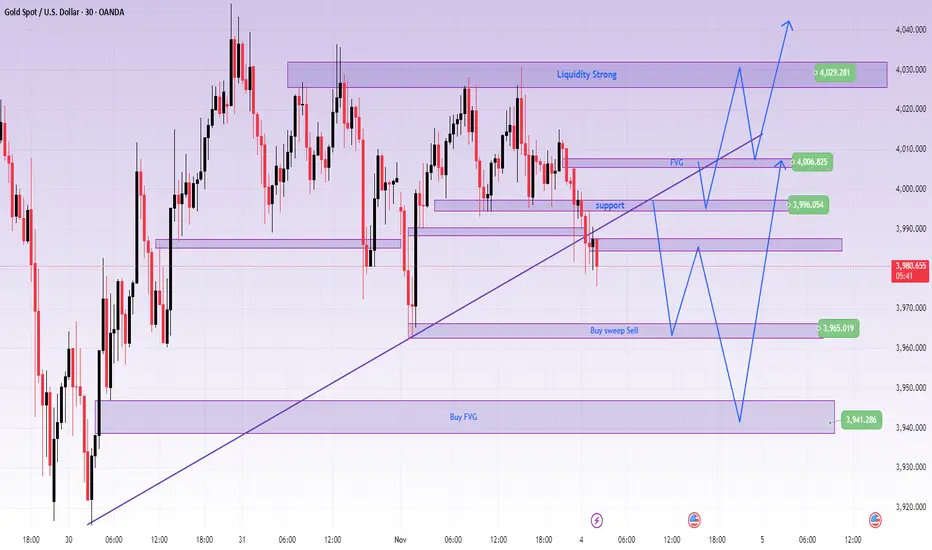
GOLD CONFIRMS SHORT-TERM DECLINE AFTER BREAKING TRENDLINEXAUUSD – GOLD CONFIRMS SHORT-TERM DECLINE AFTER BREAKING TRENDLINE
🪞 1. Overview
🌤️ In the Asian session this morning, gold broke the upward trendline even though the selling pressure wasn't particularly strong.
However, this is the first signal indicating that the short-term trend is leaning towards the sellers.
💬 Currently, the 3996 level is a significant resistance, and the price might retest this area before continuing to decline.
If the price surpasses the FVG at 4007, the trend might temporarily rebound in the short term.
💹 2. Technical Analysis (ICT Perspective)
🔸 Market structure: After breaking the trend, the structure temporarily shifts to short-term bearish.
🔸 Liquidity & FVG: Liquidity is drawn to the 3960–3940 area, while FVG 4007 is the first barrier.
🔸 Order Flow: Smart Money may lightly sweep up to the resistance area before pushing the price further down.
🎯 3. Reference Trading Scenarios
💔 MAIN SELL
Entry: 3996 | SL: 4004
TP: 3985 – 3972 – 3948
💢 SELL scalping
Entry: 4007 | SL: 4014
TP: 3998 – 3978
💖 REACTIVE BUY
Entry: 3965 | SL: 3957
TP: 3976 – 3988 – 3999
🌸 DEEP BUY
Entry: 3941 | SL: 3931
TP: 3955 – 3968 – 3988 – 4012 – 4066
🔍 4. Price Levels to Note
✨ 4007 → FVG resistance, short-term trend confirmation area
✨ 3996 → Retest area of the broken trendline
✨ 3965 – 3941 → Strong support area, likely to see reversal reactions
💬 5. Notes & Call for Interaction
⚠️ This is not an investment recommendation, but merely a personal technical perspective following the ICT method.
Observe the price reaction around the trendline carefully before making a decision 💭
If you find this post helpful, please 💛 like – 💬 leave a comment – 🔔 follow LanaM2
to stay updated with daily gold insights and learn more about the Smart Money Concept 🌷✨