GOLD CONFIRMS SHORT-TERM DECLINE AFTER BREAKING TRENDLINEXAUUSD – GOLD CONFIRMS SHORT-TERM DECLINE AFTER BREAKING TRENDLINE
🪞 1. Overview
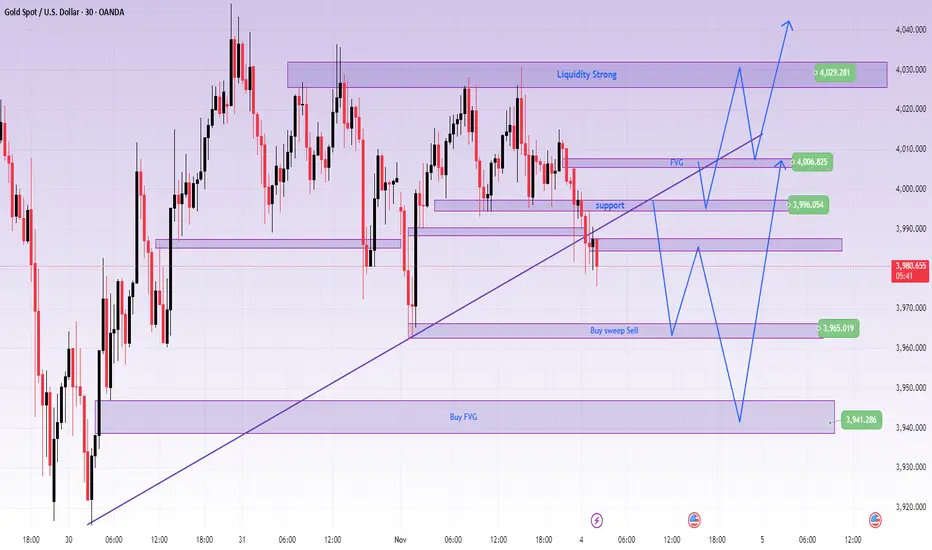
🌤️ In the Asian session this morning, gold broke the upward trendline even though the selling pressure wasn't particularly strong.
However, this is the first signal indicating that the short-term trend is leaning towards the sellers.
💬 Currently, the 3996 level is a significant resistance, and the price might retest this area before continuing to decline.
If the price surpasses the FVG at 4007, the trend might temporarily rebound in the short term.
💹 2. Technical Analysis (ICT Perspective)
🔸 Market structure: After breaking the trend, the structure temporarily shifts to short-term bearish.
🔸 Liquidity & FVG: Liquidity is drawn to the 3960–3940 area, while FVG 4007 is the first barrier.
🔸 Order Flow: Smart Money may lightly sweep up to the resistance area before pushing the price further down.
🎯 3. Reference Trading Scenarios
💔 MAIN SELL
Entry: 3996 | SL: 4004
TP: 3985 – 3972 – 3948
💢 SELL scalping
Entry: 4007 | SL: 4014
TP: 3998 – 3978
💖 REACTIVE BUY
Entry: 3965 | SL: 3957
TP: 3976 – 3988 – 3999
🌸 DEEP BUY
Entry: 3941 | SL: 3931
TP: 3955 – 3968 – 3988 – 4012 – 4066
🔍 4. Price Levels to Note
✨ 4007 → FVG resistance, short-term trend confirmation area
✨ 3996 → Retest area of the broken trendline
✨ 3965 – 3941 → Strong support area, likely to see reversal reactions
💬 5. Notes & Call for Interaction
⚠️ This is not an investment recommendation, but merely a personal technical perspective following the ICT method.
Observe the price reaction around the trendline carefully before making a decision 💭
If you find this post helpful, please 💛 like – 💬 leave a comment – 🔔 follow LanaM2
to stay updated with daily gold insights and learn more about the Smart Money Concept 🌷✨
M-forex
BTC/USDT (4h timeframe)...BTC/USDT (4h timeframe), I can summarize what’s visible and help interpret my targets:
Current price: Around $107,469
Chart setup: my using Ichimoku Cloud (Kumo) with marked zones:
Resistance level (green zone) around $107,000 – $108,000
Two target points drawn on the chart:
First target point: around $111,350 – $111,500
Second (higher) target point: around $116,500 – $117,000
✅ Summary of target levels visible on my chart:
1. Target 1: ~$111,350
2. Target 2: ~$116,700
These targets are likely based on a breakout above the Ichimoku Cloud and prior resistance zones.

Gold Squeeze: Range Breakout Can Trigger $4,100+ MoveLooking at the current gold price action on the H1 chart, we're seeing a technical setup that's been developing over the past several sessions. The market has clearly established a well-defined range between approximately $3,900 and $4,040, with price respecting both the upper and lower boundaries quite consistently.
price is holding above this ascending support while simultaneously testing the middle-to-upper zone of the range suggests building bullish momentum.
We've seen multiple attempts to push lower get absorbed by buyers, creating a series of higher lows that demonstrate underlying strength. The grey horizontal zone around $4,020-$4,040 represents the key resistance level where sellers have previously shown up, but notice how price action is becoming increasingly compressed near this level a classic sign that a breakout may be imminent.
From a probability standpoint, the combination of higher lows, sustained buying interest, and the current positioning near range highs favors an upside breakout. If gold manages to close convincingly above $4,040, we could see an accelerated move toward the $4,100+ zone fairly quickly, as there's limited technical resistance overhead once this range ceiling is breached.
However, it's worth noting that range-bound markets can be deceptive, and false breakouts are always a possibility. The key will be watching for a decisive move with strong volume and follow-through. Until we get that confirmation, remaining patient with existing positions while maintaining appropriate risk management makes sense.
The market appears coiled and ready to make its next significant move all signs point to higher prices, but as always, let the price action confirm the breakout before adding to positions.

XAU/USD (Gold Spot vs. U.S. Dollar) 1-hour chart XAU/USD (Gold Spot vs. U.S. Dollar) 1-hour chart on TradingView.
Here’s what I can observe:
There is a symmetrical triangle pattern (a type of consolidation pattern) drawn on the chart.
The price appears to be breaking out upwards from the triangle.
There’s an arrow drawn upward with a “target point” marked above current price levels.
To calculate the target from this breakout:
📈 Symmetrical Triangle Target Formula:
Target = Breakout Point ± (Height of the Triangle)
1. Measure the height of the triangle:
From the highest point of the pattern to the lowest point within the triangle.
Approximate values (from the chart):
High ≈ 4,080
Low ≈ 3,940
→ Height ≈ 140 points
2. Add the height to the breakout level:
Breakout ≈ 4,000
→ Target ≈ 4,000 + 140 = 4,140
🎯 Estimated Target: 4,140 USD
That matches closely with the dashed horizontal line labeled “target point” on my chart — right around 4,120–4,140.
So, my bullish target zone after breakout is approximately 4,120–4,140 USD per ounce.

AUD/CAD Approaching Support: Strong Bounce IncomingAUD/CAD has finished a strong 5-wave move to the upside, completing Wave (1)/(A). Since then, price has been moving in a corrective channel and is now forming an A-B-C decline toward the lower support zone. The current structure suggests one more push down to complete Wave C of (2)/(B), where buyers are likely to step back in. Once that final dip finishes, the chart expects a powerful Wave (3)/(C) rally to the upside, targeting new highs. In simple terms: small drop left → correction ends → strong bullish continuation ahead.
Stay tuned!
@Money_Dictators
Thank you :)

LiamTrading - $XAUUSD$: Second Scenario – BUY UP Priority ...LiamTrading - OANDA:XAUUSD $: Second Scenario – BUY UP Priority After BREAKING RESISTANCE $4002$
With the Support of the US Treasury Secretary
Hello traders community, LiamTrading is back with detailed OANDA:XAUUSD $ analysis for the start of the week!
The Gold market is receiving strong support from policy: US Treasury Secretary Scott Bessent calls on the Fed to continue cutting interest rates as the PCE inflation is currently at $2.7\%$.
This call, aimed at reducing mortgage rates and supporting the housing market, strengthens the long-term outlook for Gold.
Technical Analysis: We prioritize continuing to buy up following the main trend. The best strategy is to enter orders at strong resistance/support zones to ensure the lowest risk.
📰 MACRO FUNDAMENTALS: CALL FOR RATE CUT
Impact: The Treasury Secretary's statement on cutting interest rates to support the "transitioning" economy increases expectations of policy easing, which is a strong support factor for Gold (although not yet an official decision).
Suitable Strategy: Market sentiment is being driven by expectations of easing policy, reinforcing the priority for a BUY (Long) position.
📊 TECHNICAL ANALYSIS: IMPORTANT PIVOT POINT
Resistance Zone $4002$: This area acts as an important pivot point.
Buy Entry will be triggered after the price breaks resistance $4002$ and retests.
Sell Entry: Look for short-term scalping at the resistance zone $4030$ to secure profits. Highlighted Zone: Prioritize entering orders at confirmed Trendline zones.
🎯 DETAILED TRADING PLAN (ACTION PLAN)
We will wait for Gold to break structure and create a BUY setup.
🟢 Main BUY Scenario (BUY Break & Retest)
Logic: Buy at $4002$ after breaking resistance and retesting, leveraging new upward momentum.
Entry (BUY): $4002$
SL: $3995$ (tight SL)
TP1/TP2: $4020$ | $4035$
TP3: $4070$
🔴 SELL Scalping Scenario
Logic: Short-term scalping at the strong resistance zone $4030$ (near Sell Liquidity zone).
Entry (SELL): $4030$
SL: $4038$
TP1/TP2: $4015$ | $4004$
TP3: $3990$
📌 SUMMARY & DISCIPLINE (Liam's Note)
Our BUY strategy is reinforced by policy outlook and technical break at $4002$. Strictly adhere to SL $3995$ to manage risk before the upward structure is confirmed.
Are you ready for Gold's movement at $4002$? Please LIKE and COMMENT!

LiamTrading - $XAUUSD$: NEW WEEK TRADING SCENARIO...LiamTrading - OANDA:XAUUSD $: NEW WEEK TRADING SCENARIO – PRIORITISE SELLING After BREAKING THE TRENDLINE
Hello traders community,
The new week opens with a clear strategy: Prioritise SELLING after Gold has broken the previous upward trendline.
Although fundamental economic news (like interest rate policies and politics) supports Gold potentially reaching the $5,000$ USD mark, we must trade according to the current Price Action. The technical selling pressure is strong. We will SELL at key resistance zones and continue SELLING as the price breaks the downward structure.
📰 FUNDAMENTALS & LONG-TERM OUTLOOK
$5,000$ Prospect: Fundamental and political factors continue to support the scenario of Gold reaching $5,000$ USD in the long term (due to geopolitical risks and potential loss of Fed independence).
Short Term 🔴: Gold is under technical selling pressure after breaking through the $4,000$ USD mark.
📊 TECHNICAL ANALYSIS: TRENDLINE BREAK
Structure: Gold has exited the upward price channel and is retesting the broken trendline.
Priority: SELL at the retest resistance zone $4024$.
🎯 DETAILED TRADING PLAN (ACTION PLAN)
🔴 SELL Scenario (SELL Primary) - Preemptive Resistance
Entry 1: $4024$ (Sell retest trendline zone)
SL: $4032$
TP1/TP2: $4012$ | $4000$
TP3: $3989$
Entry 2 (Continuation SELL): When price breaks the next trendline at $3992$
SL: $4000$
TP: $3940$
🟢 BUY Scenario (BUY Reversal) - Buy at Strong Support
Logic: Only buy when price hits strong liquidity support, potential for a short-term rebound.
Entry (BUY): Around $3960$ (Buy Scalping Zone)
SL: $3954$
TP1/TP2: $3972$ | $3988 FWB:TP3 : $4000$
📌 SUMMARY & DISCIPLINE (Liam's Note) Don't let the $5,000$ USD prospect affect short-term risk management. Trade according to Price Action. Adhere to SL and prioritise SELL positions at resistance zones.
Are you ready for the SELL strategy at the start of this week?

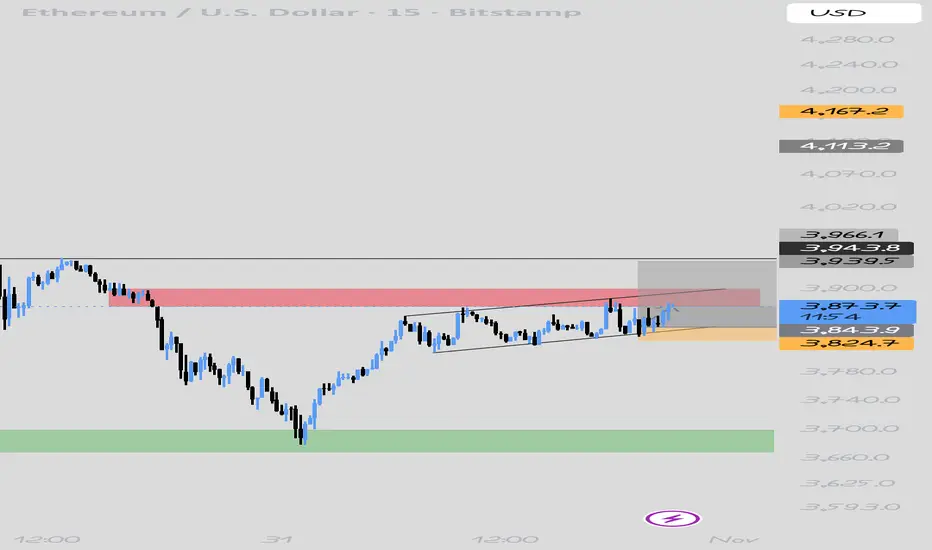
Ethereum on 15 min time frame Ethereum in 15 min TF under in choppy zone 3820 to 3880
If it's break above side at 3900
Then i look for previous resistance zone
At
1. 3950
2 3400
Stop lose
I place my Stop below this zone area at
3790. 3800
LiamTrading - XAUUSD: Outlook $5,000 USD and Priority BUY... LiamTrading - XAUUSD: Outlook $5,000 USD and Priority BUY Strategy at POC $3973
Hello traders community,
Gold is positioned between an extremely optimistic long-term outlook (forecast $5,000 USD in the next 12-18 months by Bank of America) and short-term technical adjustments.
Although Gold has broken the upward trendline, a sustainable downward trend has not been confirmed.
BUY positions are still prioritised!
🔥 LONG-TERM CONTEXT & INFLATION
Long-Term Push: Gold prices adjusted for inflation have DOUBLED in the past 4 years.
Highlight: Gold reinforces its role as an anti-inflation asset as real prices soar to all-time highs.
📊 DETAILED TRADING PLAN (ACTION PLAN)
Strategy: Buy at POC Zone to leverage liquidity advantage.
🟢 BUY Scenario (BUY Primary) - Buy at High Value Zone
Logic: The $3973 - 3975$ zone is right above the Buy POC (highest value zone).
Entry (BUY): $3973 - 3975$
SL: $3968$
TP1: $3988$ | TP2: $4000
Buy Up Target 2: Buy when price retests the trendline around $4002$.
🔴 SELL Scenario (SELL Scalping) - Preemptive strike at resistance zone
Entry (SELL): $4032 - 4034$
SL: $4040$
TP1: $4022$ | TP2: $4015
📌 SUMMARY & DISCIPLINE (Liam's Note)With the $5,000 USD forecast and inflation factors, the risk of SELL is increasing.
Focus on BUY at POC $3973$ and absolute SL.
Trade responsibly and with discipline!

Gold Continues to Struggle at 4000We're seeing a familiar story play out in gold as it makes multiple attempts to reclaim and hold above the 4000 level, but none of these efforts are showing the conviction we need to see from buyers. The price action on the hourly chart is particularly telling ,we're witnessing similar structural patterns repeating themselves, which often indicates indecision or a lack of strong directional commitment from either side. Once again, we've seen the rising support trendline get broken, which is not ideal for the bullish case in the short term.
However, there's a small silver lining worth noting. Today's CPR is showing an ascending structure, which typically carries some positive implications for intraday sentiment. It's not a game-changer by itself, but it does suggest that the technical setup isn't completely bearish. The key level to focus on for today's session is the CPR BC at 3971. This becomes our pivotal point ,if bulls can sustain trading above this level throughout the day, we could see another recovery attempt materialize toward the higher side. The ability to hold above 3971 would at least keep the door open for further upside exploration.
On the flip side, if we fail to maintain support at 3971 during the intraday session, it could trigger another leg down toward lower levels. Given the repetitive failed attempts at 4000 and the breakdown of support trendlines, the market is clearly at a crossroads here. We need to see some decisive action one way or the other to break out of this choppy, repetitive pattern.
As for my positioning, there's no change to my approach. I'm still holding my buy positions and actively managing the trades as this price action develops. The patience game continues, and while these repeated failures at 4000 are testing that patience, the broader picture still supports the long-term bullish thesis.

🇺🇸 IMPACT OF FED AFTER FOMC DECISION🇺🇸 IMPACT OF FED AFTER FOMC DECISION
Hello traders,
The latest Federal Reserve rate decision shook global markets — pushing Gold (XAUUSD) and Bitcoin lower while the US Dollar strengthened sharply.
The Fed cut interest rates for the second time this year, bringing them down to 3.75%–4%, but the announcement to end Quantitative Tightening (QT) by 1st Dec 2025 was the real game changer.
This is the moment to stay calm, read the market structure, and act according to your plan.
📰 MACRO ANALYSIS – THE FED’S DOUBLE IMPACT
Rate Cut (Normally Bullish for Gold):
The second rate cut should, in theory, support Gold prices. However, much of this was already priced in before the announcement.
QT Ending (USD Strength Booster):
Ending QT signals that the Fed is trying to rebalance its monetary stance. This boosted the US Dollar Index (DXY), putting heavy selling pressure on both Gold and BTC.
Market Reaction:
Gold saw a sharp drop right after the announcement, then moved sideways in a wide range. During today’s Asian session, Gold fluctuated nearly $70 before retracing slightly.
📊 TECHNICAL OUTLOOK – WIDE RANGE, BUILDING BULLISH STRUCTURE
Looking at the current XAUUSD market structure:
Structure: Gold is currently consolidating in a wide range. However, a bullish structure seems to be forming with higher lows — a sustainable Dow-style uptrend pattern.
Trading Plan: Stay flexible and trade both sides —
🔴 Sell (Short) near liquidity resistance zones.
🟢 Buy (Long) from deep liquidity supports.
🎯 TRADING ACTION PLAN
🔴 SELL CONTINUATION – Short from Resistance
Entry Zone: 4005
Stop Loss: 4013
Targets:
TP1: 3990
TP2: 3975
TP3: 3960
TP4: 3943
🟢 BUY RECOVERY – Long from Support
Entry Zone: 3907–3909
Stop Loss: 3902
Targets:
TP1: 3933
TP2: 3954
TP3: 3970
TP4: 3999
⚖️ FINAL THOUGHTS
The Fed’s decision has reshaped the short-term outlook.
A $70 volatility range shows Gold’s high liquidity — but also high risk.
📌 LiamTrading’s Note:
A strong bullish structure is building up on the lower timeframes. Patience is key — wait for the ideal Buy zone near 3907 to catch the next recovery leg.
Always maintain strict risk and capital management, especially during post-FOMC volatility.
Are you ready to ride this 70-dollar range?
👉 Tap LIKE 👍 and COMMENT your setup!

AUD/USD (3H)...AUD/USD (3H) chart, here’s a breakdown of what I see and how the target can be projected:
---
🧠 Pattern Analysis
My identified a Cup and Handle pattern, which is a bullish continuation setup.
Cup low: around 0.6450
Cup rim (resistance / breakout level): around 0.6580 – 0.6590
Current price: ~0.6585 (right around the breakout level)
Handle: short pullback, touching near Ichimoku cloud support — healthy structure before potential breakout.
---
🎯 Target Projection (Cup & Handle Rule)
Cup and Handle target = Breakout level + Depth of the cup
Depth of cup:
0.6585 (rim) – 0.6450 (bottom) = 0.0135
Target = 0.6585 + 0.0135 = 0.6720
---
✅ Target Summary
Entry (breakout confirmation): above 0.6590
Target: 0.6720
Stop-loss: below 0.6535 – 0.6540 (below handle & cloud support)
Risk/Reward ratio: ~1:2.5
---
💡 Bonus Confirmation
Price is above the Ichimoku Cloud (bullish bias).
Handle retracement is shallow and respecting Tenkan/Kijun lines — typical of strong continuation setups.
Volume on breakout (watch for increase) would add confirmation.
---
Final Target: 0.6720 (main take-profit zone)

EURUSD 1H - LONGFX:EURUSD
Hello traders , here is the full multi time frame analysis for this pair, let me know in the comment section below if you have any questions, the entry will be taken only if all rules of the strategies will be satisfied. wait for more Smart Money to develop before taking any position . I suggest you keep this pair on your watchlist and see if the rules of your strategy are satisfied...
Keep trading
Hustle hard
Markets can be Unpredictable, research before trading.
Disclaimer: This trade idea is based on Smart money concept and is for informational purposes only. Trading involves risks; seek professional advice before making any financial decisions. Informational only!!!

GBP/JPY 2-hour chart...GBP/JPY 2-hour chart, here’s what I can interpret based on my markings:
Range zone (pink box): approximately 203.8 – 204.4
Resistance zone (green box): around 201.0 – 201.5
Current price: ~202.18
Ichimoku cloud: price is just breaking back toward the cloud (potential short-term bullish momentum)
Marked target point: around 204.3 – 204.4
🎯 Target Analysis
If price continues its upward momentum from the bounce near 201.3 (support zone) and breaks above the cloud:
First target: 203.20 (top of the cloud / minor resistance)
Second target (main): 204.30 – 204.40 (the top of my marked range)
📉 Invalidation / Stop-loss idea
If price falls back below 201.70 – 201.50, that would invalidate the bullish setup and could signal another test of the green support zone.
Summary
Buy zone: Above 202.20–202.30 (confirmation above Tenkan/Kijun lines)
Target 1: 203.20
Target 2: 204.30–204.40
Stop-loss: 201.50

USD/CAD (3H timeframe) chart...USD/CAD (3H timeframe) chart 👇
🧭 Chart Overview:
Current price: ≈ 1.3979
Trend: Bearish breakdown from support and trendline.
Price has cleanly broken below both the ascending trendline and Ichimoku cloud, confirming a downside continuation.
---
🔍 Key Technical Details:
The previous support zone (1.4010–1.4040) has turned into resistance.
Momentum is bearish after retesting that area and rejecting it.
Two target points are clearly marked on my chart.
---
🎯 Target Levels:
If bearish momentum continues 👇
Target 1: 🟢 1.3900 — first major support / first target
Target 2: 🟢 1.3730–1.3750 — second major target zone (full extension of breakdown)
---
⚙ Trade Setup Suggestion:
Entry (Sell): Below 1.3980 (confirmation of continuation)
Stop Loss: Above 1.4045 (above broken support)
Take Profit 1: 1.3900
Take Profit 2: 1.3730
---
⚠ Summary:
📉 Structure = Bearish
🎯 Targets = 1.3900 → 1.3730
🔄 Resistance = 1.4010–1.4040 (sell zone if retested)

chart for GBP/JPY...chart for GBP/JPY. Based on what I’m seeing + recent technicals, here’s a target-zone scenario for my. Remember: this is a probabilistic view, not a guarantee — set my risk accordingly and use a stop.
---
🔍 Current technical context
GBP/JPY is hovering around ~ 203.0-203.5 (per recent data).
There is resistance near ~ 205.30 according to one analysis.
On the downside, support is referenced around ~ 200.67 or ~ 197.47 in one view.
The pair’s trend signals show a generally bullish macro trend, though short-term momentum might be weakening.
---
🎯 Target zones
Given my chart shows a break of a trendline (uptrend) and a move lower, here are two plausible targets depending on how the move unfolds:
If a bearish move continues (i.e., break of support around ~ 200.6) → A target around 197.50-198.00 is reasonable.
If the price instead holds support and bounces/reverses → A target near or above the resistance around 205.30-207.00 becomes possible.
---
✅ My preferred “play” based on my setup
Since my chart shows a breakdown of an ascending trendline, I lean toward the bearish target path:
Entry: At current ~ 203.0 area (assuming my chart confirms the break).
Stop-loss: Just above the recent high / trend‐line (say ~ 205.50) to manage risk.
Target: ~ 197.50-198.00 (gives about 5-6 points of drop from current).
Risk-reward: Check how many pips my risking vs this target — ensure the reward is larger than the risk.
---
⚠ Things to watch
If price breaks back above ~ 205.30 with good momentum, the bearish scenario is invalidated and my need to pivot.
Macroeconomic/fundamental events (e.g., UK or Japan monetary policy) can blow this setup either way — be aware.
The move to 197.50 might not be smooth — there may be bounces, retests of broken trendline, etc.
---
If you like, I can plot multiple target-levels (e.g., near‐term, mid-term, and stretch) on my exact chart timeframe (1-hour) and we can mark stop and risk-zones.

Gold Struggles at 4000: Managing Longs in Corrective PhaseYesterday's session brought some disappointment for the bulls as gold tested the psychological 4000 level but failed to sustain above it on the larger timeframes. After reaching a high around 4028, we saw sellers step in with conviction, leading to a breakdown of the ascending trendline that had been supporting the recent recovery attempt. The rejection at these levels was swift, and now we're trading back at lower levels, which puts the immediate bullish case on hold for the time being.
For today's trading session, the CPR range positioned between 3943-3968 represents the intraday battleground. This zone is now acting as resistance, and bulls will need to prove themselves here if they want to regain any meaningful momentum. To shift the current selling sequence and get back into control, price needs to reclaim the broken trendline support and more importantly, break above yesterday's high at 4028. Until that happens, the path remains to the downside, and we need to respect what the market is telling us for current short term structure.
On the support side, the 3880-3900 zone that we have to watch and losing control here could open the door for more corrections toward lower levels and can make attempt towards 3850 (50% Fib Level).
From a fundamental perspective, we're also dealing with some interesting cross-currents. The China-US trade deal developments are currently providing some headwinds for gold, giving short-term sellers additional reasons to press their advantage. However, zooming out to the bigger picture, yesterday's Federal Reserve decision to cut rates by another 25 basis points and signal the end of Quantitative Tightening is structurally bullish for gold over the medium to long term. This transition to monetary easing typically creates a favorable environment for precious metals.
As for my positioning, I'm continuing to manage my existing long positions. My broader view remains to buy the dip because the longer-term structure still favors the bulls. These short-term corrections, while uncomfortable, are part of the journey in trending markets. The key is staying patient and not getting shaken out by near-term volatility when the fundamental and structural backdrop remains supportive.

GBP/USD Correction Almost Done: Bulls LoadingGBP/USD has already completed a big corrective structure from the previous high and is now moving inside a complex W-X-Y pattern. The current drop is forming the final C-wave of Wave Y, which suggests the bearish move is close to finishing. Price is likely to dip slightly lower near the support zone before finding buyers again. Once this final leg completes, the chart expects a strong bullish reversal to the upside. In simple terms, one more small drop to finish the correction, then GBP/USD should bounce and start a new uptrend.
Stay tuned!
@Money_Dictators
Thank you :)

🇮🇳 LiamTrading – XAUUSD: Dual Strategy Ahead of FOMC🇮🇳 LiamTrading – XAUUSD: Dual Strategy Ahead of FOMC | Focus on Buying the Retracement near $3914
Hello Traders,
After a strong sell-off, Gold (XAUUSD) is showing early signs of recovery, building a minor upward structure.
We continue to focus on buying the pullback, viewing this move as a short-term correction within the broader downtrend.
Expect higher volatility as the FOMC decision approaches.
📰 MACRO CONTEXT & FUNDAMENTALS
The market is holding steady ahead of the FED announcement:
🟢 Technical Recovery:
Gold reversed part of its decline during the Asian session, bouncing slightly from a 3-week low as traders await the FOMC rate decision.
🔴 Headwinds:
However, optimism around US-China trade talks and a stronger USD continue to limit the upside momentum.
📊 TECHNICAL VIEW & TRADING PLAN
We are focusing on high-probability liquidity zones for both long and short opportunities:
🟢 Primary BUY Setup (Retracement Buy)
Looking for a retest of the key buy-side liquidity zone to trigger the next recovery wave.
Entry Zone (Buy): $3914
Stop Loss: $3906 (Tight SL recommended)
Take Profit: TP1 $3933 | TP2 $3956
🔴 SELL Setup (Retest / Short-Term Scalping)
Using the broken trend area for short opportunities.
Entry Zone (Sell): $4048
Stop Loss: $4056
Take Profit: TP1 $4035 | TP2 $4022
🧭 SUMMARY & TRADER’S NOTE
Gold is now in a decision zone — volatility will spike around FOMC.
Trade with discipline:
✅ Enter only at confirmed liquidity zones.
✅ Always respect your Stop Loss.
✅ Manage your capital carefully before the news release.
Wishing everyone a profitable and disciplined session!

Gold Breaks Trendline: 4000 Back in FocusYesterday's trading session brought further downside pressure as gold pushed lower to test the 3880 zone, which is just above the monthly open. We have seen a decent recovery bounce from there, suggesting some buying interest is emerging at these lower levels. However, it's important to maintain perspective here while we're seeing short-term stabilization, the reversal signs on higher timeframes haven't materialized yet. We need to see more convincing price action and stronger closes on the larger timeframes before we can confidently call this as reversal to bullish case.
Also today we have extremely narrow CPR positioned at 3954. When we see such tight CPR levels, it often signals either an impending trend reversal or the potential for a high volatility session ahead. The early Asian session has already given us something to work with price is attempting to reclaim this CPR zone, which is a constructive development. Adding to the bullish case, we've also seen a breakout from the descending trendline structure that had been capping rallies over the past few sessions.
From a tactical perspective, the immediate support zone to monitor is 3900-3910.... If buyers can defend and sustain price action above this level, we could see gold make an attempt toward the first meaningful hurdle at 4000-4010. This target zone is particularly significant as it aligns with today's R1 pivot and the prior week's low, creating a confluence resistance area. A daily close above 4000-4010 would be an encouraging sign that momentum is genuinely shifting back in favor of the bulls and could open the door for further upside.
As for my positioning, I'm maintaining my existing buy positions and continuing to manage them as the price action develops. The risk-reward from these levels still appears favorable given the technical setup unfolding.

XAU/USD Completing Wave Y: Final Dip Before RallyGold has completed its major 5-wave rise and is now finishing a corrective W-X-Y pattern. The recent drop looks like the final leg of this correction, meaning sellers are getting weaker. Price may show a small bounce up and then one last dip to complete the correction. After that final drop, a strong new uptrend is expected to start again. In short: correction ending soon, last dip big bullish move ahead.

Euro Under Pressure from Strong USDThe euro continues to show weakness against the dollar as global risk sentiment cools and investors shift toward safer assets. Market participants remain cautious ahead of key inflation data from the Eurozone and upcoming comments from Federal Reserve officials, which could clarify the next phase of U.S. monetary policy.
The recent euro recovery attempts have met consistent supply, reflecting pressure from subdued European growth and stronger U.S. economic resilience. The dollar remains supported by robust labor market conditions and persistent inflation expectations, which sustain demand for U.S. yields and Treasury assets.
Liquidity patterns suggest that institutions are still offloading positions near recent highs, keeping EUR/USD confined within a broader corrective cycle. Energy price fluctuations and diverging rate expectations between the ECB and the Fed continue to weigh on sentiment.
Overall, the pair remains under macroeconomic strain, with capital flows favoring the dollar as global markets seek stability am

LiamTrading - XAUUSD: SCENARIO AHEAD OF FOMCLiamTrading - XAUUSD: SCENARIO AHEAD OF FOMC - The $3840 Mark Awaits a Bottom Catch Reaction Wave
Hello trading community,
The Gold market is exhibiting a strong and sustainable downtrend. We are witnessing a crash after the price broke through key support zones. With the upcoming FOMC event, our strategy is to seek Buy opportunities at deep liquidity zones and continue to Sell when the price recovers to retest the broken trend.
📰 MACRO ANALYSIS & CASH FLOW CONTEXT
Gold is currently under dual pressure:
Bearish Pressure 🔴: Optimism about the US-China trade progress has significantly weakened the demand for Gold, traditionally a safe-haven commodity. Spot Gold prices have fallen below $3950, hitting a three-week low, down about 0.78% on the day (28/10).
Short-term Support 🟢: Bets on the possibility of Fed rate cuts continue to weaken the US Dollar (USD), which is the only factor that could potentially support this precious metal.
Conclusion: This tug-of-war makes bottom identification challenging. The bearish scenario remains the top priority.
📊 TECHNICAL ANALYSIS: THE DOWNWARD WAVE CONTINUES
Based on the H4 chart (image_5fa7fa.png):
Current Trend: The price has successfully broken the key liquidity support zone near $3950 and is continuing its downward momentum.
Current Fibonacci Level: The price is touching and reacting at the 1.618 Fibonacci level (around $3950).
Next Target: The next target for Gold will be the 2.618 Fibonacci area (around $3840), which is a large liquidity zone expected to see strong reactions.
Main Strategy: We focus on two scenarios: Catching the bottom reaction at 3840 and continuing to Sell when the price rebounds.
🎯 DETAILED TRADING PLAN (ACTION PLAN)
We have two detailed scenarios based on the current price level:
🟢 BUY Reversal Scenario
We wait for the price to hit the deep liquidity bottom at 3840 to execute a buy order with the expectation of a technical recovery.
Entry Zone: 3840
Stop Loss (SL): 3832 (tight SL)
Take Profit Targets (TP): TP1: $3872 | TP2: $3898 | TP3: $3925 | TP4: $3950
🔴 SELL Retest Scenario
If Gold recovers without breaking the downtrend structure:
Entry Zone: Watch for a Sell retest at $4091
Stop Loss (SL): $4099
Take Profit Targets (TP): TP1: $4065 | TP2: $4033 | TP3: $4004 | TP4: $3965
SUMMARY & DISCIPLINE (Steven's Note)
Gold is in a strong decline ahead of the FOMC, with significant volatility expected. Capturing deep Fibonacci and Liquidity zones is key.
Note: Always adhere to the set Stop Loss. Capital management is the top priority, risking only 1-2% of the account per trade.
Wishing traders a successful and disciplined new trading week!
