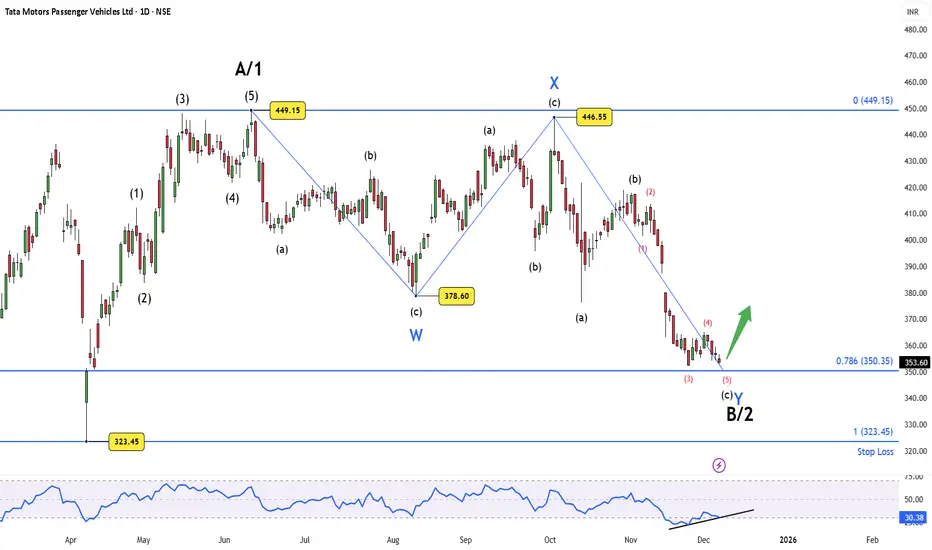
Tata Motors PV – Wave B/2 Near Completion, Bounce Zone ActivatedThe ongoing decline appears to be unfolding as a complex corrective structure, with Wave C of the larger Wave B/2 now approaching its typical termination area. Price has reached the 0.786 Fibonacci support at ₹350.35 — a level where deeper corrective phases frequently exhaust themselves.
Structurally, the final leg of Wave C shows a clear five-wave micro pattern, and downside momentum has begun to fade. The RSI is printing early bullish divergence, suggesting that sellers are losing strength even as price tests fresh lows. This combination often precedes a relief bounce within the broader framework.
As long as the price respects ₹323.45, this corrective interpretation remains valid and a bounce from the current zone is the preferred expectation. A decisive close below the invalidation level would signal that the correction is not yet complete and that a deeper retracement is unfolding.
Disclaimer: This analysis is for educational purposes only and does not constitute investment advice. Please do your own research (DYOR) before making any trading decisions.
M-oscillator
Micron’s AI Pop: Why Patience Matters HereMicron’s earnings-driven rally has put the stock back in the spotlight, with AI demand and guidance upgrades driving a sharp upside reaction. Fundamentally, the story is strong — but price has already reacted aggressively .
On the daily chart, price is making higher highs while RSI is failing to confirm, printing a clear bearish divergence . This typically signals momentum exhaustion , not the start of a fresh impulsive leg. If this were a new expansion phase, momentum should be accelerating — it isn’t.
Earnings gaps driven by narrative shifts often need time to digest . Instead of straight-line continuation, price usually moves into consolidation or a pullback to test whether buyers can defend higher levels.
Chasing price after a vertical move offers poor risk–reward . Patience allows the market to reveal structure, define risk, and present cleaner entries .
The AI story may be real — but timing still matters .
Don’t buy the excitement. Wait for confirmation.
Disclaimer: This analysis is for educational purposes only and does not constitute investment advice. Please do your own research (DYOR) before making any trading decisions.

Bullish Divergence in TATA MotorsPrice making lower low but RSI making higher low in TMPV. Can be turnaround candidate as auto sector positioning to break out.

S&P 500: Positioned for a Santa Rally?While tracking the global markets — especially the US indices — one thing stood out clearly.
The rally from 6521.92 to 6895.78 unfolded as a clean impulsive move , not a corrective grind. That structural behavior is what made me treat this leg as an impulsive rally (Wave 1/A) rather than just another bounce.
Since then, price action has cooled into a Wave 2/B reset , pulling back towards key Fibonacci retracement pocket . Structurally, this looks more like a pause before continuation than the start of a larger breakdown.
From a broader sentiment perspective, the backdrop remains supportive. The Fed’s recent rate cut continues to favor risk assets, NVIDIA’s staggering earnings have reinforced confidence in the AI-led growth narrative, and the CBOE Volatility Index remaining subdued suggests markets are not in a fear-driven regime.
So… will Santa deliver a rally — or even deliver early?
At the moment, the market appears to be positioning itself towards key Fibonacci retracement levels , creating a favorable setup for a potential Santa rally . If the structure holds, Wave 3/C could be the move where Santa shows up with the goods.
And if the US index does start unwrapping a rally, history suggests Indian markets rarely stay on the sidelines — definitely something to keep on the radar.
Disclaimer: This analysis is for educational purposes only and does not constitute investment advice. Please do your own research (DYOR) before making any trading decisions.

XAUUSD | 15M | SMC PerspectivePrice has delivered a strong bearish displacement, confirming short-term market structure shift to the downside. The recent impulse left behind a clean bearish order block / supply zone, which is now acting as premium territory.
Current price is reacting from discount and may attempt a pullback into the marked supply zone for mitigation. That zone is the key decision area.
Plan:
Expect a retracement into supply
Look for LTF confirmation only inside the zone
Rejection from supply should open the path toward the liquidity pool near 4257, which aligns with prior lows and equal lows resting liquidity
Bias: Bearish
Execution rule: Entry will be taken only if LTF aligns with HTF bearish expectation


Reliance Ind (W): Strongly Bullish - Post-Breakout ConsolidationTimeframe: Weekly | Scale: Logarithmic
The stock has staged a "V-shaped" recovery from the April 2025 lows and has successfully reclaimed key resistance levels. It is currently consolidating above the breakout zone, which is a sign of strength (time correction instead of price correction).
📈 1. The Structural Context (Bonus Adjusted)
> The Cycle:
- ATH (July 2024): ₹1,608.80 (Adjusted for 1:1 Bonus).
- The Trap (April 2025): The fall to ₹1,114 breached the long-term support (₹1,185), likely trapping bears, before reversing sharply.
> The Breakout: The stock recently cleared the ₹1,518 – ₹1,540 resistance zone.
> Current Action: For the past few weeks, it has been moving sideways above this zone. This "hovering" behavior indicates that buyers are defending the breakout level, turning previous resistance into support.
🚀 2. The Fundamental Context (The "Why")
The recovery is supported by strong fundamentals:
- 1:1 Bonus Issue: The recent bonus issue (Oct 2024) has improved liquidity and sentiment, keeping the stock buoyant.
- Earnings Growth: Recent quarters have shown robust growth in the Retail and Jio segments, which is fueling the recovery toward the ATH.
📊 3. Volume & Indicators
> Volume: Volume has been reducing during this recent sideways phase.
- Interpretation: This is a bullish sign . Low volume during a pullback/consolidation means there is no heavy selling pressure (supply is drying up). The market is waiting for the next "ignition" spark.
> EMAs: The PCO (Positive Crossover) state across Monthly, Weekly, and Daily timeframes confirms a synchronized uptrend.
> RSI: Rising in all timeframes, supporting the momentum.
🎯 4. Future Scenarios & Key Levels
The stock is primed for a continuation move.
> 🐂 Bullish Targets:
- Trigger: A decisive break above the recent consolidation high (approx ₹1,580 ).
- Target 1: ₹1,608 (The ATH). This is the immediate magnet.
- Target 2: ₹1,725 . If the stock enters "blue sky" discovery, this 7-10% extension is highly achievable.
> 🛡️ Support (The Safety Net):
- Immediate Support: ₹1,518 – ₹1,540 . The breakout zone must hold.
- Stop Loss: The level of ₹1,495 is a perfect structural stop. A close below this would mean the stock has fallen back into the old range (a "failed breakout").
Conclusion
This is a Grade A Setup . The "sideways movement above resistance" with low volume is exactly what you want to see before a major leg up. The trend is your friend here. Watch for a high-volume move above ₹1,580 .

Indus Towers (W): Strongly Bullish - Turnaround BreakoutTimeframe: Weekly | Scale: Linear
The stock is on the verge of a major structural breakout from a decade-long corrective phase. This move is supported by a massive volume expansion and a "trifecta" of positive fundamental news.
🚀 1. The Fundamental Catalyst (The "Why")
The massive volume surge (32M+) is a direct reaction to major positive developments:
1. VIL Dues Recovery: Vodafone Idea has started clearing past dues, significantly improving Indus Towers' cash flow visibility.
2. Credit Rating Upgrade: ICRA recently upgraded the company's long-term rating to AAA (Stable) , the highest level of safety, signaling financial robustness.
3. Promoter Confidence: Bharti Airtel has increased its stake to >51%, solidifying its commitment.
📈 2. The Long-Term Structure (The Breakout)
- The "Lid" (Angular Resistance): The stock has been suppressed by a downward angular resistance since its historic highs (2015-2017). Breaking this trendline signals a multi-year trend reversal.
- The Consolidation: Since April 2024, the stock has formed a "base" with Equal Lows (~₹315) and Lower Highs, effectively coiling for a move.
- The "Ignition": This week’s 3.65% surge with 32.5 Million volume is the "ignition" signal. It shows that buyers are finally aggressive enough to challenge the long-term supply zone.
📊 3. Technical Indicators
Indicator analysis confirms the momentum shift:
- EMA: The short-term EMAs are in a Positive Crossover state across Monthly, Weekly, and Daily timeframes, confirming a synchronized bullish trend.
- RSI: Rising across all timeframes, indicating that momentum is expanding into the breakout.
🎯 4. Future Scenarios & Key Levels
The stock is right at the "make or break" point.
- 🐂 Bullish Breakout (Confirmation):
- Trigger: A decisive Weekly Close above ₹430 (the recent 52-week high).
- Target: ₹473 – ₹480 . This aligns with the 2017 All-Time High zone.
- 🛡️ Support (The "Must Hold"):
- Immediate Support: ₹394 . If the breakout fails, the stock must hold this level to keep the short-term uptrend alive.
- Stop Loss: A close below ₹380 would invalidate the current momentum.
Conclusion
This is a High-Conviction Setup . The combination of a multi-year technical breakout and strong fundamental turnaround (cash flow + ratings) makes this a prime candidate for a re-rating. Watch for a close above ₹430 .

Dixon Technologies: Watching a Key Reversal Zone AheadDisclaimer:
This analysis is for educational purposes only and does not constitute investment advice. Please do your own research (DYOR) before making any trading decisions.
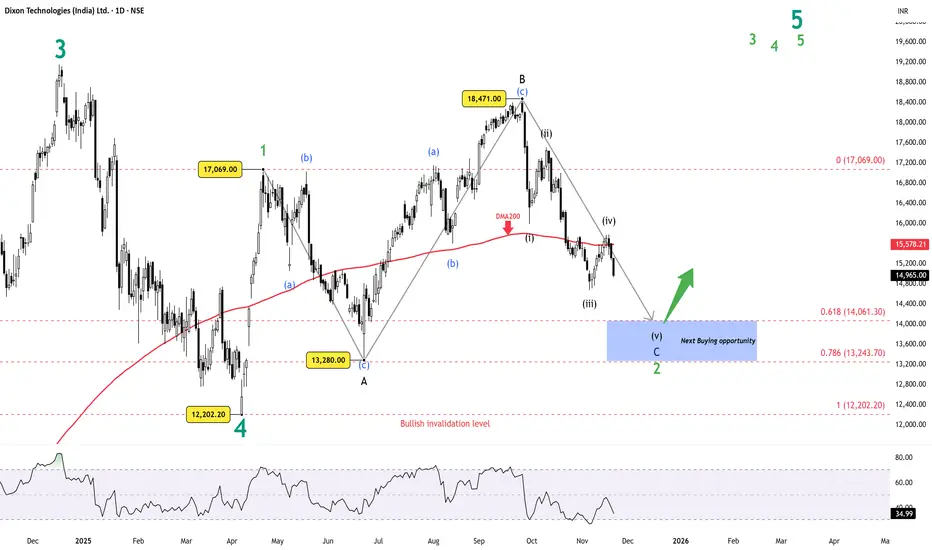
Dixon’s decline is developing as a running flat within Wave 2. Wave A and B are already in place, with Wave B stretching above the Wave A origin, which is typical behaviour when the larger trend is still strong. The final leg, Wave C, is still unfolding.
Inside Wave C, waves (i) through (iv) look complete, and the market appears to be working on wave (v). Momentum has been weakening throughout the drop, which often leads to an ending diagonal in the final wave of a running flat. The structure so far supports that possibility.
The 0.618 retracement near 14,061 is the critical zone for this setup. This level aligns with typical Wave 2 depth and sits right where wave (v) of C can complete. RSI has not yet shown bullish divergence, so a marginal lower low in price, paired with a higher low in RSI, would be the ideal confirmation signal.
If price forms the expected small ending diagonal into the 0.618 level and momentum improves, this would complete the running flat and set the stage for the next bullish sequence.
Summary
Wave 2 forming as a running flat.
Wave C still in progress; wave (v) pending.
Weak momentum favours an ending diagonal finish.
Key reversal zone: 0.618 retracement near 14,061.
Watching for bullish RSI divergence before confirmation.
Apollo Tyres (D): Bullish, Momentum Building at ResistanceTimeframe: Daily | Scale: Linear
The stock is staging a strong recovery from the lower end of its consolidation range. It is now challenging the critical supply zone, backed by rising volume and positive fundamental developments (pledge release).
🚀 1. The Fundamental Catalyst (The "Why")
The renewed buying interest is driven by two key factors:
- Pledge Release: On Nov 17, 2025 , Catalyst Trusteeship released a massive pledge on 63 Million shares (approx. 9.9% stake). The removal of this overhang is a major confidence booster for investors.
- Softening Input Costs: Recent reports suggest a bearish outlook for Crude Oil (a key raw material for synthetic rubber), which directly improves margin outlooks for tyre companies.
📈 2. The Technical Structure (The "Box")
> The Range: The stock has been trapped in a wide "Box" pattern:
- Floor (Support): ₹364 – ₹370 . This level has held firm since May 2023, acting as a strong accumulation zone.
- Ceiling (Resistance): ₹545 – ₹550 . This zone (active since Jan 2024) has rejected multiple rally attempts, including the failed breakout to the ATH of ₹585 in Sep 2024.
> Current Action: The stock is currently consolidating just below this resistance.
- The Surge: Today's move (closing ~3% up) with 1.52 Million volume indicates that bulls are gathering strength to attack the resistance again.
📊 3. Technical Indicators
Indicator analysis shows a synchronized bullish trend:
- EMAs: The PCO (Positive Crossover) state across Monthly, Weekly, and Daily timeframes confirms that the trend is aligning upwards across all horizons.
- RSI: Rising across all timeframes, showing that momentum is expanding into the breakout attempt.
🎯 4. Future Scenarios & Key Levels
The stock is at a decision point. We need a confirmed breakout to avoid another rejection.
- 🐂 Bullish Breakout (The Trigger):
- Condition: A decisive Daily Close above ₹550 .
- Target 1: ₹585 (The ATH). This is the immediate magnet.
- Target 2: ₹630 . If the stock enters "blue sky" discovery, this is the technical extension target.
- 🐻 Bearish Rejection (The Range Play):
- Condition: If the stock faces heavy selling at ₹545-550 again.
- Support: The stock would likely drift back to the mid-range support at ₹512 or the 20-day EMA.
Conclusion
The setup is promising. The Pledge Release removes a major structural risk, and the technicals are aligned. However, do not anticipate the breakout. Wait for a close above ₹550 to confirm that the "ceiling" has finally been shattered.

Bank of Baroda: Impulsive Breakout or Running Flat Trap?The recent All-Time High at 303.95 looks like a breakout to the naked eye, but the internal structure suggests a classic Elliott Wave Trap .
The Technical Disconnect : While the move above the previous peak (299.70) was strong, it lacks the characteristics of a genuine Wave 3 impulse:
Structure : The rally from 190.70 subdivides into a clear 3-wave (a)-(b)-(c) corrective pattern, not a 5-wave motive sequence.
Precision Resistance: The price reversed exactly at the 100% Fibonacci extension, a common termination point for corrective B-waves, not impulsive breakouts.
Momentum : RSI hitting 72.42 at resistance signals exhaustion rather than sustained trend strength.
The Setup: Running Flat Correction This price action confirms a Running Flat scenario. The "breakout" was likely a Wave B bull trap designed to clear stops before the final leg down.
Outlook : We are entering Wave C (down).
Target Zone : 234 – 247. This green box aligns with the 50-61.8% retracement cluster of the recent rally.
Invalidation : A weekly close above 304 . If bulls sustain price above this level, the corrective view is invalid, and a true breakout is in play.
Disclaimer: Educational view only. DYOR.

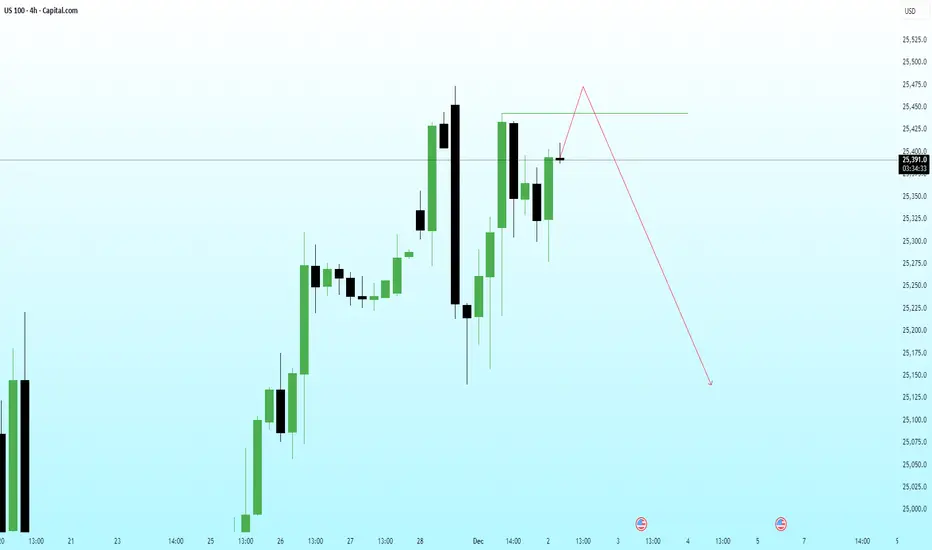
NAS100 – Anticipating a Liquidity Grab Before a Deeper CorrectioPrice is currently hovering just below the short-term resistance, displaying signs of exhaustion. I’m expecting one final push to sweep the liquidity sitting above the recent high (marked zone).
Once that engineered high is taken, a sharp reversal remains the highest-probability path—supported by higher-timeframe inefficiencies and unmitigated sell-side imbalance below.
Bearish Path:
• Sweep the recent high
• Fail to sustain above resistance
• Break structure
• Momentum-driven selloff toward the 25,150–25,180 zone
⚠️ ENTRY CONDITION (VERY IMPORTANT):
I will execute the trade only if the LTF shows the exact same sequence and confirmation that I’m expecting from the HTF. This is non-negotiable.
This scenario remains valid as long as price doesn’t gain acceptance above the marked resistance level.
IIFL Finance (W): Strongly Bullish - Turnaround BreakoutTimeframe: Weekly | Scale: Logarithmic
The stock has confirmed a decisive breakout from a multi-year consolidation phase. This move marks the end of the post-embargo correction and is supported by strong fundamental catalysts and technical alignment.
🚀 1. The Fundamental Catalyst (The "Why")
The breakout is driven by a powerful business turnaround:
- Gold Loan Normalization: The biggest overhang on the stock was the RBI embargo on gold loans. With this fully lifted, the business has normalized, as seen in the recent Q2 FY26 Earnings where Net Profit surged 148% (YoY).
- NCD Issuance: The recent board approval to raise ₹2,000 Crore via NCDs signals confidence in growth and liquidity, acting as an immediate trigger for the stock price.
- Fitch Upgrade: Fitch Ratings recently revised the outlook to "Positive," adding institutional confidence.
📈 2. The Long-Term Structure (The "Box" Breakout)
> The Cycle:
- Peak: ATH of ₹683 in Oct 2023.
- Correction: A steep fall to the ₹294–₹304 support zone (March 2024 lows), effectively forming a "double bottom" base.
> The Breakout: The ₹535 – ₹540 zone has acted as a stiff resistance since early 2024.
- The Move: This week, the stock decisively broke and closed above this resistance (closing near ₹578).
- The Re-test: The stock consolidated just below this level before launching higher, which is a sign of strength.
📊 3. Volume & Indicators
- Volume Clarification: Volume has been "decreasing", this is actually a good sign during the consolidation (sideways) phase, as it shows selling pressure was drying up. However, for a valid breakout, we want to see volume expand . Recent daily data shows volume spikes (e.g., 3M+ shares), confirming buyers are returning.
- EMAs: The PCO (Positive Crossover) state across Monthly, Weekly, and Daily timeframes confirms that the trend has synchronized to the upside.
- RSI: Rising across all timeframes, indicating expanding momentum.
🎯 4. Future Scenarios & Key Levels
With the "lid" at ₹540 removed, the stock has room to run toward previous highs.
> 🐂 Bullish Targets:
- Target 1: ₹683 (The ATH). This is the immediate structural target.
- Target 2: ₹950 . If the momentum sustains and the stock enters "blue sky" discovery, Fibonacci extensions project a move toward ₹950 in the long term.
> 🛡️ Support (The "Must Hold"):
- Immediate Support: ₹535 – ₹540. The breakout zone has now flipped to support. Any pullback to this level is a high-probability buying opportunity.
- Stop Loss: A close below ₹465 would invalidate the bullish thesis, as it would mean the stock has fallen back deep into the old range.
Conclusion
This is a Grade A Turnaround Setup . The lifting of regulatory clouds (Gold Loan ban) combined with a technical breakout above ₹540 makes this a high-conviction trade. Watch for stability above ₹535 .

Welspun Living (W): Strongly Bullish, Policy-Driven BreakoutTimeframe: Weekly | Scale: Logarithmic
The stock has confirmed a major structural breakout from a 9-month consolidation. This move is backed by the highest volume in months and a significant government policy shift favoring the textile sector.
🚀 1. The Fundamental Catalyst (The "Why")
The massive volume surge (88M+) is a direct reaction to a convergence of positive news:
- New Labour Codes (Nov 21, 2025): The government's proposed new labour codes that allow more flexibility for textile companies (e.g., women working night shifts, overtime flexibility). This is a massive structural positive for labor-intensive companies like Welspun.
- Wedding Season Demand: Reports indicate a ₹6.5 Lakh Crore wedding season splurge, directly benefiting home textile demand (bedding, gifting).
- Earnings Turnaround: The Q2 results earlier this month showed a "surprise profit" and strong operational performance, creating a fundamental floor.
📈 2. The Technical Structure
> The Cycle: You correctly identified the cycle.
- Correction: Downtrend from Aug 2024 to April 2025
- Consolidation: Since April, it has been in a sideways base.
> The Breakout: The ₹146 – ₹148 zone has been a "Polarity Zone" (acting as both support and resistance) since Nov 2021 .
- The Move: This week's 9.13% surge decisively cleared this multi-year hurdle.
- The Volume: The volume of 88.37 Million is an "Ignition Bar"—it confirms that institutions are entering aggressively to ride the new policy tailwinds.
📊 3. Technical Indicators
Indicator analysis confirms the trend shift:
- Short-term EMA PCO: Confirmed on Daily & Weekly , signaling a synchronized uptrend.
- RSI: Rising across all timeframes, indicating that momentum is expanding and supports the breakout.
🎯 4. Future Scenarios & Key Levels
With the "lid" removed and policy support in place, the path of least resistance is up.
> 🐂 Bullish Target: ₹178 . This aligns with the previous major swing highs and is the immediate technical objective.
> 🛡️ Support (The "Must Hold"):
- Immediate Support: ₹146 . The breakout zone must now act as support. Any pullback to 146-148 is a high-probability "buy the dip" zone.
- Stop Loss: The level of ₹129 is a safe structural stop, but a close below ₹140 would be the first sign of weakness.
Conclusion
This is a Grade A setup since it's a technical breakout supported by a sector-wide policy catalyst (Labour Codes). The massive volume confirms smart money participation. Watch for the stock to hold above ₹146 .

Karnataka Bank (W): Bullish, Vol-Backed Breakout at ResistanceTimeframe: Weekly | Scale: Logarithmic
The stock has confirmed a breakout from a 10-month angular downtrend. This move is backed by the highest weekly volume in years, driven by smart money entry. However, the stock is currently pausing at a critical horizontal supply zone.
🚀 1. The Fundamental Catalyst (The "Why")
The massive 149 Million volume is a direct reaction to a major news event:
- The Catalyst: Reports indicate that high-profile investors have picked up a significant stake (approx. ₹71 Crore worth) in the bank.
- Implication: When "smart money" enters with such heavy volume, it often signals a structural floor is being created. This gives high conviction to the technical breakout.
📈 2. The "Dual" Breakout Structure
- Angular Resistance (CLEARED): The stock has decisively broken and closed above the angular trendline from the Jan 2024 ATH. This signals the end of the lower-highs (downtrend) structure.
- Horizontal Resistance (PENDING): The ₹211 – ₹213 zone is acting as a stiff "Polarity Zone" (Support turned Resistance).
- The Action: The stock pierced this level intraday (High ~₹220) but faced profit-taking to close near ₹212-213 .
- Interpretation: The inability to close decisively above ₹213 suggests some supply remains. The bulls have breached the gate but haven't fully conquered the castle yet.
📊 3. Technical Indicators
- Volume: The 149M volume is a "Game Changer." It confirms that the trendline break is valid. Even if the price dips, this volume suggests dips will be bought.
- EMAs: The PCO state on Weekly/Daily confirms the trend shift.
- RSI: Rising in Monthly & Weekly, indicating sustained momentum.
🎯 4. Future Scenarios & Key Levels
The strategy now hangs on the ₹213 level.
> 🐂 Bullish Case (Confirmation):
- Trigger: A decisive daily close above ₹213 .
- Target 1: ₹250 . Once ₹213 clears, the stock enters a thin resistance zone, making ₹250 achievable quickly.
- Target 2: ₹286 (ATH).
> 🛡️ Support (The Re-test):
- Immediate Support: ₹193 . If the rejection at ₹213 leads to a pullback, the stock must hold ₹193 to keep the bullish structure alive.
- Buy Strategy: Since the trendline is broken, any dip toward ₹200-205 (retesting the broken trendline) is a high-probability entry zone.
Conclusion
This is a Grade A setup due to the sheer volume participation. The trend has shifted. While the close above ₹213 was missed by a whisker, the volume suggests it is only a matter of time. Watch for a close above ₹213 to enter long positions.

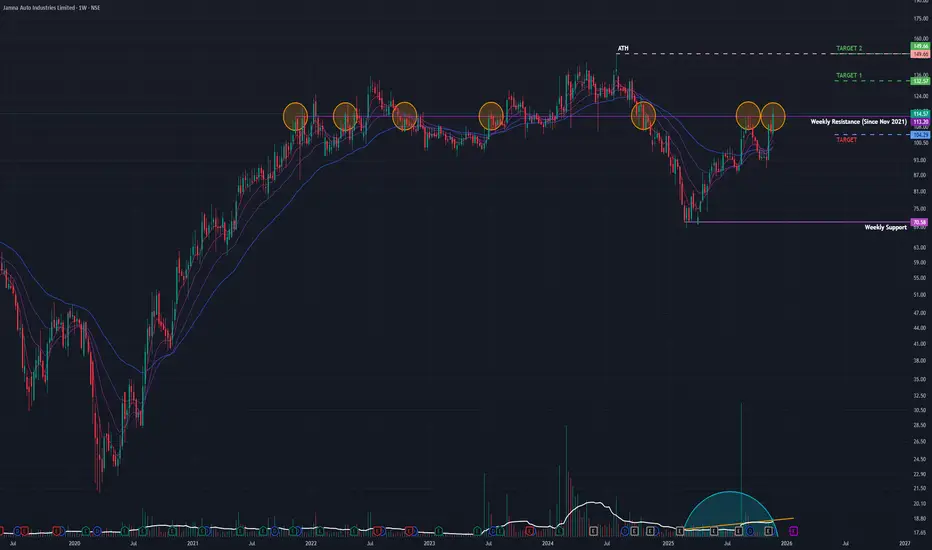
Jamna Auto - Strongly Bullish - Expansion-Driven Breakout(Timeframe: Weekly | Scale: Logarithmic)
The stock has confirmed a decisive breakout from a multi-year resistance zone. This move is supported by a significant capacity expansion announcement, rising volume, and a bullish structural shift.
🚀 1. The Fundamental Catalyst (The "Why")
The breakout is driven by a clear growth narrative that is attracting institutional interest:
- ₹132 Cr Expansion Plan: The company recently announced a major investment to set up new manufacturing facilities. This signals management's confidence in future demand.
- Steady Earnings: Q2 FY26 results showed stable profitability (Net Profit ~₹40 Cr) and declared an interim dividend, providing a fundamental floor to the price.
- Impact: This news has acted as the trigger for the stock to finally clear the 112-114 hurdle.
📈 2. The Long-Term Structure (The Breakout)
- The "Lid" (112-114 Zone): This is the critical polarity zone. It has acted as both support and resistance since Nov 2021 . Breaking a level with 4 years of history is a significant technical event.
- The Breakout: This week’s surge of 8.53% with 17.84 Million in volume is a high-conviction move. The decisive close above ₹114 confirms that the "supply" at this level has finally been absorbed.
- Volume Profile: The "rising volume" in recent weeks confirms that smart money is accumulating shares in anticipation of the expansion benefits.
📊 3. Technical Indicators
Indicator analysis shows a synchronized bullish trend:
- EMAs: Short-term EMAs are in a PCO state across Monthly and Weekly timeframes, confirming that the trend is aligning upwards.
- RSI: The Relative Strength Index is rising without being extremely overbought, leaving room for further upside momentum.
🎯 4. Future Scenarios & Key Levels
With the "lid" removed, the stock is primed for a recovery rally.
- 🐂 Bullish Targets:
- Target 1: ₹132 . This is the first logical resistance.
- Target 2: ₹149 (The ATH). A retest of the all-time high is the ultimate objective of this breakout structure.
- 🛡️ Support (The "Must Hold"):
- Re-test Zone: The ₹112 – ₹114 zone has now flipped to support. A pullback to this level would be a healthy re-test.
- Stop Loss: If the momentum fails, the stock must not close below ₹104 . Losing this level would invalidate the breakout and trap the new buyers.
Conclusion
This is a high-quality setup. The combination of a multi-year resistance breakout and a tangible expansion plan makes this a strong candidate for a move toward ₹132 . Watch for stability above ₹114 .
SMS Pharma (D): Strongly Bullish - News-Driven BreakoutThe stock has confirmed a major structural reversal, breaking out of a 6-month consolidation pattern. This move is powered by a significant regulatory approval (USFDA) and strong earnings, validating the high volume.
🚀 1. The Fundamental Catalyst (The "Why")
The massive surge and volume are not random. They are a direct reaction to two major positive developments:
- USFDA Approval: The company's partner, VKT Pharma, received USFDA approval for reformulated Ranitidine tablets (an antacid). This marks a re-entry into the US market after years, opening a significant revenue stream.
- Strong Earnings: The company recently reported a 79% YoY jump in Net Profit for Q2 FY26.
- Impact: This fundamental "double engine" provides the conviction that the breakout is genuine and not a "trap."
📈 2. The Long-Term Structure (The Reversal)
- The Correction: After the Sep 2024 ATH (~₹398) , the stock corrected ~55% to bottom out in March 2025 .
- The Turnaround: Since March, the stock has shifted structure, forming Higher Lows , indicating that buyers are stepping in aggressively on dips.
- The "Dual" Resistance:
1. Angular Resistance: From the Sep 2024 ATH.
2. Horizontal Resistance: The ₹314–₹317 zone (active since Nov 2024).
💥 3. The Breakout & Re-test (Current Action)
- The Breakout (Yesterday): The stock surged 17.82% with massive volume ( 11.76 Million ), decisively closing above both resistance lines. This high-volume close confirms the "Lid" is off.
- The Re-test (Today): The stock pulled back to the ₹314–₹317 zone today. The volume during this pullback was lower than the breakout volume.
- Bullish Signal: A low-volume pullback to a high-volume breakout level is a textbook "healthy re-test." It suggests profit-taking, not a trend reversal.
📊 4. Technical Indicators
- RSI Cooling: The Daily RSI has fallen with today's re-test. This is actually positive—it prevents the stock from becoming "overheated" too quickly, allowing it to gather strength for the next leg up.
- EMAs: The PCO state across all timeframes confirms that the trend is aligned in favor of the bulls.
🎯 5. Future Scenarios & Key Levels
The "healthy re-test" sets the stage for continuation.
- 🐂 Bullish Target: ₹360 . If the stock holds the re-test level, a move to ₹360 (and potentially the ATH of ₹398) is the path of least resistance.
- 🛡️ Support (The Stop Loss): Support level at ₹290–₹292 is the critical "safety net." If the stock falls back below the breakout zone (₹314), it must hold ₹290 to keep the bullish structure alive.
Conclusion
This is a Grade A setup . Technical breakout, a healthy re-test, and a powerful fundamental catalyst. As long as ₹314 holds as support, the bias is strongly upward.

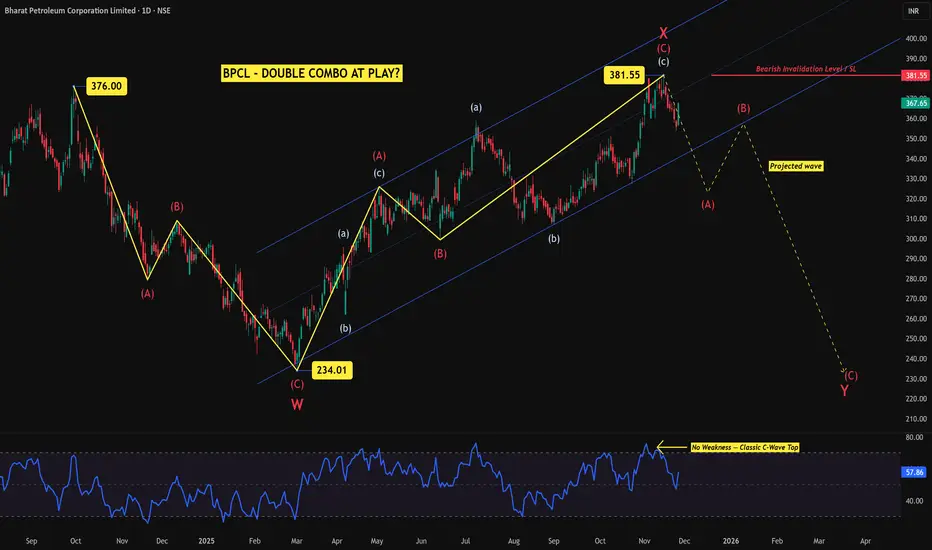
BPCL – Is a Double Combo Unfolding?After reviewing the recent price action in BPCL, the structure that initially looked like a potential impulsive rally has revealed a different internal behaviour upon closer inspection. The key deciding factor was the momentum profile at the recent high near 381.55 . Instead of showing the typical loss of strength expected at the end of a Wave 5, the RSI remained firm with no bearish divergence , which is a classic characteristic of a C-wave termination , not an impulsive fifth wave.
This prompted a reassessment of the entire advance.
Revisiting the Structure
From the March low near 234.01 , price advanced in a clear two-stage corrective manner. Both segments carried zigzag characteristics, aligning better with a W–X–Y double combo rather than an impulsive 1–2–3–4–5 sequence.
Wave W ended at 234.01 after a clean A-B-C decline.
The strong recovery that followed subdivided into two smaller zigzags, forming Wave X , which topped out at 381.55 .
The RSI behaviour at this point supported the corrective interpretation, showing strong momentum without the exhaustion typically seen at the end of an impulsive structure.
This combination lends weight to the view that the rally into 381.55 was corrective in nature.
Current Outlook – Wave Y in Progress
If the 381.55 high is accepted as the completion of Wave X, the decline from that point can be viewed as the early stages of Wave Y, which typically unfolds as another A-B-C structure.
The initial decline resembles a developing Wave A .
A corrective Wave B rebound can follow.
A deeper Wave C may then complete the entire double combo, with possible downside levels aligning toward the 240–260 region depending on the depth of the final leg.
These projected swings are guidelines, not certainties, and the internal structure of each leg must be monitored.
Invalidation Level
The critical level for this view is clear:
A decisive move above 381.55 invalidates the entire bearish W–X–Y expectation.
If price breaks and sustains above this level, the corrective interpretation collapses and a new bullish sequence would be favoured instead.
Conclusion
The internal characteristics of the rally—especially the RSI behaviour—support the idea that BPCL is unfolding a double combo correction rather than a completed impulsive advance. As long as the 381.55 level holds, the risk of further decline remains open, with a potential full completion of Wave Y lower.
Disclaimer:
This analysis is for educational purposes only and does not constitute investment advice. Please do your own research (DYOR) before making any trading decisions.
Ujjivan SFB (D): Strongly Bullish, Testing 5-Year ResistanceThe stock is staging a powerful recovery from its 2025 lows. It is currently challenging a critical "confluence resistance" zone (₹54-₹56) that dates back to Feb 2020. A breakout here would trigger a major structural shift.
📈 1. The Long-Term Context (The "U-Shape" Recovery)
- The Fall: After hitting its All-Time High (ATH) of ₹63 in Dec 2023, the stock entered a steep 15-month correction, losing ~51% of its value by early 2025.
- The Recovery: Since March 2025, the stock has been in a steady uptrend, effectively creating a large "Rounding Bottom" or "Cup" structure.
- The "Lid" (Feb 2020 Resistance): The ₹54 – ₹56 zone is not just a random level; it aligns with the major structural resistance from February 2020 (pre-COVID highs). Breaking this would mean clearing a 5-year hurdle.
🚀 2. The Fundamental Catalyst (The "Why")
The recent bullishness is supported by improving fundamentals, which validates the technical breakout:
- Record Disbursements: In the recent Q2 results, the bank reported its highest-ever quarterly disbursements , signaling strong business growth.
- Asset Quality: Stable asset quality is attracting institutional interest, as seen in the volume spike.
💥 3. Today's Price Action (Nov 26, 2025)
- The Surge: The stock surged +3.84% , closing near the day's high.
- Volume Expansion: The move was backed by massive volume of 30.09 Million shares.
- Volume Trend: This spike comes after a period of declining volume , which is a classic "volatility contraction" setup. The sudden expansion today confirms fresh buyer participation.
📊 4. Technical Indicators
- EMAs: Short-term EMAs are in a PCO (Price Crossover) state across Monthly, Weekly, and Daily timeframes, confirming aligned bullish momentum.
- RSI: The Relative Strength Index is rising across all three timeframes, showing that momentum is accelerating into the breakout.
🎯 5. Future Scenarios & Key Levels
The stock is currently inside the breakout zone.
- 🐂 Bullish Case (Breakout):
- Trigger: A decisive weekly close above ₹56 .
- Target: The primary target is a retest of the ATH at ₹63 . Beyond that, the stock enters "blue sky" price discovery.
- 🐻 Bearish Case (Rejection):
- Trigger: If the 5-year resistance (₹56) proves too strong and sellers step in.
- Support: The stock would likely fall back to the ₹53 level (immediate support) or the 20-day EMA to gather more strength.
Conclusion
The setup is highly potent because it combines a technical recovery with a 5-year structural breakout attempt. Watch for a sustained close above ₹56 to confirm the run to ₹63 .

Nykaa (D): Strongly Bullish, Earnings-Driven BreakoutThe stock has confirmed a major structural breakout, reclaiming levels not seen in years. This move is supported by a powerful combination of rising volume , bullish indicators , and a stellar Q2 earnings report .
🚀 1. The Fundamental Catalyst (The "Why")
The technical breakout is being driven by the company's strong Q2 FY26 Earnings (announced recently):
- Net Profit: Surged over 243% YoY , signaling a massive turnaround in profitability.
- Revenue: Grew ~25% YoY , confirming sustained demand.
- Market Reaction: This fundamental strength is attracting institutional capital, evidenced by the rising volume.
📈 2. The Long-Term Structure (The Breakout)
- The "Lid" (May 2022 Resistance): The ₹260–₹270 zone was a major breakdown level back in May 2022. Reclaiming this zone after 3.5 years changes the long-term trend from bearish/neutral to bullish.
- The Consolidation Base: The "sideways trend since Oct 2025" was effectively a base-building phase where the stock absorbed supply before this leg up.
- Successful Re-tests: The fact that the stock has "re-tested" this breakout level multiple times and held above it confirms that the previous resistance has now flipped to support .
💥 3. Today's Price Action (Confirmation)
- Volume Surge: Today's volume of 14.57 Million is significant. It confirms that the breakout is supported by real buying pressure, not just retail speculation.
- Price Stability: The stock surging ~1% while holding above the resistance-turned-support area indicates that buyers are comfortable accumulating at these higher prices.
📊 4. Technical Indicators
- EMAs: Short-term EMAs are in a PCO (Price Crossover) state across Monthly, Weekly, and Daily timeframes, showing synchronized bullish momentum.
- RSI: The Relative Strength Index is rising across all timeframes , confirming that momentum is expanding.
🎯 5. Future Scenarios & Targets
With the multi-year resistance broken, the stock has room to run.
- 🐂 Bullish Target: ₹315 . This is a logical structural target, aligning with the major swing highs from early 2022.
- 🛡️ Support (The Safety Net): Support at ₹254 is the critical "line in the sand." As long as the stock stays above the ₹260–₹254 zone, the bullish structure remains intact.
Conclusion
The setup is high-quality, a technical breakout supported by a fundamental turnaround . The consolidation above the breakout zone is healthy, and the path of least resistance is now towards ₹315 .

Kalyan Jewellers: Wave Y Still at Play?Disclaimer: This analysis is for educational purposes only and does not constitute investment advice. Please do your own research (DYOR) before making any trading decisions.
Bigger Picture
Kalyan Jewellers topped near 795.40 and has been in a prolonged corrective phase. The structure since then is not impulsive but rather corrective — pointing toward a Double Combo (W–X–Y) correction.
Wave Structure Breakdown
Wave W: A clean zigzag down into 399.40 , completing the first corrective leg.
Wave X: Extended choppy consolidation into 616.00 , best interpreted as a connector.
Wave Y: Currently unfolding as an A–B–C decline . If the pattern holds, another leg lower could complete the structure.
Technical Confluence
Support Zone: 399.40 remains a major demand area , historically respected by price. If retested, it could become the potential accumulation zone .
Projected Trendline Resistance: The descending line from 795.40 to 616.00 may evolve into a key resistance barrier on the next test.
RSI: Recent bounce came from oversold territory — a technical relief rally, not yet a trend change .
Alternate Possibility
If the 442.25 low already marked the end of Wave Y, the current rally could evolve into the start of a new impulsive sequence . Confirmation requires RSI strength above midline (50) and sustained closes beyond the projected descending trendline.
Takeaway
Kalyan Jewellers is most likely unfolding a Double Combo correction (W–X–Y) with Wave Y still in progress. Traders should watch the 399.40 demand zone as a decisive level. Holding it could set up the next bullish cycle, while a breakdown risks a deeper correction toward 336.05.

Man Industries (W): Bullish, Turnaround with Volatility(Timeframe: Weekly | Scale: Logarithmic)
The stock is in a confirmed structural uptrend (Higher Lows) following a year-long correction. It is currently battling a critical multi-year resistance zone, backed by strong fundamental news and rising volume.
📈 1. The Structural Turnaround (The "Big Picture")
- The Cycle: Trend analysis:
- Consolidation: Jan 2024 – July 2024.
- The Peak (ATH): The stock hit a major high in July 2024
- The Correction: A downtrend followed, bottoming out in March 2025.
- The Reversal: Since March 2025, the stock has shifted character, forming a clear series of Higher Lows, signaling that buyers are stepping in at higher prices.
🚀 2. The Catalyst & Recent Action (Week of Nov 17)
- The Catalyst (The "Why"): The recent surge is driven by the company signing a Memorandum of Understanding (MoU) with Aramco Asia India (a subsidiary of Saudi Aramco) to explore a manufacturing facility in Saudi Arabia. This news triggered the volume spike.
- The Breakout Attempt: Last week (Nov 17-21), the stock attacked the horizontal resistance zone.
- Surge: It rallied +5.60% for the week.
- Volume: The move was supported by 5.22 Million in volume —a significant pickup compared to the "dry" correction phase.
- The Rejection: Despite hitting a new 52-week high intraday (₹472.40 on Nov 20), the stock failed to close above the resistance, facing profit-taking near the highs.
📊 3. Technical Indicators
- Trend: Short-term EMAs are in a PCO (Price Crossover) state on Monthly & Weekly charts, confirming the uptrend.
- Momentum (RSI):
- Weekly/Monthly: RSI is rising, supporting the longer-term bullish view.
- Daily: The Daily RSI dipped on Friday, reflecting the immediate rejection/profit-taking at resistance.
🎯 4. Future Scenarios & Key Levels
The "Shooting Star" style rejection on the weekly chart makes the coming week critical.
🐂 Bullish Case (Breakout Confirmation)
- Trigger: A sustained close above the ₹465–₹475 zone.
- Target 1: ₹545
- Target 2: ₹645 (Blue-sky extension).
🐻 Bearish Case (Support Test)
- Trigger: If the "failed breakout" leads to further profit-taking.
- Support: The immediate support lies at ₹420. Holding this level is crucial to maintain the "Higher Low" bullish structure.
Conclusion
The stock is structurally bullish but is digesting a supply overhang at the All-Time Highs. The Aramco news provides a strong floor, but patience is needed for a decisive close above ₹475 to confirm the next leg up.

Tata Consumer (W): Bullish, Consolidation Breakout(Timeframe: Weekly | Scale: Logarithmic)
The stock is emerging from a 9-month sideways consolidation phase. While it has cleared the immediate resistance, the major test lies at the All-Time High (ATH) zone. The formation of bullish reversal candles on the weekly chart suggests buyers are regaining control.
📈 1. Trend & Structure (The "Box" Breakout)
- The Context: Since hitting its peak in Mar 2024, the stock has been trapped in a sideways "box" range.
- The Breakout: This week, the stock managed to close above the immediate horizontal resistance (approx. ₹1,170 - ₹1,180 ).
- Clarification on Resistance: It is important to note that while this is a breakout of the consolidation range, the major All-Time High resistance (around ₹1,240 - ₹1,253) is still just overhead. This is the final hurdle before "blue sky" territory.
🕯️ 2. Candlestick Analysis (The Bullish Signal)
- Hammer Candles: The last two weekly candles resemble Hammer formations (long lower wicks with small bodies).
- Interpretation: This indicates that every time sellers pushed the price down (towards ₹1,130-₹1,140), aggressive buying emerged to push it back up. This "rejection of lower prices" is a classic sign that the bottom is in.
📊 3. Indicators & Volume
- Volume Profile: Volume "dried up" significantly during the correction, and we are now seeing a gradual expansion in volume on up-weeks, indicating institutional accumulation.
- EMAs: The short-term EMAs are realigning into a bullish PCO (Price Crossover) state, confirming the trend shift.
- RSI: The RSI is rising from the mid-zone (above 50), showing that momentum is building without being overbought yet.
🎯 4. Future Scenarios & Targets
- 🐂 Target 1: ₹1,355 (Achievable once ₹1,253 is cleared).
- 🐂 Target 2: ₹1,570 (Long-term extension).
- 🛑 Support (The Safety Net): If the breakout fails, the stock will likely retest the demand zone at ₹1,040.7
Key Watchout
Watch the price action near ₹1,250. A high-volume close above this level is the "final confirmation" needed to activate the targets of ₹1,355+. Until then, it is a "buy on dips" setup.
