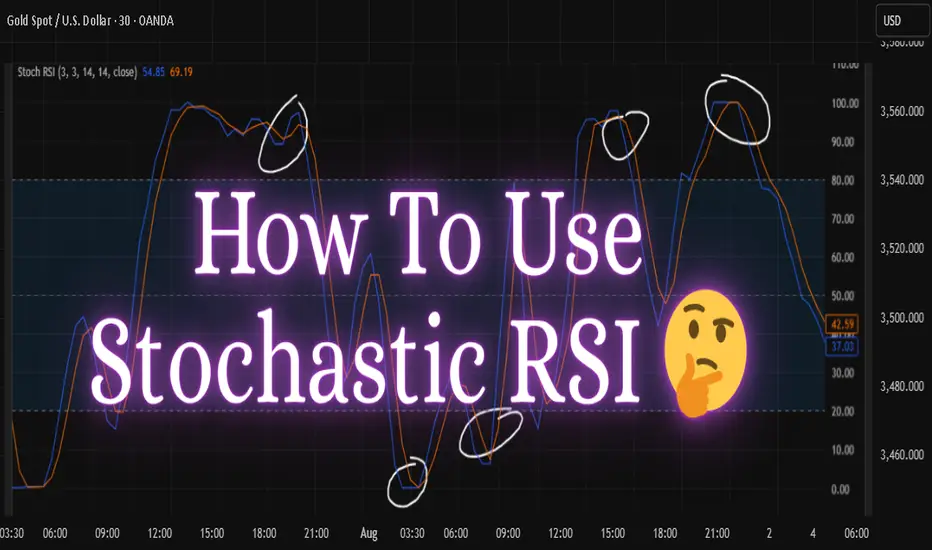
How to Use The Stochastic RSI Indicatorthe stochastic rsi is a momentum oscillator that applies the stochastic formula to the relative strength index (rsi) values, rather than price. this creates an indicator that is more sensitive to market movements, helping traders identify potential overbought and oversold zones faster than traditional indicators.
🔍 how it works
stochastic rsi generates values between 0 and 100 . it is calculated using the rsi value instead of price and then applying the stochastic oscillator formula. this means you're looking at the momentum of momentum!
📊 key levels to watch
* above 80 = overbought 🚨
* below 20 = oversold 💡
these levels suggest potential reversals, but not guarantees. combining them with price action or trend direction increases effectiveness.
⚙️ how traders use it
* entry signals: look for the indicator crossing above 0.2 (bullish) or below 0.8 (bearish)
* exit signals: when stochastic rsi returns from extreme levels
* divergence: just like rsi, divergence between stochastic rsi and price can hint at trend reversals
🛠️ tips for better results
* use with other indicators like moving averages, macd, or trendlines
* adjust the rsi and stochastic settings to fit your trading style
* avoid using it alone in sideways markets — it may give too many false signals
📌 final thoughts
stochastic rsi is a powerful tool when used correctly. it helps traders get early signals and adds depth to momentum analysis. always backtest and combine with proper risk management!
Disclaimer :
This idea post is not financial advice, it's for educational purposes only, I am not a SEBI-registered advisor. Trading and investing involve risk, and you should consult with a qualified financial advisor before making any trading decisions. I do not guarantee profits or take responsibility for any losses you may incur.
M-oscillator
Master Institutional Trading🎯 Introduction
Master Institutional Trading is the advanced art and science of trading the financial markets the way big institutions do — with deep capital, strategic precision, and unmatched risk management.
Unlike retail trading, which often relies on basic indicators and emotions, institutional trading follows a rule-based, data-driven, and psychology-controlled framework. Mastering this approach means stepping into the mindset and strategy of hedge funds, mutual funds, proprietary desks, and investment banks.
If you want to trade with consistency, clarity, and capital preservation, mastering institutional trading is the next step.
💡 What is Institutional Trading?
Institutional trading refers to the activities of large financial entities that control significant capital and influence market movement through their trades.
Examples include:
Hedge Funds
Mutual Funds
FIIs (Foreign Institutional Investors)
DIIs (Domestic Institutional Investors)
Pension Funds
Proprietary (Prop) Trading Desks
These institutions operate based on in-depth research, order flow analysis, macroeconomic models, and advanced risk frameworks.
🧠 What Does “Master Institutional Trading” Mean?
It means gaining the skills, tools, mindset, and techniques to:
Analyze market movements through institutional logic
Identify smart money footprints
Build trades based on volume, order flow, and positioning
Manage risk with capital preservation like pros
Avoid retail traps and fakeouts set by institutions
You’re not just reacting to the market—you’re reading what the big players are doing and aligning with them.
🧩 Core Concepts in Master Institutional Trading
1. Market Structure Analysis
Understand liquidity zones, order blocks, and institutional S/R
Learn why institutions build positions over time, not all at once
2. Volume & Open Interest Analytics
Spot unusual volume spikes
Understand Open Interest traps in options
Decode what institutions are betting on
3. Smart Money Concepts
Accumulation and Distribution phases
Wyckoff Theory in modern application
Spotting manipulation and liquidity grabs
4. Advanced Risk Management
Never risk more than 1–2% per trade
Use position sizing based on volatility
Focus on capital efficiency, not revenge trading
5. Price Action + Institutional Candle Patterns
Recognize imbalance zones, breaker blocks, and engulfing traps
Use tools like VWAP, Delta Volume, and Footprint Charts
6. Trade Execution Techniques
Partial entries
Scaling in/out like funds
Managing trade lifecycle like a desk trader
🛠 Key Strategies in Master Institutional Trading
A. Liquidity Hunting
Institutions place orders where most retail SLs are placed
Then reverse price after triggering retail orders
B. Options Positioning & IV Play
Use of Straddles/Strangles for theta decay
Selling volatility pre-event, buying it post-event
C. Delta Neutral & Gamma Scalping
Market-neutral strategies hedged with futures or stocks
Designed to profit from volatility swings
D. Accumulation/Distribution Mapping
Long consolidation = institutional entry/exit
Price reacts to volume shifts more than indicator signals
🔥 Institutional Footprint Examples (Nifty/Bank Nifty)
ATM Straddle OI surge with no move in price
→ Market makers hedging aggressively = big move coming
Sudden OTM Put buying with high IV on a flat day
→ Institutions betting on downside volatility = potential crash setup
VWAP deviation rejection
→ Institutions use VWAP as a fair value; moves away from it often reverse
👨🏫 How to Master Institutional Trading?
✅ Step-by-step Learning Path:
Study Market Microstructure
Understand how orders get matched, what limit/market orders do.
Learn Option Greeks & Institutional Strategies
Especially delta, gamma, and IV crush.
Use Volume Profile, VWAP, OI data together
Build your view based on multi-layered confirmation.
Follow FIIs/DII Data Daily
Learn how they position in equities, derivatives, and sectors.
Backtest Institutional Setups
Focus on risk-reward, not just accuracy.
Use Trading Journals
Analyze what works, improve continuously.
⚠️ Common Mistakes Traders Make (That Institutions Don’t)
Chasing trades emotionally
Overtrading low-conviction setups
No journaling or review process
Relying on random indicators instead of structure
Ignoring risk-to-reward or capital management
🧘♂️ Mindset of Institutional Traders
"Protect capital first, profits will follow."
Trade like a sniper, not a machine gun.
Think in terms of probabilities, not guarantees.
Never marry your analysis; adapt to new information.
💼 Who Should Learn Master Institutional Trading?
Intermediate to advanced traders
Full-time traders or those planning to go full-time
Derivatives traders (Nifty, Bank Nifty, Options)
Students of technical analysis who want a deeper, real-world edge
🔚 Final Words
Master Institutional Trading is the next-level evolution of your trading journey. It’s about stepping away from noise and hype, and embracing how real money trades.
You don’t need a hedge fund job to trade like one—you just need the knowledge, tools, and discipline. When you think and act like an institution, you stop being prey and start playing the game with the big players.

Option Trading Advanced Strategies📌 Introduction: Why Go Beyond Basic Options?
Basic option strategies like buying calls or puts, or even covered calls, offer simplicity—but they don’t fully unlock the potential of options as a strategic tool.
When you enter the advanced territory, you gain the power to:
Profit in sideways markets
Neutralize directional risks
Create high-probability income
Minimize drawdowns
Take advantage of volatility shifts
Advanced strategies require you to understand multi-leg positions, greeks, risk/reward shaping, and market timing.
Let’s break it all down into clear, real-life explanations.
🧩 1. Iron Condor – Profit in Range-Bound Markets
🔍 What is it?
An Iron Condor involves selling a call spread and a put spread at the same time, expecting the stock/index to stay in a tight range.
🔧 Construction:
Sell 1 OTM Call
Buy 1 further OTM Call
Sell 1 OTM Put
Buy 1 further OTM Put
All with same expiry.
🎯 Ideal Market View:
Market is range-bound
You expect low volatility
No major event expected
💰 Max Profit:
Occurs when stock expires between the two short strikes
⚠️ Max Loss:
Happens when stock moves beyond outer strikes
✅ Why use it?
Generates monthly income
Defined risk
High probability if used smartly
⚖️ 2. Butterfly Spread – Profit from Precision
🔍 What is it?
The Butterfly Spread is a neutral strategy where the trader expects the stock to close near a specific price.
🔧 Construction (Call Butterfly):
Buy 1 ITM Call
Sell 2 ATM Calls
Buy 1 OTM Call
All with same expiry.
🎯 Ideal Market View:
You expect stock to move very little
Great for expiry day setups or low-volatility trades
💰 Max Profit:
When stock closes exactly at strike price of sold calls
⚠️ Max Loss:
When price moves significantly up or down
✅ Why use it?
Cheap entry cost
Controlled risk
Can return 200–300% with precise movement
🌀 3. Calendar Spread – Play on Time and Volatility
🔍 What is it?
A Calendar Spread profits from time decay and implied volatility expansion.
🔧 Construction:
Sell 1 Near-Term Option
Buy 1 Longer-Term Option
Same strike, same type (Call or Put)
🎯 Ideal Market View:
Expect stock to stay around strike price in short term
Expect volatility to increase
💰 Max Profit:
When the short-term option decays and stock remains near the strike
⚠️ Max Loss:
If stock makes a strong move or IV drops unexpectedly
✅ Why use it?
Good for earnings events
Plays time + volatility
Low capital strategy
💡 4. Ratio Spread – When You Want a Controlled Gamble
🔍 What is it?
A Ratio Spread involves selling more options than you buy (like buying 1 Call and selling 2 Calls). It’s directional but nuanced.
🔧 Construction (Call Ratio Spread):
Buy 1 ATM Call
Sell 2 OTM Calls
You can reverse for puts if bearish.
🎯 Ideal Market View:
Expect a mild bullish move, not a breakout
Moderate volatility
💰 Max Profit:
When stock closes near the short strike
⚠️ Max Risk:
If stock moves too much upward, losses can be unlimited (unless hedge is applied)
✅ Why use it?
High reward-to-risk if market behaves
Can be converted into a risk-free structure using debit/credit adjustments
🏹 5. Straddle and Strangle – Playing Big Moves
🔍 What is it?
Straddle and Strangle are volatility-based strategies.
Straddle = Buy Call + Buy Put at same strike
Strangle = Buy OTM Call + Buy OTM Put
🎯 Ideal Market View:
Expect a big move but unsure of direction
Perfect for events: earnings, budget, Fed announcements
💰 Max Profit:
When market makes a big move, either up or down
⚠️ Max Loss:
When market stays flat
✅ Why use it?
Useful before news or big breakout
Non-directional but aggressive
🧮 6. Delta-Neutral Trading – Profit Without Direction
🔍 What is it?
Delta-neutral trading aims to neutralize directional risk (delta = 0) using a combination of options and/or futures.
💡 Example:
Sell ATM Call + Buy underlying stock in proportion so total delta = 0
Or balance long and short options across strikes
🎯 Ideal Market View:
Expect volatility or time decay
No strong directional bias
✅ Benefits:
Income generation regardless of market direction
Hedged and flexible
🔁 7. Rolling Strategies – Actively Adjust for Profit
🔍 What is it?
Rolling means shifting an existing position to a new strike or expiry to manage risk or lock profit.
Use Cases:
Roll down puts in falling market
Roll up calls in bull trend
Roll to next expiry to extend time decay
✅ Benefits:
Dynamic control
Prevents stop-loss triggers
Protects profits in trending markets
🛑 Risk Management Tips for Advanced Traders
Always define max loss – Use spreads, not naked trades
Check IV before trading – High IV = sell premium; Low IV = buy premium
Position sizing – Never go all-in on a strategy
Use alerts and automation – Advanced strategies need fast reaction
Avoid illiquid options – Stick to Nifty, Bank Nifty, liquid stocks
Paper trade first – Test complex strategies without real money
📈 Real-Life Example – Iron Condor on Nifty
Let’s say Nifty is at 24,300 and expiry is 7 days away. You expect Nifty to stay between 24,000 and 24,600.
Trade Setup:
Sell 24,000 Put
Buy 23,800 Put
Sell 24,600 Call
Buy 24,800 Call
Net credit: ₹50–60
Max Profit: ₹50 if Nifty stays between 24K–24.6K
Max Loss: ₹150 if market breaks either side
This gives a 1:3 risk-reward with 70%–75% probability.
💬 Final Thoughts
Advanced option strategies aren’t about gambling—they’re about precision, hedging, and income generation with structure. They offer you more control than simple buying/selling.
But with more power comes more responsibility:
Know your market view
Know the structure of your strategy
Know when to adjust or exit
Once you understand how to read volatility, manage risk with Greeks, and construct defined-risk trades, options can become your most flexible and profitable tool in the market.
Bollinger Band as a Dynamic Support/Resistance LevelThis study delves into the significance of the Upper Bollinger Band (UBB) as a resistance level in financial markets, particularly focusing on instances where an asset fails to close above the UBB and the subsequent rallies when such breakouts occur. The Upper Bollinger Band, a technical analysis tool developed by John Bollinger, is a volatility-based band that encapsulates price movement. Traders often use it to identify potential reversal points or the initiation of a new trend.
Analysis:-
Resistance at UBB:
The UBB frequently acted as a formidable resistance level. Prices approach the UBB but fail to close above it, it suggests a strong selling pressure or a temporary halt in the bullish momentum.
Breakthroughs and Rallies:
Instances where prices successfully close above the UBB are marked by a shift in market sentiment. This breakthrough often triggers increased buying activity, leading to substantial rallies. The phenomenon may indicate a breakout from a consolidation phase or the initiation of a new uptrend.
Confirmation Signals:
Traders may use additional technical indicators or chart patterns to confirm the significance of the UBB breakthrough. For example, i have drawn a resistance zone.
Volatility Expansion:
Breakouts above the UBB are often accompanied by an expansion in volatility. This increased volatility contributes to the momentum of the rally, attracting more market participants.
in this chart the above phenomenon happened two times and was a successfull entry.
While going through charts it has also failed you can see itc and hindustan uniliver where it has failed. So add more confirmations of breakout like volume indicator or momentum indicators like rsi.


Dual Bollinger Band Jackpot Strategy.This is a strategy for Swing Traders who just want to capture the swing and don't want to hold the stock for months. This strategy requires 3 indicators:-
Bollinger band (20,2) and Bollinger band (20,1)
Volume
MACD
Trade Setup for Long:-
1] The candle which closes above UB 2, we will call it BREAKOUT CANDLE.
The BREAKOUT CANDLE should have following properties;
a) The volume of this candle should be greater than previous TWO CANDLE's volume.
b) MACD histogram and MACD line should be greater than zero.
2] There should be minimum TWO CANDLES just before the BREAKOUT CANDLE which closed
between UB 2 and BASIS. Those TWO CANDLES should consists of atleast one RED CANDLE.
And that RED CANDLE should not touch the BASIS.
TIMEFRAME:- DAILY CHART.
When all of the above requirements is fullfilled we can BUY above the high of BREAKOUT CANDLE.
STOPLOSS is 1 point below the low of BREAKOUT CANDLE.
TARGET is 2 times the STOPLOSS.
DISCLAMER:- this is for educational purposes only.
DON'T apply this startegy directly with real money. First do paper trade and see the results and analyse the profitability of this strategy.

MACD: Bearish or Negative Divergence1. What is a divergence ?
a) A divergence takes place when the MACD indicator (or any other technical momentum indicator) contradicts price.
b) A divergence is often seen as a sign that the current market action is losing its momentum and weakening, meaning it could soon change direction.
c) One of the most common problems with divergences is ‘false positives’, which is when the divergence occurs but there is no reversal.
2. What happens generally post a divergence ?
The price market makes an all-time high and the MACD indicator below makes a lower high. This is another excellent reversal trade opportunity and you can see for yourself what happened with price after the event.

What Is the RSI Indicator & RSI DivergenceRSI - Relative Strength Index Indicator:
The Relative Strength Index (RSI) is a momentum indicator used in technical analysis that measures the magnitude of recent price changes to evaluate overbought or oversold conditions in the price of a stock or other asset. The RSI is displayed as an oscillator (a line graph that moves between two extremes) and can have a reading from 0 to 100. It is important to note that the RSI does not indicate whether a stock is a buy or a sell; rather, it provides insight into the current trend of the stock.
The RSI is a versatile indicator that can be used by traders of all levels and can be adapted for any style of trading. For example, a trader may use the RSI to identify support or resistance levels, or to spot divergences that can be used to predict future price movements. The RSI can also be used to locate potential trading opportunities by looking for overbought or oversold conditions. Furthermore, the RSI can be used in combination with other indicators, such as moving averages, to gain a better understanding of the market’s overall trend.
Formula of RSI:
The RSI is calculated using a formula that compares the magnitude of recent gains against recent losses over a specified period. The formula for the RSI is:
RSI = 100 - (100 / (1 + (Average of Upward Price Movements / Average of Downward Price Movements)))
What is periods in RSI:
Periods in RSI (Relative Strength Index) are the number of time periods used to calculate the RSI. The most commonly used period for RSI is 14, but other periods such as 7, 9, and 25 are also used. This number represents the number of time periods that are used to calculate the RSI, so a period of 14 would mean the RSI is being calculated using the last 14 time periods.
RSI divergence:
RSI divergences are a type of technical analysis used to identify potential trend reversals in the markets. They are based on the Relative Strength Index (RSI) and are used to spot potential trend reversals before they occur.
A divergence occurs when the price of an asset makes a higher high, but the RSI makes a lower high. This suggests that the current rally is losing momentum and may reverse course. Similarly, a lower low in the price and a higher low in the RSI may signal an impending rally.
Divergences are best used in conjunction with other technical indicators and analysis to confirm price action. It is also important to keep in mind that divergences do not always lead to reversals and may simply signal a period of consolidation before the price continues its current trend.
Divergence Cheat Sheet / Types of Divergence:

RSI Color Zones by Feroz Usage GuideIt is chart showing how RSI & Overbought & Oversold Zones help visually in finding low risk setups
Example chart Used - Karnataka bank
Indicator Used - RSI Color Zones by Feroz
Indicator link
Note: Not suggesting any Investing/Trade Idea. Its just for Educational Purpose.

Rsi & Price breakoutRelation between rsi and price breakout.
Method of drawing trendlines in rsi and it's relations with price action and price breakout.

How to trade like a PRO on the basis of Technical Analysis. In this analysis we'll look how the Professional Trader explore the chart before executing their Trade.
Demand Zone -
Fib Retracement -
Candlesticks -
Divergence - Divergence warns that the current trend is getting weakening and it might possible that the trend get changed in up coming session.
Volume Profile - POC - Point Of Control
It's the Big guys who moves and manipulate the market, The Retail Traders can't.
This is Not investment advice. It's just for learning purpose. Invest your capital at your own risk.
Please like, share & follow.

Bullish RSI Divergence -A case study and future recommendationRSI Divergence refers to the deviation of RSI with respect to price. Even though the price may be going in a set direction (say making lower lows), the RSI could go in a completely different direction (higher lows). RSI is a clearcut indicator of buyer strength or buyer accumulation at a specific given time and price. An RSI Divergence generally is strongly related to change in trend.
RSI Divergence can be of 2 types: Bullish and Bearish. Here I shall discuss about Bullish RSI Divergence. In case of Bullish RSI Divergence, the price makes a lower low (in a downtrend) while the RSI makes higher lows (a sort of W formation). This shows that even though the price is dropping, the buyer strength and accumulation is increasing.
Please refer the image above for visual example.
How to trade?
In case of bullish divergence, one should go long with a SL below the low of the present price.
In the present case, one can go long in Amaraja with a SL of 660 and for a target of 800-850

📉 Your Ultimate Guide to RSI Divergence (Settings & Tips) 📈
Hey traders,
Relative strength index is a classic technical indicator .
It is frequently applied to spot a market reversal.
RSI divergence is considered to be a quite reliable signal of a coming trend violation and change .
Though newbie traders think that the application of the divergence is quite complicated, in practice, you can easily identify it with the following tip s:
💠First of all, let's start with the settings .
For the input , we will take 7/close .
For the levels , we will take 80/20 .
Then about the preconditions :
1️⃣ Firstly, the market must trade in a trend (bullish or bearish)
with a sequence of lower lows / lower highs (bearish trend) or higher highs / higher lows (bullish trend).
2️⃣ Secondly, RSI must reach the overbought/oversold condition (80/20 levels) with one of the higher highs/higher lows.
3️⃣ Thirdly, with a consequent market higher high / lower low, RSI must show the lower high / higher low instead.
➡️ Once all these conditions are met, you spotted RSI Divergence .
A strong counter-trend movement will be expected.
Also, I should say something about a time frame selection .
Personally, I prefer to apply it on a daily time frame , however, I know that scalpers apply divergence on intraday time frames as well.
❗️Remember, that it is preferable to trade the divergence in a combination with some price action pattern or some other reversal signal.
❤️Please, support this idea with a like and comment!❤️

divergence set up - some basic learningwhat is Divergence ? 👇
Divergence is when the price of an asset is moving in the opposite direction of a technical indicator, such as an oscillator, or is moving contrary to other data. Divergence warns that the current price trend may be weakening, and in some cases may lead to the price changing direction
what is Oscillator ? 👇
An oscillator is a technical analysis tool that constructs high and low bands between two extreme values, and then builds a trend indicator that fluctuates within these bounds. Traders use the trend indicator to discover short-term overbought or oversold conditions.
how is Oscillator used in Trading ? 👇
Oscillators are chart indicators that can assist a trader in determining overbought or oversold conditions in ranging (non-trending) markets. Most traders use multiple oscillators to confirm range extremes and for determining the important entry and exit points.
🛑Indicators for spotting the divergence indicator patterns are the Awesome Oscillator, macd, the RSI, CCI or stochastic.🛑
disclaimer - personal view (can be wrong)

RSI Divergence A very good predictor for exhaustion of trend..
This is only for record...
When in strong trend keeping eye on RSI helps.
If RSI don't make new tops/bottoms there is high
probability of trend reversal.
There can be one more attempt by price to move in direction
of trend before reversing so this only needs to be used
as supporting indication.


Gold Spot / USD Dollar(Gold Shining Fading in May)?Gold Spot / USD Dollar (Gold Shining Fading in May)
(Gold “The Light Had Faded and Dusk was Advancing)
• Gold Spot The Shining of Gold is Fading now means the Light had Started Fading now and Dusk was Advancing in Gold Slowly in the start of Month of May and Will Continuous will go for entire Current Month
• Three Time Gold Tried for New Break out from the upper Channel but Unable to do the same
• Continuous Rise in the Upper Channel
• Volumes Started Decreasing
• Momentum also Decreased in the last 10 Sessions
• Let See If Equity will Rise Subject to if Slowly Lock downs Will Start Releasing the effect will see on Gold on Negative Side
• If Lock downs Opens Slowly then Economy and Industries will rise which will impact Gold Negatively and His Shine will start fading off
• Let See?
(Finally if you liked the Idea pls provide likes and comments and pls provide suggestion if you something dont like about the idea )

ICICIPRULI SHORTBEARISH CROSSOVER IN STOCHASTIC INDICATOR
RSI ALSO COMING FROM OVER BOUGHT ZONE
ENTRY BELOW 356.2
STOP LOSS - 372


HDFC SHORT NEAR TRENDLINE READY TO BREAK
STOCHASTIC GIVES BEARISH CROSSOVER
ENTRY - BELOW 1626.2
STOP LOSS - 1679

ICICI BANK SHORTSTOCHASTIC GIVES BEARISH SIGNAL TODAY ON DAILY CHART
ALSO STOCK IN DOWNTREND
SELL BELOW - 328
STOP LOSS -344.35

Nifty Inside Bar and Divergence ComboWe can clearly see the price struggling to breakout of the Weekly Levels. In the Daily, we can see a Negative Divergence with RSI (orange line) followed by Double Red Inside Bar. If today, the price breaks below the yesterday's range, we can expect quick down move.

Usdinr fresh break down or recovery? As rsi is out side bands... Likely to get into bands... So can expect upside till 71.5.. On the other side currency war clam down may take it 70 levels..
Disclaimer : I am not certified analyst
