BTC’s price hit $38624.14The price of BTC/USDT has been dumped by -1.05% in the last 24 hours. Bitcoin is shown in the bearish mode & it will touch $24000 in 2023 and in bullish mode it will touch the $38600 in 2023. The previous All Time High was on 10th November 2021 where BTC was priced at $69,045.
It has moved by 17.54% in the past week and it currently at $30000 approximately. There is slight bearish sentiment shown in the crypto market But in the long term it will hit the $34900 approximately in 2024. The current market cap of Bitcoin is $582,490,336,788.
M-trader

OLECTRA GREENTECH CAN GO LONG Buy signal was above 939 level and already retested. Can take Swing positions in this.

Add this stock to your circle #LongAdd this stock to your circle #Long. Wait for the perfect breakout.

EURUSD trade analysis by advanced high frequency trading bucksEURUSD trade ananysis by advanced high frequency trading bucks lets goo high reward setup according to market scenario so lets play it

TRX’s price has pumped by 0.57% in the last 24 hours.1) TRX could hit $0.088 in 2023
2) TRON’s price prediction for the most bearish scenario will value TRX at $0.057 in 2023
3) TRON’s previous All Time High was on 5th January 2018 where TRX was priced at $0.23
4) To simplify the latest TRX price prediction, we have divided up the prediction by short term TRON price prediction and long term TRON price prediction.
5) TRX had a trading volume of $288,753,858. TRON has gone up by 3.94% in the past 30 days.
6) According to our analysis in the short term, TRON price prediction for August 2023 shows the average price of TRX at $0.068 and the highest possible price for August 2023 would be $0.072.
7) Further, according to our analysis in the long term, TRON price prediction for December 2023 shows the average price of TRX at $0.073 and the highest possible price for December 2023 would be $0.078.

XAUUSD GOLD TECHNICAL ANALYSIS FOR UPCOMING MARKET EVENTS XAUUSD Technical Analysis
Strong support: 1939 / 1914.
Strong resistance: 1954 / 1965
Gold is testing sideways range support and several scenarios could develop from here. You have to be prepared for each one.
It is forming a triangle pattern. A decline in the dollar will strengthen our gold.
The moving averages indicate that consolidation is forming. If there is not a strong pullback upwards, in the medium term we should expect a fall in price along the trend
If the dollar goes down and forms a correction, gold will strengthen to 1965 and possibly to 1984, but if the dollar continues to rise after exiting the triangle, gold will start another decline to 1914.


FINNIFTY KING SETUP FOR TUESDAY EXPIRYFinnifty stucked in a tight range and almost rejected from ATH my view in buying side is not at all i want to sell on rise and thats what i am doing people may buy but in my opinion it is tukka and i am not interested in that
tomorrow plan is same sell after opening and add more qty below previous low i.e today low
contact your advisor before

#LALPATHLAB... Looking good 29.05.23#LALPATHLAB...
Intraday as well as swing trade
All levels given in charts ...
IF good potential seen then we work in options also
if activate then possible a good movement Keep eye on this ...
We take trade only when it activates...
Possible to give good target
TRADING FACTS

BAJAJ FINANCE TESTING RESSISTANCEBajaj Finance testing the big resistance on big time frame a short trade with small SL must be considered from the levels with advice of financial advisor and taking less risk

NIFTY CONFUSION SETUP Nifty closed at 18500 sustaining above 18500 can lead to 18700 and ATM too but as per RSI a king setup market looks poised and strength in buying is week now chances of fakeout are more i will keep eye on 18420 level below this a nice slip can be planned by a good trader new traders stay away

Bearish setup for banknifty Looking to short bank nifty with yesterday day high as an sl will add qty after breakdown of today low as an sl targeting big as it is swing trade connect with your financial advisor then only trade

CHAMBAL FERTILISER (BULLISH)CHAMBAL FERTILISER is a chemical stock
from a long time stoack was in consolidation
Between the level of 370 -260 from from jun 2022
Now stock was trying to make a inverse HEAD AND SHOULDER PATTERN
From the feb-14-2023 first it makes a SHOULDER at level of 270 -275 on feb -24-2023
After that make a HEAD at level of 250-248 on mar-29=2023 the retrech at the same level of
Shoulder resistence. Then it make a next shoulder at the same level of 270-275 on apr -25-2023
Then they try to retrech on the same level of heads and shoulder neckline i.e 290
above 295 or neckline (day closing is very imp )stock is bullish
just a view / consult your financial advisor befor investing and trading

REC May month watch out Monthly RSI above 60
Weekly crossing at 60
Bb at crossing level and also at resistance
Watch out for next week and if it hold with breakout level
We can enter for 1st target with SL at resistance level

TRENT Look bearish Trent looks bearish below 1350
CHASRT makes a pattern or fallin wedge
below 1350 it look bearish
trent was trying to make this pattern
from 23/Dec/2022
successfully make this wedge
stock was trying to break at upper level on
03/Apr/2023 but it was a fake breakout
Or we can say bear get active
Below 1350 level new seller try shot
just view
consult your advisor before any action

Banknifty Analysis on bigger time frameBanknifty as per my setup looks good in buying i always calculated risk then enter always after consulting with your financial advisor

NIFTY 50 for next weekNifty 50 looking good for current week till 17200 is holding on closing basis refer with you finanical advsior before entering in market

Finnifty looking well for swing Finnifty looking strong now untill holding the keveks on chart more really is still pending consult advisor first

SOLUSDTPER | 1D | Try long entries when we hit the support (green zone) and wait for confirmation before entering. Analyse the chart, Look at the Fibonacci levels price reversed at 61.8% exactly. We can see the next support was also at the same level.

Banknifty after a pullbackBanknifty have given nice recvery from lower levels on last trading day i.e wednesday monday after a gap down or a pullback then a good movement can be seen in banknifty
concerened with your advisor before entering in any trade

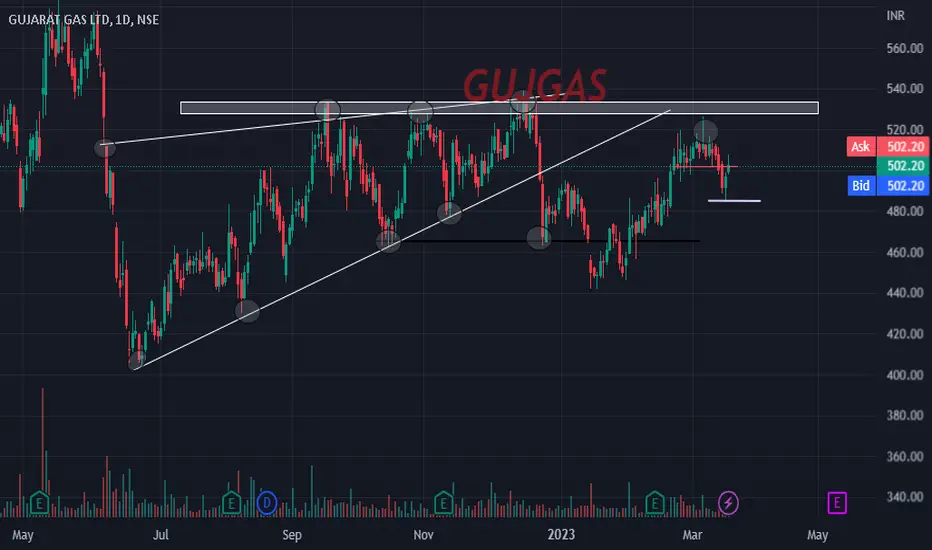
GUJGAS RISING WEDGE AFTER MAKING RISING WEDGE IN GUJGAS
A stock is in consolidation
a movement come in a stock in downword But
Again from the lower level there is buying in stock
stock still not complete the target of rising wedge
keep an eye on that
just a view
consult your advisor before any action