CONSOLIDATION BREAKOUT IN LTIMBuy LTIM (D) 5240, for 5700 and 6100. Add on dips till 5000 with stop at 4950 on weekly close. Stock ready to give breakout above 38.2% fibonacci levels and then will reach 50% and 62% eventually. Consolidation happening for last 12 months which shall give minimum 15% returns.
Both leading and lagging indicator MACD and EMA is indicating bullish momentum in LTIM
Moving Average Convergence / Divergence (MACD)

Nifty Bank Chart with RSI, MACD with W Pattern breakoutNifty Bank Chart with RSI , MACD with W Pattern break out - for our study.
Possibility of Break out is high as we can go for long


Tata elxsiWelll as we can see from the daily chart if it break the resistance and I think it will ,as from the macd histogram and rsi it's quite indicative it will

GIPCL: Short term to Mid term view-BullishDaily MACD Crossover, Weekly ADX positive trend, and all other indicators showing positive signals. Monthly MACD crossover happened but still price not yet moved much upside. Monthly indicators also positive. It may shootup anytime but patience is important to hold.
Vijayaraghavan.K,
Kovilpatti,Tuticorin Dist.

TATA ELXSI : Upmove expectedThe MACD is indicating an upward movement along with gradual increase in RSI.....Upward movement can be seen in 1-2 days.

ESCORTSDaily
Price Action - Triangle Breakout from Bottom
RSI > 60 Bullish
MACD - Buy Signal
Bolinger Upper Band - Broken which indicate momentum
ADX needs to increase to pick more momentum
Weekly:-
MACD needs to turn Buy signal
Futures data:-
Long Buildup on breakout

MACD , RSI ,BB BREAKOUTNSE:HINDALCO It gives good idea to buy. tomorrow MACD crosses SIGNAL line and RSI is above 60. As well as it breaks the bollinger band with big green candle .

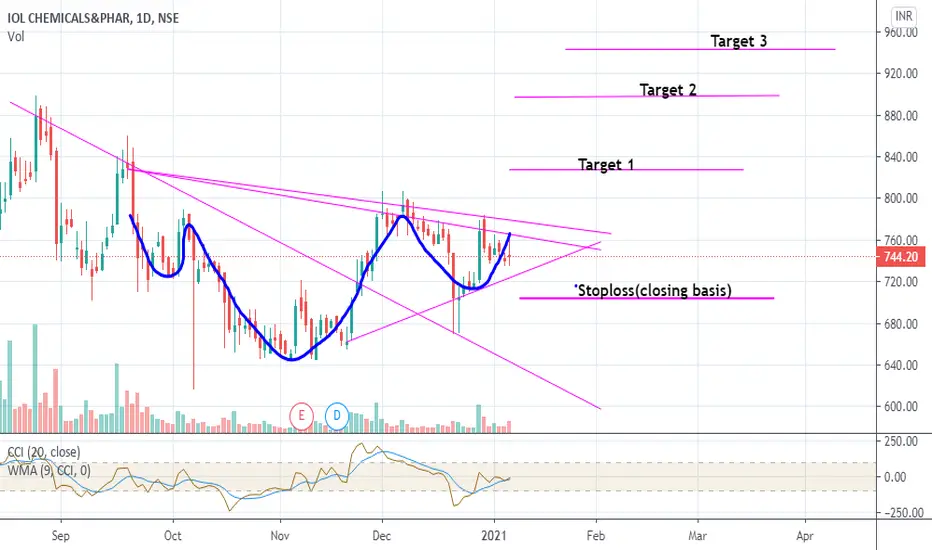
IOLCP: Short& Mid term view BullishRef chart. MACD crossover may happen on upcoming days in daily chart. This will trigger to price shoot-up. In daily chart Indicators are turning bullish from bearish . In monthly chart indicators are continuing the bullish momentum last few months. From this level it may move the further upside. Targets are given by using patterns.
****Note: If you noticed my earlier views, most of the views given before breakouts by using indicators. Risk takers no issues but Safe traders can take the trade after breakout.
Vijayaraghavn.K
Kovilpatti.
Dhanlakshmi Bank: Short term bullish viewDaily and weekly indicators showing bullish signals and monthly indicators also showing positive momentum. These will helps to reach the given target levels. Breakout also done.
Vijayaraghavan.K,
Kovilpatti

Nifty 50NIFTY 50 (MONTHLY):- NIFTY 50 MOVE IN CHANNEL AND MACD BULLISH DIVERGENCE I NOTICED WHICH MEANS WE ARE GOING FOR BIG MOVE LET SEE I DONT THINK WE WILL BE GO DOWN FOR MID FEB... LET SEE

Bear Started in Nifty50 MarketMy basic analysis using 14RSI shows divergence with negative RSI slope also this fact is supported by MACD Indicator. So I believe markets gonna go down.


