This is a GBP/JPY (4H) setup This is a GBP/JPY (4H) setup — a bearish structure with two target points clearly marked below the current price.
🧭 Chart Breakdown:
The price has broken below the ascending trendline and the Ichimoku Cloud, showing bearish momentum.
The first target point is at a nearby support level, and the second is a deeper extension move.
🎯 Targets:
First target: around 174.60 – 174.70 zone
Second target: around 172.90 – 173.00 zone
🔍 Summary:
Trend: Bearish below 176.50
Targets:
TP1 → 174.60
TP2 → 172.90
Invalidation: Break back above 176.80 (re-entry into the cloud/trendline)
Metals

ETH/USDT (4H) chartETH/USDT (4H) chart:
The price is currently trading near a support zone (around $3,250–3,300).
The chart shows a potential bullish setup with two marked target points above.
The Ichimoku Cloud suggests resistance around mid-levels before a full reversal.
Here’s the breakdown 👇
🔹 Key Levels:
Support zone: $3,250 – $3,300
First target (inside the cloud): around $3,700 – $3,750
Second target (top / resistance zone): around $4,150 – $4,200
🔹 Summary:
If ETH holds the current support and breaks above the cloud:
Target 1: ≈ $3,700
Target 2: ≈ $4,200
Invalidation: below $3,200 (support breakdown)

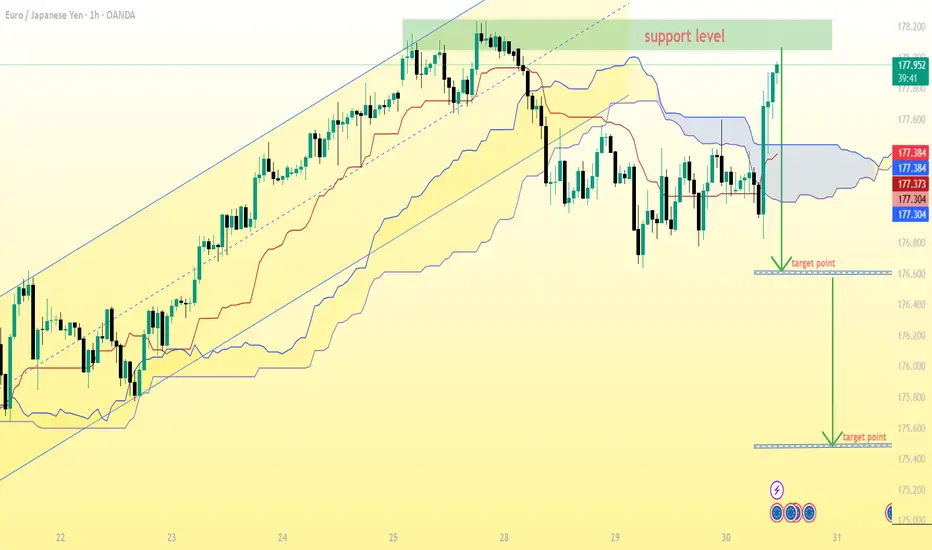
EUR/JPY (1H) chartEUR/JPY (1H) chart, here’s what can be interpreted based on my annotations and price action:
Support level (green zone): around 178.00 – 178.20
Current price: 177.88
Breakdown below cloud: already happened previously, price retested resistance (support turned resistance) and dropped again.
My also drawn two target points below — one short-term and one deeper move.
---
🎯 Target Analysis
From my markings and price structure:
First target (short-term): around 176.40 – 176.50
→ This aligns with my first green arrow and matches a previous minor swing low.
Second target (main target): around 175.20 – 175.30
→ This is the lower arrow, which aligns with the bottom of my previous structure (major support zone).
---
📊 Trade Idea Summary
If my looking at a short setup (since price rejected the resistance zone):
Sell Entry: below 177.70 (confirmation of rejection)
Target 1: 176.40
Target 2: 175.20
Stop-loss: above 178.20 – 178.30 (just above resistance zone)
---
⚖ Risk/Reward (approximate)
If entering at 177.70:
SL: 178.30 (≈ 60 pips risk)
TP1: 176.40 (≈ 130 pips reward)
TP2: 175.20 (≈ 250 pips reward)
➡ R:R = 1:2 to 1:4
---
✅ Conclusion:
My first target is 176.40, and my main target is 175.20.
This setup looks valid if price stays below the 178.00 resistance and cloud confirms bearish momentum.
AUD/JPY 4H chartAUD/JPY 4H chart:
The price was in an upward channel, then broke down sharply below both the Ichimoku cloud and the support trendline.
There’s a clearly marked resistance zone around 100.2–100.6, which the price rejected strongly.
The chart shows a target line drawn downward from the breakout area.
Based on the image, the target point appears to be around the 97.80–98.00 zone.
🔍 Summary:
Resistance: 100.2–100.6
Current price: ≈ 99.21
Bearish breakdown target: 97.8–98.0
Bias: Bearish continuation while below 99.6

Gold 1H – Pullback Expected as USD Softens After Jobless Claims🟡 XAUUSD – Intraday Trading Plan | by Ryan_TitanTrader
📈 Market Context
Gold is trading within a corrective structure today as the U.S. dollar weakens slightly following higher-than-expected Jobless Claims.
Market sentiment remains mixed ahead of upcoming Fed speeches, which could provide clues about December policy expectations.
• A more hawkish tone could trigger a deeper downside move toward unfilled discount zones.
• Conversely, any dovish signals may push gold into a short-term liquidity grab before resuming its corrective trend.
Liquidity remains concentrated near the $4,030 area, where price may tap into resting buy-side liquidity before forming the next bearish leg.
🔎 Technical Analysis (1H / SMC Style)
• Structure: Current bias shows corrective bearish intent following recent ChoCH → BOS sequence on H1.
• Premium Zone: The 4030–4028 region aligns with an unmitigated H1 supply — ideal for continuation shorts.
• Liquidity Sweep: Price may reach 4030 to sweep early breakout buyers before confirming downside continuation.
• Discount Zone: Strong demand sits at 3932–3934, overlapping with previous bullish displacement and unmitigated demand.
🔴 Sell Setup
• Entry: 4030 – 4028
• Stop-Loss: 4040
• Take-Profit Targets: → 3980 → 3964 → 3934 (major demand zone)
🟢 Buy Setup (Countertrend Reaction)
• Entry: 3932 – 3934
• Stop-Loss: 3925
• Take-Profit Targets: → 3964→ 3995 → 4020
(Only valid if liquidity sweep and bullish reaction occur at the demand zone)
⚠️ Risk Management Notes
• Wait for M15 BOS/ChoCH confirmation at both zones to avoid premature entries.
• Avoid trading directly at the minor support around 3964 — it is not a valid SMC entry zone.
• Prioritize the sell setup; intraday bias remains corrective-bearish within a broader range.
• Secure partial profits at the first liquidity target and trail stops according to structure.
✅ Summary
Gold is likely to seek premium liquidity near 4030 before resuming its corrective move lower.
The 4030–4028 supply area offers a clean continuation-short entry, while 3932–3934 remains the strongest discount zone for reactive long setups.
Stay adaptable — the market maintains a mild bearish tone while waiting for further Fed guidance.
FOLLOW RYAN_TITANTRADER for daily SMC setups ⚡

(ETH/USD, 3-hour imeframe...(ETH/USD, 3-hour timeframe, Bitstamp):
The chart clearly shows a descending channel with price breaking below the lower boundary, confirming strong bearish momentum.
The Ichimoku Cloud is fully bearish, and price action is below all major cloud levels — confirming continuation to the downside.
My chart already shows a target point marker at the lower projection level.
📉 Target analysis (based on my chart + structure):
Current Price: ≈ $3,511
Immediate Target (TP1): Around $3,400 (shown near the “target point” on my chart)
Next Target (TP2): Around $3,300 — previous horizontal support & channel extension
Extended Target (TP3): Around $3,180 – $3,200, if bearish momentum accelerates
🔒 Stop-loss (for short trades):
Above $3,650 – $3,700 (upper boundary of current consolidation zone / channel midline)
📈 Summary:
Trend: Bearish continuation
TP1: $3,400
TP2: $3,300
TP3: $3,180
SL: $3,650 – $3,700

XAUUSD – Consolidation Before Drop**Gold (XAUUSD) – Consolidation Before Potential Downside Move**
Gold continues to hover in a consolidation range after the recent breakout and structural shift on the 3H chart. The bullish momentum that previously dominated has now slowed, indicating a possible distribution phase forming near the $4,050–$4,100 zone.
The market structure shows repeated rejections at the upper boundary, suggesting that buyers are losing strength. With BOS (Break of Structure) confirmations in the recent candles and a clear lack of higher highs, a potential downside continuation could unfold once the current range is broken.
If sellers take control below $3,978, the next liquidity targets lie around **$3,886** and possibly **$3,614**. This scenario aligns with the broader retracement expectation after a strong prior uptrend.
However, a confirmed breakout above the consolidation area would shift the short-term bias back to bullish, with upside potential toward **$4,248** and beyond.
**Market Outlook:** Neutral → Bearish
**Bias:** Short-term corrective move expected
**Key Levels:**
* Resistance: $4,050 – $4,100
* Support: $3,886 – $3,614
**Tags:** #Gold #XAUUSD #GoldAnalysis #XAUUSDforecast #GoldPricePrediction #GoldTrading #GoldMarket #Commodities #TradingViewIdeas

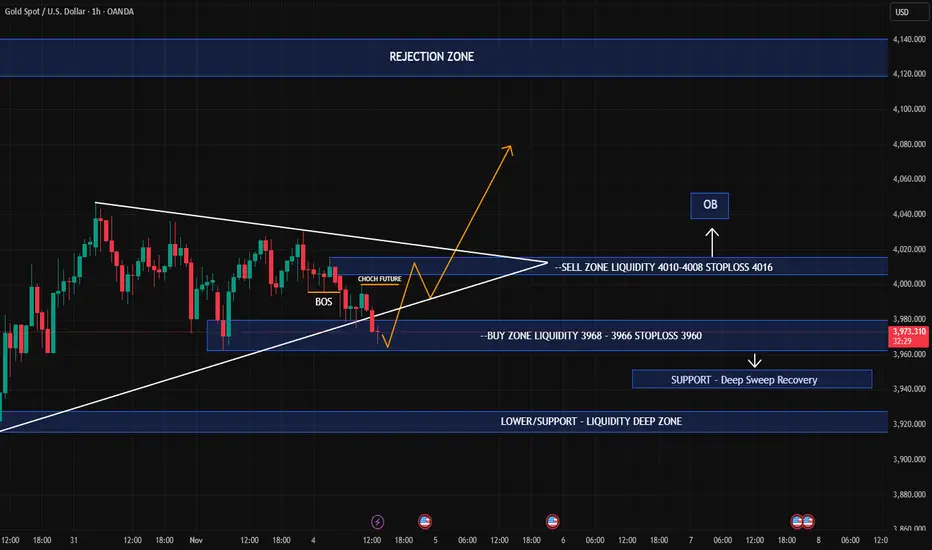
GOLD RANGE PLAY — CLEAN SUPPLY & DEMAND REACTIONS AHEAD🧭 DAILY TRADING PLAN — GOLD (XAU/USD)
Date: Nov 3, 2025
Main Timeframe: M30 – H1
Strategy: SMC + Trendline Structure + Supply/Demand Zones
🌐 MARKET CONTEXT
Gold continues to consolidate inside a symmetrical triangle, forming clear supply and demand zones within a tightening range.
Current structure shows a bearish bias below 4039 but still holding a bullish base above 3970–3980.
Both buyers and sellers have clear liquidity zones to play from — ideal for short-term reactions and fade setups.
📈 TECHNICAL OUTLOOK
🔹 BUY SCENARIO 1 (Main Setup)
BUY 3980 – 3978
→ SL: 3973 (6 pips)
→ TP1: 4010 | TP2: 4038
Structure support + local BOS. Wait for bullish rejection or engulfing confirmation.
R:R ≈ 5–9 depending on TP target.
🔹 BUY SCENARIO 2 (Aggressive Entry)
BUY 3970 – 3968
→ SL: 3963
→ TP1: 4000 | TP2: 4038
Deep retest into lower trendline + demand imbalance zone.
Only valid if market respects structure and holds above 3960.
🔸 SELL SCENARIO 1
SELL 4027 – 4029
→ SL: 4034
→ TP1: 4000 | TP2: 3970
Short from supply zone with bearish CHoCH confirmation on lower timeframe.
Rejection at this level can target liquidity below 3980.
🔸 SELL SCENARIO 2 (Higher Supply)
SELL 4037 – 4039
→ SL: 4044
→ TP1: 4010 | TP2: 3970
This is the weak high area — potential sweep zone before reversal.
Look for liquidity grab + bearish candle confirmation before entry.
🧩 STRUCTURE RECAP
Bias: Range-bound → Bearish within triangle
BOS / CHoCH: Confirmed on M30 around 4029 zone
Weak High: 4039
Strong Support: 3970–3980
Major Resistance: 4045–4128
⚙️ TRADE MANAGEMENT
Risk per setup ≤ 1–2%
Move SL → BE after TP1
Avoid entries during high-impact news
Wait for confirmation (no blind limits)
🧠 SUMMARY
Gold is ranging within a compressed structure, where shorts from supply and buys from demand both align with liquidity targets.
The cleanest play remains:
→ Buy near 3978 / Sell near 4038, trade between zones until a breakout occurs.
If price breaks and holds above 4045, expect bullish continuation to 4128.
If breaks below 3960, bearish expansion likely resumes toward 3920.

XAUUSD – Intraday H1 Plan Range-Bound Volatility(November 5, 2025)
🌐 MARKET CONTEXT
Gold is trading within a narrow range around ₹3,963 – ₹4,015, showing indecision between safe-haven demand and short-term profit-taking pressure.
After the previous New York session, price created a new local low near ₹3,962.92, then quickly rebounded as dip buyers stepped in.
However, the ₹4,015–₹4,020 zone remains a strong supply area, limiting further upside momentum.
Bias for today: Ranging with mild bullish potential
→ Prefer buying at lower supports and taking profits quickly near the ₹4,015–₹4,020 supply zone.
If price breaks below ₹3,962, deeper downside movement toward ₹3,945 may occur.
📉 TECHNICAL ANALYSIS (SMC + LIQUIDITY STRUCTURE)
Market Structure: On the H1 timeframe, XAUUSD is consolidating between the strong demand zone ₹3,962–₹3,965 and the supply zone ₹4,015–₹4,020, forming a clear sideways range.
Liquidity Map:
Below ₹3,962 lies heavy sell-side liquidity, which Smart Money may sweep before a reversal.
Above ₹4,015–₹4,020 sits buy-side liquidity, serving as the next liquidity target if a breakout occurs.
🔑 KEY PRICE ZONES
Zone Type Price Range Description
Supply Zone ₹4,015 – ₹4,020 Short-term supply zone, likely to trigger sell reactions
Order Block ₹4,010 – ₹4,008 Quick reaction zone during London session
FVG zone ₹3,956-₹3,960 as a retest reaction area to look for confirmed Buy setups if the higher-timeframe trend remains bullish, or Sell on retest if price breaks below this zone
Deep Demand - OB ₹3,935 – ₹3,940 Deep buy zone, for liquidity sweep setups
⚙️ TRADE SETUPS
✅ BUY SCENARIO 2 – OB Reaction Entry
Entry: ₹3,935 – ₹3,934
Stoploss: ₹3,928
TP1: ₹3,970
TP2: ₹4,000
Logic: Price may sweep liquidity below the FVG and mitigate the H1 Bullish Order Block (₹3,935–₹3,944); if CHoCH/BOS confirms reversal, enter buy targeting the previous imbalance and liquidity above ₹4,000.
✅ BUY SCENARIO 2 – FVG Rebalance Entry
Entry: ₹3,955 – ₹3,954
Stoploss: ₹3,948
TP1: ₹3,985
TP2: ₹4,015
Logic: Price retraces to fill the ₹3,955–₹3,954 H1 FVG within the discount zone; if bullish CHoCH/BOS confirms a reversal, execute buy entry targeting liquidity above recent highs.
🔻 SELL SCENARIO – From Short-Term Supply Zone
Entry: ₹4,011 – ₹4,009
Stoploss: ₹4,017
TP1: ₹3,990.000
TP2: ₹3,965.000
Logic: Price reaches supply zone, forms rejection or bearish engulfing → valid short setup within range.
⚠️ SCALPING SELL – Quick Reversal Opportunity
Entry: ₹4,020 – ₹4,022
Stoploss: ₹4,028
TP: ₹4,000.000 – ₹3,985
Logic: If price spikes to ₹4,020–₹4,022 sweeping buy-side liquidity and quickly rejects → short scalp opportunity.
🧠 NOTES / SESSION PLAN
Focus on London and New York sessions when liquidity is highest.
Wait for H1 candle confirmation (wick, retest, or CHoCH) before entering any trade.
Avoid trading just because price touches the zone — confirmation is key.
Risk management: limit exposure to ≤1% per trade; maintain at least a 1:2 RR ratio.
When price approaches entry zones, use M15 timeframe to confirm structure and momentum before executing.
🏁 CONCLUSION
Within the ₹3,962.92 – ₹4,015.04 range, XAUUSD is consolidating tightly.
→ Prefer buying near ₹3,965–₹3,963 upon confirmation, or deep buys at ₹3,958–₹3,956 after liquidity sweep.
→ Conversely, if price rallies to ₹4,015–₹4,020 and shows rejection signals, short opportunities may arise.
Trade according to structure, wait for confirmations, and manage risk strictly to avoid stop-hunts.

XAG/USD (Silver vs USD) chart on the 2-hour timeframe...XAG/USD (Silver vs USD) chart on the 2-hour timeframe:
Price is moving within a descending channel, still below the Ichimoku cloud, indicating continued bearish pressure.
The recent candle is showing a rejection from the upper band of the channel / cloud resistance area (around 47.9–48.1).
My marked two target points on the chart — both aligning with the lower parts of the descending channel.
🎯 Target Zones (Bearish Outlook)
1. First target: around 46.00 – 46.20
→ This aligns with the mid-channel support and my first “target point” marking.
2. Final target: around 42.00 – 42.30
→ This corresponds to the lower channel boundary and my second, deeper target point on the chart.
🔹 Summary
Bias: Bearish below 48.10
Entry area: 47.8 – 48.0 rejection zone
Targets:
🎯 TP1 = 46.10
🎯 TP2 = 42.20
Invalidation: A sustained close above 48.20 would weaken this bearish structure and could trigger a cloud breakout.

GBP/USD (1-hour) chart...GBP/USD (1-hour) chart:
Price is moving within a descending channel, and currently testing the upper boundary of that channel.
The Ichimoku cloud above the price suggests a bearish bias, as price remains below the cloud.
There’s a projected leg down (green arrow) marked on my chart — pointing toward the lower channel line.
🎯 Likely Target Zone
If the move respects the current channel and the upper rejection holds:
Short-term downside target: around 1.2910–1.2920, aligning with the lower channel trendline and my marked “target point.”
Intermediate resistance: near 1.3040–1.3060 (top of the cloud / channel upper edge).
Summary:
📉 Sell bias below 1.3040
🎯 Target: 1.2910–1.2920
❌ Invalidation: If price breaks above 1.3070 with strong candles (then potential reversal).

XAU/USD – SELL SETUP AT 3999–4001 | REJECTION FROM DOWNTREND ZON🪙 XAU/USD — SELL SETUP AT 3999–4001 | REJECTION FROM DOWNTREND ZONE
📊 Market Context:
Gold is still respecting the descending trendline structure, showing multiple rejections at the resistance zone near 4000–4005. The recent rally seems corrective within a broader bearish framework. Liquidity has been swept above previous highs, followed by a clear CHoCH back to bearish order flow.
📉 Technical Breakdown:
Structure: BOS confirmed on H1, CHoCH on M30 aligns with bearish continuation.
Key Levels:
Sell Zone: 3999–4001 (previous supply + trendline retest)
Buy Zone: 3939–3937 (retest of demand + equal lows area)
Momentum: RSI is failing to sustain above 50 and showing lower highs — confirming potential weakness.
Bias: Bearish until price closes decisively above 4005.
🎯 Trade Idea:
Entry: SELL 3999–4001
Stop Loss: 4007 (≈6 pts above entry)
Take Profit:
TP1: 3950
TP2: 3939
TP3: 3910 (extended target if momentum continues)
📈 Alternative Plan (if pullback deepens):
If price reclaims 4005, wait for liquidity sweep above 4010 and look for bearish confirmation again — otherwise, invalidation of the short bias.
🧠 Summary:
Gold remains capped under major resistance. Short positions around 4000 align with both multi-timeframe structure and momentum divergence. Bulls need a strong breakout above 4005 to shift bias back to bullish.

XAUUSD – Intraday H1 Plan: Liquidity Sweep or Reversal Base?Date: November 4, 2025
Timeframe: H1
🌐 MARKET CONTEXT
Gold is consolidating between $3,976 and $4,006 after a volatile session yesterday.
Market sentiment remains mixed, as traders weigh the rebound in U.S. Treasury yields against ongoing geopolitical and inflation concerns.
Recent move: Gold rebounded from the $3,975 low after a minor liquidity sweep below last week’s range.
Sentiment: Neutral-to-bullish in the short term — safe-haven demand still provides a soft floor.
Sessions to watch:
London session: Expect retracement and liquidity grab below intraday lows.
New York session: Possible expansion to the upside if $4,000 zone holds as support.
Macro Bias: Mildly bullish if price maintains structure above $3,980–$3,985; potential liquidity sweep downside before reversal.
📉 TECHNICAL ANALYSIS (SMC + LIQUIDITY STRUCTURE)
Market Structure:
H1 is forming a short-term accumulation range with liquidity resting below $3,976 (SSL) and above $4,006 (BSL).
A break and close above $4,005.5 may trigger a short-term BOS → potential push toward $4,015–$4,020.
Key SMC Confluences:
$4,200–4,230 Extended Resistance – higher untested supply if momentum returns.
Demand Zone: $3,978–$3,980 → aligned with FVG + previous sweep low.
Supply Zone: $4,004–$4,006 → previous OB + high liquidity.
🔑 KEY PRICE ZONES
Price Zone Type Explanation
4,006–4,004 🔴 Supply Previous high + BSL liquidity
3,996–3,994 🟡 Resistance Equilibrium rejection zone
3,986–3,984 🟢 Demand OB + CHoCH base support
3,980–3,978 🟢 Strong Demand SSL sweep + FVG confluence
3,976–3,974 ⚠️ Liquidity Sweep Deep liquidity / stop-hunt zone
⚙️ TRADE SETUPS
✅ BUY SCENARIO 1– Deep Sweep Recovery
Entry: 3,968–3,966
Stoploss: 3,960
TP1: 3,988
TP2: 3,996
TP3: 4,004
Logic: SSL sweep below the range + FVG mitigation → bullish reaction expected during London open.
🚫 SELL SCENARIO – Supply Rejection
Entry: 4,010–4,008
Stoploss: 4,016
TP1: 3,994
TP2: 3,986
TP3: 3,980
Logic: Price sweeps the previous BSL liquidity above $4,006 → look for bearish CHoCH + confirmation candle M5 before entry.
⚠️ SCALPING SELL – Aggressive Short
Entry: 4,008–4,009
Stoploss: 4,012
TP: 3,998 – 3,990 – Open
Logic: High-risk scalp at liquidity spike above day’s high; confirm rejection with volume drop.
🧠 NOTES / SESSION PLAN
Prioritize long setups near $3,980–3,984 zone during London open.
Look for liquidity sweep before entering — avoid premature entries.
During NY session, re-evaluate if gold re-tests the $4,004–$4,006 supply zone.
Avoid overtrading; use smaller position sizing due to narrow range ($30).
Always wait for H1 close confirmation before committing.
🏁 CONCLUSION
Gold remains range-bound within $3,976–$4,006, but the structure hints at a potential bullish bias if liquidity below $3,978 is swept first.
The preferred buy zones are $3,984–$3,986 and $3,978–$3,980, while sell reactions may occur near $4,004–$4,006.
Expect whipsaw volatility between London and NY overlap; trade only with clear SMC confirmations and proper risk control.
Gold Price Action: Healthy Pullback Within Broader UptrendGold is currently trading within a well-defined range on the daily timeframe, consolidating between 3,910 and 4,025 on a closing basis. Over the past several sessions, we've witnessed multiple attempts by buyers to reclaim the psychological 4,000 level, but sellers have consistently stepped in during intraday rallies, keeping the price action contained within this range.
From my perspective, this consolidation is likely to persist for a while longer. Looking ahead, I anticipate the range could potentially extend between 3,850 and 4,200 over the coming weeks as market participants digest recent moves. It's worth noting that we should prepare for a worst-case scenario where price breaks below 3,850 on a closing basis, especially given that volatility tends to pick up during year end trading.
That said, My view in this current phase as a healthy correction within the broader bull market. My bias remains tilted toward the buy side, and I'm expecting a potential resumption of the uptrend somewhere in the next 1-2 months, possibly around mid-January. The key here is patience with money management allowing this consolidation to play out while staying ready to capitalize on the next directional move. As always, proper risk management is crucial, particularly with year-end volatility on the horizon.

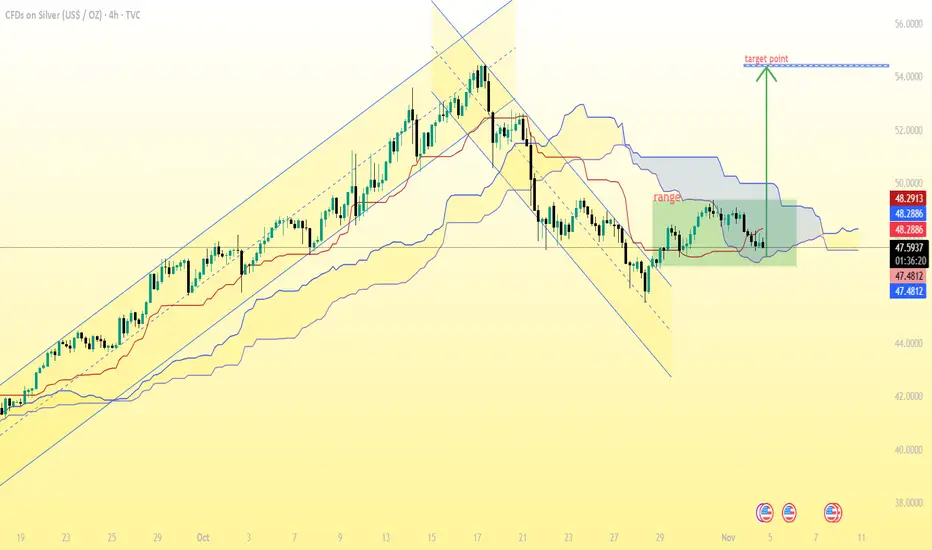
(Silver / USD, 4H timeframe)...(Silver / USD, 4H timeframe):
✅ Analysis Summary:
The price has broken out of a falling channel and is now moving inside a range, just below the Ichimoku cloud.
The projected move (marked on my chart) shows a bullish breakout from the range.
The measured move target from the breakout zone points upward to the $52.15–$52.50 area.
📈 Target Levels:
Immediate resistance: $48.30 – $48.70
Breakout confirmation: Above $49.00
Main bullish target: $52.10 – $52.50
Extended target (if strong momentum): $53.80 – $54.00
📉 Support levels:
$47.50 (near cloud base)
$47.00 (range bottom)
➡ Conclusion:
If Silver sustains above $49.00, the next target is $52.15 – $52.50 as shown in my chart.
If it fails to hold above $47.50, the bullish setup becomes invalid.
L
(EUR/USD, 2-hour timeframe...(EUR/USD, 2-hour timeframe, with Ichimoku Cloud and descending channel):
The price is currently breaking below the lower channel boundary and the Ichimoku Cloud is fully bearish — both strong continuation signals.
The chart shows a projected “Target Point” zone around 1.1415, which seems to be the first target area marked.
If bearish momentum continues below 1.1415, the next extended downside targets can be:
TP1: 1.1415 (already shown on my chart)
TP2: 1.1380 (next support zone from previous swing)
TP3: 1.1350 (major channel base & psychological support)
📉 Summary:
Trend: Bearish
Immediate Target: 1.1415
Next Targets (if breakdown continues): 1.1380 → 1.1350
Stop-loss (for shorts): Above 1.1485–1.1500 (upper channel resistance)

BTC/USDT (4h timeframe)...BTC/USDT (4h timeframe), I can summarize what’s visible and help interpret my targets:
Current price: Around $107,469
Chart setup: my using Ichimoku Cloud (Kumo) with marked zones:
Resistance level (green zone) around $107,000 – $108,000
Two target points drawn on the chart:
First target point: around $111,350 – $111,500
Second (higher) target point: around $116,500 – $117,000
✅ Summary of target levels visible on my chart:
1. Target 1: ~$111,350
2. Target 2: ~$116,700
These targets are likely based on a breakout above the Ichimoku Cloud and prior resistance zones.

Gold Squeeze: Range Breakout Can Trigger $4,100+ MoveLooking at the current gold price action on the H1 chart, we're seeing a technical setup that's been developing over the past several sessions. The market has clearly established a well-defined range between approximately $3,900 and $4,040, with price respecting both the upper and lower boundaries quite consistently.
price is holding above this ascending support while simultaneously testing the middle-to-upper zone of the range suggests building bullish momentum.
We've seen multiple attempts to push lower get absorbed by buyers, creating a series of higher lows that demonstrate underlying strength. The grey horizontal zone around $4,020-$4,040 represents the key resistance level where sellers have previously shown up, but notice how price action is becoming increasingly compressed near this level a classic sign that a breakout may be imminent.
From a probability standpoint, the combination of higher lows, sustained buying interest, and the current positioning near range highs favors an upside breakout. If gold manages to close convincingly above $4,040, we could see an accelerated move toward the $4,100+ zone fairly quickly, as there's limited technical resistance overhead once this range ceiling is breached.
However, it's worth noting that range-bound markets can be deceptive, and false breakouts are always a possibility. The key will be watching for a decisive move with strong volume and follow-through. Until we get that confirmation, remaining patient with existing positions while maintaining appropriate risk management makes sense.
The market appears coiled and ready to make its next significant move all signs point to higher prices, but as always, let the price action confirm the breakout before adding to positions.

XAU/USD (Gold Spot vs. U.S. Dollar) 1-hour chart XAU/USD (Gold Spot vs. U.S. Dollar) 1-hour chart on TradingView.
Here’s what I can observe:
There is a symmetrical triangle pattern (a type of consolidation pattern) drawn on the chart.
The price appears to be breaking out upwards from the triangle.
There’s an arrow drawn upward with a “target point” marked above current price levels.
To calculate the target from this breakout:
📈 Symmetrical Triangle Target Formula:
Target = Breakout Point ± (Height of the Triangle)
1. Measure the height of the triangle:
From the highest point of the pattern to the lowest point within the triangle.
Approximate values (from the chart):
High ≈ 4,080
Low ≈ 3,940
→ Height ≈ 140 points
2. Add the height to the breakout level:
Breakout ≈ 4,000
→ Target ≈ 4,000 + 140 = 4,140
🎯 Estimated Target: 4,140 USD
That matches closely with the dashed horizontal line labeled “target point” on my chart — right around 4,120–4,140.
So, my bullish target zone after breakout is approximately 4,120–4,140 USD per ounce.

Gold Continues to Struggle at 4000We're seeing a familiar story play out in gold as it makes multiple attempts to reclaim and hold above the 4000 level, but none of these efforts are showing the conviction we need to see from buyers. The price action on the hourly chart is particularly telling ,we're witnessing similar structural patterns repeating themselves, which often indicates indecision or a lack of strong directional commitment from either side. Once again, we've seen the rising support trendline get broken, which is not ideal for the bullish case in the short term.
However, there's a small silver lining worth noting. Today's CPR is showing an ascending structure, which typically carries some positive implications for intraday sentiment. It's not a game-changer by itself, but it does suggest that the technical setup isn't completely bearish. The key level to focus on for today's session is the CPR BC at 3971. This becomes our pivotal point ,if bulls can sustain trading above this level throughout the day, we could see another recovery attempt materialize toward the higher side. The ability to hold above 3971 would at least keep the door open for further upside exploration.
On the flip side, if we fail to maintain support at 3971 during the intraday session, it could trigger another leg down toward lower levels. Given the repetitive failed attempts at 4000 and the breakdown of support trendlines, the market is clearly at a crossroads here. We need to see some decisive action one way or the other to break out of this choppy, repetitive pattern.
As for my positioning, there's no change to my approach. I'm still holding my buy positions and actively managing the trades as this price action develops. The patience game continues, and while these repeated failures at 4000 are testing that patience, the broader picture still supports the long-term bullish thesis.

#Gold | From Double Top Breakdown to Potential W Reversal#XAUUSD | 4H Chart
Formed an M pattern (Double Top) , broke down, and completed its target ✅
Now taking support at the demand zone, showing early signs of a W-pattern formation (potential bullish reversal).
Support: 3944.43 / 3915.52 / 3892.95-3897.13
Immediate Resistance: 4030.34-4033.87
Key Resistance Levels:
4056.70-4065.52 / 4133.00-4154.79 / 4185.91-4205.12 (previous M-pattern breakdown zone)
Expectation:
If #XAUUSD surpasses 4034 on 4 HCB , price may retest the M-pattern breakdown zone (4185-4205) .
#Gold #XAUUSD #Wpattern #Mpattern #ChartPattern #PriceAction #Commodities
📌 Disclaimer: This analysis is shared for educational purposes only. It is not a buy/sell recommendation. Please do your own research before making any trading decisions.

#Silver | Falling Wedge + Inverse H&S = Bullish Cocktail#XAGUSD | 4H Chart
Head & Shoulders completed its breakdown target ✅
Price found support at the demand zone, formed a falling wedge breakout, and built an Inverse H&S.
Now consolidating right below the neckline, watching Immediate Resistance @48.464 👀
Above this, potential retest of key resistance zone 49.459 – 50.475/50.897 (previous H&S breakdown area).
Bias: Bullish above 48.464; confirmation on 4H close 🔥
#Silver #XAGUSD #HeadnShoulders #FallingWedge #InverseHeadnShoulders #PriceAction
📌 Disclaimer: This analysis is shared for educational purposes only. It is not a buy/sell recommendation. Please do your own research before making any trading decisions.

AUD/USD (3H)...AUD/USD (3H) chart, here’s a breakdown of what I see and how the target can be projected:
---
🧠 Pattern Analysis
My identified a Cup and Handle pattern, which is a bullish continuation setup.
Cup low: around 0.6450
Cup rim (resistance / breakout level): around 0.6580 – 0.6590
Current price: ~0.6585 (right around the breakout level)
Handle: short pullback, touching near Ichimoku cloud support — healthy structure before potential breakout.
---
🎯 Target Projection (Cup & Handle Rule)
Cup and Handle target = Breakout level + Depth of the cup
Depth of cup:
0.6585 (rim) – 0.6450 (bottom) = 0.0135
Target = 0.6585 + 0.0135 = 0.6720
---
✅ Target Summary
Entry (breakout confirmation): above 0.6590
Target: 0.6720
Stop-loss: below 0.6535 – 0.6540 (below handle & cloud support)
Risk/Reward ratio: ~1:2.5
---
💡 Bonus Confirmation
Price is above the Ichimoku Cloud (bullish bias).
Handle retracement is shallow and respecting Tenkan/Kijun lines — typical of strong continuation setups.
Volume on breakout (watch for increase) would add confirmation.
---
Final Target: 0.6720 (main take-profit zone)
